
Abstract
Background
In Germany there is a large wealth gap between East and West Germans as well as a gap in life satisfaction, with people in East Germany reporting to be less satisfied. This paper intends to shed light on the role of the different levels of wealth and their association with life satisfaction. On a wider scale, this paper examines psychological consequences of wealth inequality between large societal groups.
Method
Longitudinal data from the years 2007, 2012, and 2017 of the German Socio-Economic Panel (GSOEP) with a sample size of N = 5066 (Nfemale = 2522, Nwest = 3756, mage2007 = 50.46) was used. To test our hypothesis, multiple linear regression models as well as a fixed-effects regression model were run. Furthermore, to examine the development of wealth distribution between different birth cohorts in East and West Germany a latent growth curve model was calculated.
Results
Net-worth was found to be a highly significant predictor for life satisfaction. This holds true for variance between respondents as well as for individual change over time within respondents. Additionally, the results show that the wealth gap between East and West Germans in total as well as within most of the birth cohorts increased.
Conclusion
Due to their socialistic history and the related obstacles in acquiring wealth as well as the unbalanced distribution of GDR-assets after the reunification, East Germans are significantly less wealthy than West Germans. This has consequences on the mental well-being and the life satisfaction of East Germans.
Introduction
Over the past decades, life satisfaction received a lot of attention in the fields of psychology, sociology, and economy (Clark 2018; Diener et al. 1999; Diener et al. 2017). There are even attempts to establish life satisfaction as a central indicator for the efficacy of political actions (Diener et al. 2015; Diener and Seligman 2004). This is due to its relevant link to many important facets of human life like mental health (Beutel et al. 2010; Lombardo et al. 2018), physical health, and longevity (Diener and Chan 2011). For Germany, with its history of division into two separate states, life satisfaction is an important aspect: Since the reunification in 1990 there has always been a gap in life satisfaction between East and West Germans (Easterlin 2009; Easterlin and Plagnol 2008; Petrunyk and Pfeifer 2016; Vatter 2012). Even 30 years later, people in East and West Germany still differ in their perceived level of satisfaction with life (Statistisches Bundesamt (Destatis) 2021). On the one hand, the difference in life satisfaction can be attributed to past and present objective circumstances, e.g. macroeconomic conditions such as labor market conditions, level of GDP, and economic growth (Vatter 2012). This is further affirmed by the fact, that birth cohorts raised in the former GDR show a larger gap in life satisfaction (Biermann and Welsch 2021; Petrunyk and Pfeifer 2016) than those cohorts raised before and after. On the other hand, differences in individual factors like income (Frijters et al. 2004; Petrunyk and Pfeifer 2016), unemployment status (Petrunyk and Pfeifer 2016; Vatter 2012), and satisfaction with democracy (Biermann and Welsch 2021) also account for differences in life satisfaction between East and West Germans. Even though it has been shown that differences in socioeconomic factors like income play an important role in explaining the “happiness gap”, there is a lack of research examining the effect of wealth differences between East and West Germany on life satisfaction. Headey (2019) showed that both 1-year and 5-year correlations and regressions indicate stronger associations between wealth and life satisfaction compared to income.
Brulé and Suter (2019) differentiated three different types of effects of wealth on life satisfaction: Direct effects are especially related to health changes and happiness; wealth buffers negative effects of certain life changes, such as unemployment; inequality leads to higher chances of distrust, status anxiety, perceived conflicts, and a general dissatisfaction. During times of economic instability or insecurity, such as unemployment, illness, retirement or dependence on social assistance, wealth serves as a safeguard: A certain level of consumption may be maintained even though unemployment compensations or pensions can be rather low (Brulé and Suter 2019; D’Ambrosio et al. 2020). As a consequence, financial security leads to a higher sense of control over one’s own life which is positively associated with well-being (Johnson and Krueger 2006). Additionally, Hauser (2007) defines seven functions of wealth that have direct and buffer effects on life satisfaction: the security function of wealth; the income function, with wealth generating income on its own; the use function for consumption; the power function for increasing influence; the social status attainment and positioning function, enabling a “happier” position in society; and the inheritance function. It is thus very plausible that wealth has not only a larger and more continuous effect on life satisfaction but is also a more suitable indicator financially. By using wealth instead of income as an indicator in this study, an important economic aspect of inequality regarding life satisfaction and health can be revealed.
As wealth has such a strong association to life satisfaction, its distribution in East and West Germany becomes relevant. Even 25 years after reunification, private households in East Germany have possessed less than half of the financial wealth of those in West Germany (Grabka 2014). Looking at the wealth discrepancy from a cross-sectional perspective, the differences do not exist in younger cohorts. It is questionable whether this holds true when taking a longitudinal perspective. This is due to ‘Matthew’s principle’ which means that the wealthy build up their fortune quicker than the less fortunate. Szydlik (2004) indicates that due to Matthew’s principle less money can be inherited from people living in the former GDR.
By focusing on wealth in our current study, a highly relevant extension of happiness research is made through investigating the consequences of wealth gaps between large societal groups on life satisfaction.
Hypotheses
Following the theoretical background above, these four hypotheses are formulated to highlight the vast differences both in life satisfaction and wealth between East and West Germans:
-
H1. Life satisfaction differs significantly between East and West Germans.
-
H2. There is a positive linear association between wealth and life satisfaction between respondents.
-
H3. There is a positive linear association between wealth and life satisfaction within respondents over the panel years.
-
H4. Wealth differences between East and West Germans within panel years increase over time, especially regarding younger cohorts.
Method
Sample description
For our study, data of the German Socio-Economic Panel (GSOEP) was used. The GSOEP is an annual panel survey of German households that started in 1984. Three different time points, namely the years 2007, 2012 and 2017 were used. This is when detailed information of assets and debts have been gathered on an individual level. For our analyses, only participants who were above the age of 18 years in 2007 and did not move between East and West Germany during the time period were included, as well as data of people who answered all variables of interest at all three time points. The total sample consists of N = 5066 (see Table 1 for detailed sample description) participants. Before participating in the study all participants gave their informed consent.
Variables
Net-worth was calculated by subtracting the individual value of debts from the individual value of assets. The questions were asked in the form of: “how high is the current (market) value of …”, with a brief explanation of words used in the question, e.g. “market value is the price you would get by selling the property”. The total value of assets was calculated by summing up the value of (1) real estates (own use and non-own use), (2) monetary assets, (3) insurance assets, (4) building saving contracts, (5) stocks and business assets, and (6) tangible assets. Debts consist of (1) mortgage loans and (2) other credits. Additionally, to deal with the large variance in the net-worth variable, first an inverse hyperbolic sine function transformation of net-worth for the regression analyses was conducted. The inverse hyperbolic sine function is a monotonic transformation comparable to the log transformation. But contrary to the log transformation, it is defined at zero and can take negative values into account (Pence 2006). Second, for a more accessible interpretation of values, a net-worth transformation variable for the following latent growth curve model (LGCM), dividing the net-worth by the factor of 10,000 has been used.
Life satisfaction is measured with the question “How satisfied are you with your life, all things considered?”. Answers can take a value from 0 to 10, with 10 being the highest form of satisfaction. State of Health is assessed on a scale from 1 (“very good”) to 5 (“bad”) using the question “How would you describe your current health?”. The Equivalized Income was calculated by dividing the total household income by the root square of people living in the household. Again, to deal with the large variation in variance, an equivalized income factor variable was calculated by dividing the equivalized income by 1000. For Education the CASMIN-classification in the GSOEP was used to code a dummy-variable identifying people on a tertiary education level (1) and below (0). People who lived in East Germany before the reunification in 1989 and who were living in East Germany at all given time points were treated as East Germans.
Analytical strategy
First, linear regression models for every time point were conducted to test whether net-worth played a significant role for life satisfaction even when other relevant variables are controlled for (H1 and H2). Additionally, to be able to interpret the effect of changes of individual net-worth on individual life satisfaction, a balanced fixed-effects panel regression model (H3) was calculated. After identifying net worth as a relevant predictor for life satisfaction a latent growth curve model (H4) was used to highlight the development of net-worth between East and West Germans in general and different age groups. To deal with the large variance differences in the factor net-worth variable, the top 1% at every time point as outliers (total excluded participants: N = 59, West Germans = 57, East Germans = 2) were excluded.
Results
Descriptive statistics of the variables used in our models can be found in Table 1. Since only those respondents were included in the analysis who participated in each survey year, the mean age is continuously rising. Furthermore, the proportion of people attaining a university degree during the observed panel years is only marginal. Apart from the subjective health status, all differences between East and West Germans are significant.
In 2007, in regards of net wealth, West Germans are the wealthier group (medianWest = 152,000 € vs. medianEast = 49,225 €). West Germans earn about 300 € more than East Germans. Furthermore, unemployment among East German respondents was 5% higher than among West Germans. The mean life satisfaction of West Germans (mean = 7.36) is higher than in East Germany (mean = 6.73).
In 2012, West Germans again show a higher net wealth compared to the East (medianWest = 169,200 € vs. medianEast = 60,800 €). Thus, wealth has increased in both groups. Again, equivalent household income is higher in West Germany. Unemployment rates still differed. East Germans reported a small increase in life satisfaction (mean = 6.87), whereas West Germans were similarly satisfied (mean = 7.34).
In 2017, it can be shown that wealth, liabilities and equivalent household income present considerable differences in their means and medians, which is why outliers have to be regarded carefully. West Germans were the wealthier group. Both their median gross wealth and their median net wealth exceed the respective amounts of the other group by far. While the median net wealth of respondents from East Germany is 75,917 €, the West German median is 218,000 €, even though their mean liabilities are higher than in East Germany. Again, the median wealth has increased in each group. Life satisfaction also amounts to the highest values in West Germany (mean = 7.35), while the means in East Germany (mean = 6.96) have increased further. Compared to previous years, mean life satisfaction in East Germany has increased by 0.23 since 2007. Whereas East Germans become more satisfied over the years, life satisfaction in the West seems to be rather steady. Though life satisfaction differences between East and West Germany converge over the panel years, they differ significantly from one another at every time point. Employment rates do not differ considerably. In 2017, inheritance was part of the questionnaire. The amount of inherited money differs considerably between the two groups, with West Germans reporting the higher amount (median = 50,000 €) and East Germans inheriting much less (median = 15,000 Table 2 reports net-worth of different age cohorts over the years. The older the respondents, the larger the gap between East and West Germans’ net-worth values, except for the oldest birth cohort. Moreover, over the years, the differences between East and West increase, especially in the younger cohorts, which again corroborates Matthew’s principle. A fitting example is the cohort of 1970–1979: In 2007, it is the only year and cohort with a higher median net-worth for East Germans, but the advance is lost by far in 2012. Thus, West Germans of every age seem to be able to increase their wealth quicker than East Germans.
Figure 1 shows the distribution of net-worth percentiles, stratified by East and West Germans. It is apparent that East Germans are overrepresented when looking at lower percentiles, while West Germans are overrepresented in the upper percentiles. Thus, the less wealthy respondents are residing in the East, whereas the wealthier ones are mostly West Germans.
Distribution of net-worth percentiles in 2017, stratified by East and West Germans
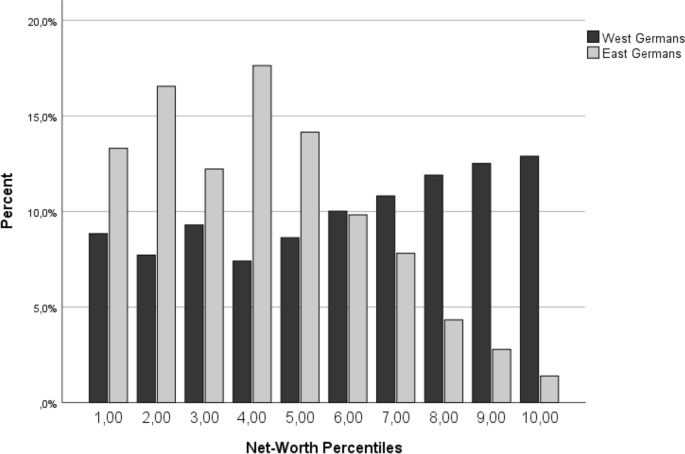
This leads to the question whether wealthier people are also happier than the less wealthy ones. Figure 2 shows the difference in life satisfaction for four different net-worth classes. It is visible that in each survey year, the wealthier respondents are also more satisfied with their lives. Still, the least wealthy group seems to converge, as their mean life satisfaction increases linearly, contrary to the other three groups.
Difference in life satisfaction between different net-worth groups
Table 3 shows the results of the linear regressions at the three time points. With adjusted R2s between .252 and .284 the variables can explain a considerable proportion of the variance in life satisfaction. All variables had a highly significant impact on life satisfaction (p < .001), apart from sex that is only significant (p < .05) in 2007. Thus, men state a significantly higher life satisfaction, although the effect size is rather small (std. β = .029). Both increasing equivalent household income and personal wealth have significant, positive effects on life satisfaction. A larger impact is presented by subjective health status, as a worse-rated health has a significantly negative effect on life satisfaction (std. β = −.514 to −.429). Further control variables, namely age, a university degree and current employment, have significantly positive impacts on life satisfaction. At all time points respondents from East Germany are significantly less satisfied with their lives (std. β = −.083 to −.130).
A Fixed Effects-Regression was modelled to investigate covariates’ effects on life satisfaction within the respondents over the years (H3). This way, a direct, causal effect of wealth on life satisfaction can be tested. The respondents and panel years were clustered and additionally panel years were controlled for to prevent time effect bias. As assumed when looking at the cross-section regression, declining health has a highly significant negative impact on life satisfaction within the respondents (β = −.891). Job loss also has a highly significant negative effect (β = −.849). Both increasing equivalent household income (β = .045) and personal wealth (β = .023) have highly significant positive impacts on life satisfaction. This means that every 1% increase in personal wealth leads to an average increase in life satisfaction by around .023.A significant positive within-person-effect of wealth on life satisfaction can be observed. For detailed information see Table 4.
To test the fourth hypothesis, a latent growth curve analysis was used. Results are presented in Table 5. In 2007, inhabitants of East Germany have on average around 116,300 € less net worth than people in West Germany. This wealth difference significantly increases every five years by around 20,940 €. Differences to the actual numbers are due to the sample differences. In the sample for the LGCM the top 1% in every time point are excluded, leading to an underestimation of effect sizes. There is a significant difference in the intercept between East and West Germans born after 1969. Therefore, people in East Germany born after 1969 had significantly less wealth than their West German counterparts. The slopes also differ depending on the age cohort. Only the youngest and oldest surveyed cohorts did not show a significant difference. This means that in all other age cohorts people in West Germany accumulated significantly more wealth in the reported time frame than people in East Germany. Looking at the cohort from 1970 to 1979 (28 years to 37 years in 2007), it can be seen that they did not significantly differ from each other in total wealth in 2007. Over the years the wealth gap between East and West Germans in this age cohort significantly has been widening (around 33,750 € every five years) due to the significantly higher accumulation of wealth of West Germans.
The analyses support our hypotheses:
-
H1 is confirmed since the levels of life satisfaction between East and West Germans differ significantly in every measured time point, even when controlling for relevant variables.
-
H2 can be supported as well. In each panel year, wealth has a significant effect on life satisfaction, even when controlling for other important factors, such as equivalent household income. Thus, wealthier respondents are significantly more satisfied with their lives than the less wealthy ones.
-
H3 is also supported by the analysis since respondents become more satisfied with their lives when they accumulate more wealth.
-
H4 is confirmed since a large, significant wealth gap between East and West Germany that also increases significantly over the panel years can be found. This holds true for younger age cohorts as well (but not exclusively).
Discussion
The aim of this study was to examine whether differences in life satisfaction between East and West Germans can be partly explained by differences in wealth. Net-worth was found to be a significant factor in explaining differences in life satisfaction between respondents as well as within respondents. Other relevant factors are state of health, unemployment, age, equivalent household income and having a university degree. East and West Germans also differ in the level of unemployment and in the equivalent household income. Assuming these are also relevant factors contributing to the life satisfaction gap between East and West Germans.
The latent growth curve model showed how net-worth developed differently between East and West Germans in general and among different age cohorts. Interestingly the wealth gap between East and West Germans is actually increasing. Also, in younger birth cohorts the accumulation of wealth was significantly larger for West Germans than for East Germans. It seems plausible that this was to a large extend the case because of the different values of inheritance.
Real estate shows the largest impact on wealth. In 2013, 85% of the wealth of private households in West Germany was based on real estate, whereas in East Germany, the prescriptive amount was only 73%. Both the proportion of properties used by owners and the amount of income resulting from rent is constantly higher in West Germany. Moreover, the discrepancy does not seem to converge. Because of the inequal income distribution between East and West Germany, East Germans incur higher debts when investing in real estate (Grabka 2014). As the value of real estate has been increasing in each region over the last years (Schöneich and Teske 2020), owners are increasing their wealth, thereby widening the gap between themselves and those who do not own properties – the latter being overrepresented in East Germany. Furthermore, the general market value of real estate is much higher in West Germany than it is in East Germany. That is also one factor why the reported wealth of people who own a flat or a house which is comparable in size, facilities and location will be different between East and West Germans. According to Bartels and Schroeder (2020) the different valuation and different possession rate account for 11 to 16% of the wealth difference of homeownership and 20 to 30% for other real estates.
It is unclear whether the difference in wealth may also be attributed to different personal attitudes towards accumulating wealth between East and West Germans. While West Germans grew up in a capitalistic society, where accumulating wealth was possible and an important motivation, the socialist regime of the GDR inhibited this possibility by regulating income and ownership in order to achieve equality. Therefore, West Germans not only had more time to accumulate money over generations (Fuchs-Schündeln and Schündeln 2005), their socialization also led to them being more competent in increasing their wealth through a higher financial literacy (Bucher-Koenen and Lusardi 2011). Moreover, German reunification was an economic shock for East Germany: Labor force participation, income, savings, social security entitlements, wealth levels, as well as wealth profiles were afflicted (Bönke et al. 2019; Fuchs-Schündeln and Schündeln 2005). The post reunification economic shock also led to massive redistribution of wealth between East and West Germany, since approx. 80% of the assets of the GDR-companies were sold to West Germans by the Treuhand institution. On the other side only 6% of the former GDR-assets were owned by East Germans in 1994 (Bundeszentrale für politische Bildung (Federal Agency for Civic Education) 2015).
It has been claimed that relative income is a stronger indicator of life satisfaction than absolute income (D’Ambrosio et al. 2020; Keuschnigg and Wolbring 2012). Keuschnigg and Wolbring (2012) state that status signaling plays an important role when it comes to the effect of relative income on life satisfaction; thus, face-to-face interaction is crucial. Presuming that the same effect can be expected for relative wealth, future research could focus on smaller units than East and West Germany, but still implement the regional difference by multilevel analyses.
The results of the regression analyses show that the difference of wealth, the difference of income and the higher rate of unemployment are factors contributing to the “happiness gap” between East and West Germany. Yet, even controlling for these factors, people in East Germany still show a significantly smaller level of life satisfaction. This draws the conclusion that there are other factors contributing to the “happiness gap” that have not been part of our research. One factor could be that significantly more East Germans hold a tertiary educational degree than West Germans, while at the same time they earn significantly less and have significantly less wealth. Therefore, people in East Germany may experience a higher level of status inconsistency, resulting in negative consequences for their mental wellbeing (Milner et al. 2017; Zhang 2008). Another interesting question regarding wealth and life satisfaction is if and how the different wealth assets contribute to life satisfaction. For example, it seems plausible that homeownership plays a bigger role in estimating life satisfaction than having a lot of money on the bank account, as the former may offer a higher level of security.
According to our results, the wealth gap between East and West Germans continues to increase on a significant scale. Therefore, the negative impact of the wealth difference on life satisfaction will probably continue to increase as well if no measures are taken to counteract these developments.
In the case of Germany, the connection between wealth and life satisfaction is especially relevant because of the history of division into two different states. Due to its socialist history and the implications certain policies during that time had on acquiring wealth, East Germany has fallen far behind West Germany. This wealth gap is continuing to grow with real consequences for the subjective and mental well-being of the people in East Germany. These findings are also relevant for other countries with large wealth gaps in their society like the USA, with its wealth gap between groups of different ethnical backgrounds. These findings encourage the public and policy makers to pay more attention to the psychological consequences of wealth inequality.
Limitations
The Corona pandemic changed the distribution of wealth on a large scale (Capgemini 2021). Since our most recent data is from the year 2017, the impact of the Corona pandemic on wealth distribution could not be considered in our analyses. Following the worldwide observations that the Corona pandemic exacerbated the wealth inequality between wealthy and non-wealthy individuals (Capgemini 2021), it seems likely that it accelerated the growth of wealth inequality between East and West Germans as well. Another limitation is that wealth was measured on an individual level without controlling for household wealth. This has the shortcoming that people living in a wealthy household but reporting little individual wealth do benefit from a wealthy environment but are treated as low-wealth individuals. Therefore, the impact of wealth on life satisfaction may be underestimated.
Even though the GSOEP explicitly tries to include the wealthiest people of the distribution by the “high-income sub-sample”, there is still an under-coverage of the highly wealthy people, like the top 0.5% in the GSOEP-sample. The under-coverage of this group may also lead to an underestimation of the real level of net worth in Germany and its role regarding life satisfaction.
Furthermore, the representativeness of the sample is limited since there are panel attrition effects, as higher educated people, women, older people and West Germans are more likely to continue to participate in longitudinal surveys (Siegers et al. 2020).
There are also several shortcomings regarding the reliability of some questions. First, the subjective health status was measured by a single item only, which makes it questionable if one question is suitable to cover the status of health appropriately. Second, all results of wealth are based on self-disclosure only. Apart from a possible social desirability bias, this might distort the results since it is difficult to estimate the real market value of assets. This may lead to an under- or overestimation of real values and people who are more familiar with financial matters may be more accurate in their estimations.
References
Bartels C, Schroeder C (2020) Income, consumption and wealth inequality in Germany: three concepts, three stories? No. 2, Forum New Economy
Beutel ME, Glaesmer H, Wiltink J, Marian H, Brähler E (2010) Life satisfaction, anxiety, depression and resilience across the life span of men. Aging Male 13:32–39. https://doi.org/10.3109/13685539
Biermann P, Welsch H (2021) An anatomy of east German unhappiness: the role of circumstances and mentality, 1990–2018. J Econ Behav Organ 181:1–18. https://doi.org/10.1016/j.jebo.2020.11.027
Bönke T, Grabka MM, Schröder C, Wolff EN, Zyska L (2019) The joint distribution of net worth and pension wealth in Germany. Rev Income Wealth 65(4):834–871. https://doi.org/10.1111/roiw.12371
Brulé G, Suter C (2019) Why wealth matters more than income for subjective well-being? In: Brulé G, Suter C (eds) Wealth(s) and subjective well-being, Soc Indic res series, vol 76. Springer, Cham, pp. 1–13. https://doi.org/10.1007/978-3-030-05535-6_1
Bucher-Koenen T, Lusardi A (2011) Financial literacy and retirement planning in Germany. J Pension Econ Finance 10(4):565–584. https://doi.org/10.1017/S1474747211000485
Bundeszentrale für politische Bildung (Federal Agency for Civic Education) (2015) Das Vermögen der DDR und die Privatisierung durch die Treuhand. https://www.bpb.de/geschichte/deutsche-einheit/zahlen-und-fakten-zur-deutschen-einheit/211280/das-vermoegen-der-ddr-und-die-privatisierung-durch-die-treuhand#footnode13-13. Accessed 3 December 2021
Capgemini (2021) World Wealth report. Available at Capgemini (2009). World Wealth report. Available at https://www.capgemini.com/de-de/news/world-wealth-report-2021/. Retrieved August 20, 2021
Clark AE (2018) Four Decades of the Economics of Happiness: Where Next? Rev Income Wealth 64(2):245–269. https://doi.org/10.1111/roiw.12369
D’Ambrosio C, Jäntti M, Lepinteur A (2020) Money and happiness: income, wealth and subjective well-being. Soc Indic Res 148:47–66. https://doi.org/10.1007/s11205-019-02186-w
Diener E, Chan MY (2011) Happy people live longer: subjective well-being contributes to health and longevity. Appl Psychol Heal Well-Being 3(1):1–43. https://doi.org/10.1111/j.1758-0854.2010.01045.x
Diener E, Suh EM, Lucas RE, Smith HL (1999) Subjective well-being: three decades of progress. Psychol Bull 125:276–302. https://doi.org/10.1037/0033-2909.125.2.276
Diener E, Heintzelman SJ, Kushlev K, Tay L, Wirtz D, Lutes LD, Oishi S (2017) Findings all psychologists should know from the new science on subjective well-being. Ca Psychol 58:87–104. https://doi.org/10.1037/cap0000063
Diener E, Seligman MEP (2004) Beyond money: toward an economy of well-being. Psychol Sci Public Interest 5:1–31. https://doi.org/10.1111/j.0963-7214.2004.00501001.x
Diener E, Oishi S, Lucas RE (2015) National accounts of subjective well-being. Am Psychol 70(3):234–242. https://doi.org/10.1037/a0038899
Easterlin RA, Plagnol AC (2008) Life satisfaction and economic conditions in east and West Germany pre- and post-reunification. J Econ Behav Organ 68:433–444. https://doi.org/10.1016/j.jebo.2008.06.009
Easterlin RA (2009) Lost in transition: life satisfaction on the road to capitalism. J Econ Behav Organ 71:130–145. https://doi.org/10.1016/j.jebo.2009.04.003
Frijters P, Haisken-DeNew J, Shields M (2004) Money does matter! Evidence from increasing real income and life satisfaction in East Germany following reunification. Am Econ Rev 94(3):730–740. https://doi.org/10.1257/0002828041464551
Fuchs-Schündeln N, Schündeln M (2005) Precautionary savings and self-selection: evidence from the German reunification “experiment”. Q J Econ 120(3):1085–1120. https://doi.org/10.1093/qje/120.3.1085
Grabka MM (2014) Private Vermögen in Ost- und Westdeutschland gleichen sich nur langsam an. DIW Wochenbericht Nr 40(2014):959–966
Hauser R (2007) Integrierte analyse von Einkommen und Vermögen — Forschungsstand und Ausblick. Weiterentwicklung der Reichtumsberichterstattung der Bundesregierung: Experten-workshop am 29. November 2006 in Berlin: 12–34
Headey B (2019) Wealth influences life satisfaction more than income: a supplement to the Easterlin paradox. In: Brulé G, Suter C (eds) Wealth(s) and subjective well-being, Soc Indic res series. Springer, Cham, vol 76, pp. 167–182. https://doi.org/10.1007/978-3-030-05535-6_8
Johnson W, Krueger RF (2006) How money buys happiness: genetic and environmental processes linking finances and life satisfaction. J Pers Soc Psychol 90(4):680–691. https://doi.org/10.1037/0022-3514.90.4.680
Keuschnigg M, Wolbring T (2012) Reich und zufrieden? Theorie und Empirie zur Beziehung von Wohlstand und Lebenszufriedenheit. Berl J Soziol 22:189–216. https://doi.org/10.1007/s11609-012-0183-2
Lombardo P, Jones W, Wang L, Shen X, Goldner EM (2018) The fundamental association between mental health and life satisfaction: results from successive waves of a Canadian national survey. BMC Public Health 18:342. https://doi.org/10.1186/s12889-018-5235-x
Milner A, Aitken Z, Kavanagh A, LaMontagne AD, Petrie D (2017) Status inconsistency and mental health: a random effects and instrumental variables analysis using 14 annual waves of cohort data. Soc Sci Med 189:129–137. https://doi.org/10.1016/j.socscimed.2017.08.001
Pence KM (2006) The role of wealth transformations: An application to estimating the effect of tax incentives on saving. Contrib Econ Anal Policy 5(1)
Petrunyk I, Pfeifer C (2016) Life satisfaction in Germany after reunification: additional insights on the pattern of convergence. Jahrb Natl Okon Stat 236(2):217–239. https://doi.org/10.1515/jbnst-2015-1010
Schöneich C, Teske M (2020) Regionalisierung des Häuserpreisindex. WISTA - Wirtschaft und Statistik 1:32–42
Siegers R, Belcheva V, Silbermann T (2020) SOEP-Core v35 – documentation of sample sizes and panel attrition in the German socio-economic panel (SOEP) (1984 until 2018) SOEP survey papers 826: series C. DIW/SOEP, Berlin
Statistisches Bundesamt (Destatis; Federal Office of Statistics) (2021) Datenreport 2021. Ein Sozialreport für die Bundesrepublik Deutschland
Szydlik M (2004) Inheritance and inequality: theoretical reasoning and empirical evidence. Eur Sociol Rev 20(1):31–45. https://doi.org/10.1093/esr/20.1.31
Vatter J (2012) Well-being in Germany: what explains the regional variation? SOEPpapers 435. DIW Berlin, Berlin
Zhang X (2008) Status inconsistency revisited: an improved statistical model. Eur Sociol Rev 24(2):155–168. https://doi.org/10.1093/esr/jcm048
Funding
Open Access funding enabled and organized by Projekt DEAL. This research was supported by the German Federal Ministry of Education and Research (grant number 01UJ1911AY). The funding source had no other role other than financial support.
Author information
Authors and Affiliations
Contributions
Conceptualization: Christoph Kasinger, Lisa Braunheim; Methodology: Christoph Kasinger, Formal analysis and investigation: Christoph Kasinger, Writing - original draft preparation: Christoph Kasinger, Lisa Braunheim; Writing - review and editing: Elmar Brähler, Manfred Beutel; Funding acquisition: Elmar Brähler, Manfred Beutel; Resources: Elmar Brähler, Manfred Beutel; Supervision: Elmar Brähler, Manfred Beutel.
Corresponding author
Ethics declarations
This research was supported by the German Federal Ministry of Education and Research (grant number 01UJ1911AY). The funding source had no other role other than financial support. The authors have no competing interests to declare that are relevant to the content of this article. Informed consent was obtained from all individual participants included in the study. There has been no prior dissemination of the data and narrative interpretations of the data. All data and materials are available and can be requested from the corresponding author.
Ethical statement
Informed consent was obtained from all individual participants included in the study. There has been no prior dissemination of the data and narrative interpretations of the data. Ethical approval was not required as a Public Use File from the German Socio-economic Panel (GSOEP) was used.
Conflict of interests
The authors declare that they have no conflict of interest.
Additional information
Publisher’s note
Springer Nature remains neutral with regard to jurisdictional claims in published maps and institutional affiliations.
Rights and permissions
Open Access This article is licensed under a Creative Commons Attribution 4.0 International License, which permits use, sharing, adaptation, distribution and reproduction in any medium or format, as long as you give appropriate credit to the original author(s) and the source, provide a link to the Creative Commons licence, and indicate if changes were made. The images or other third party material in this article are included in the article's Creative Commons licence, unless indicated otherwise in a credit line to the material. If material is not included in the article's Creative Commons licence and your intended use is not permitted by statutory regulation or exceeds the permitted use, you will need to obtain permission directly from the copyright holder. To view a copy of this licence, visit http://creativecommons.org/licenses/by/4.0/.
About this article

Cite this article
Kasinger, C., Braunheim, L., Beutel, M. et al. Closing the “happiness gap” by closing the wealth gap: the role of wealth on life satisfaction between east and west-Germans. J Public Health (Berl.) 31, 1433–1442 (2023). https://doi.org/10.1007/s10389-022-01716-0
Received:
Accepted:
Published:
Issue Date:
DOI: https://doi.org/10.1007/s10389-022-01716-0