
Abstract
Chinese outward foreign direct investment (OFDI) in developed economies has increased substantially in recent years, driven by policy liberalization and structural adjustments in China’s economy. Efforts to accurately describe the dimensions of this increase are complicated by problems with official statistics and the complexity of deal structures. This article introduces the major problems of capturing data on global cross-border investment flows and elaborates on the particular difficulties of measuring Chinese outward FDI. It identifies alternative datasets that can help to better capture the scope and patterns of the Chinese overseas investment and uses one of them to describe the growth of Chinese investment in the EU and the US since 2000, highlighting similarities and differences in investment patterns in the world’s two biggest economies.


Notes
The FDI figures in this paragraph refer to balance of payments data collected by the People’s Bank of China, which were corrected in 2010 to account for reinvested earnings from existing FDI assets.
For a thorough treatment of China’s present structural adjustment needs, see Lardy (2012).
Calculated assuming baseline growth rate of 5 % per year, 4 % inflation 2011–2015, and 3 % inflation 2016–2020.
Ratios are based on FDI data from UNCTAD.
See the IMF’s Balance of Payments and International Investment Position Manual; the IMF definitions also are used by other international organizations such as the OECD and UNCTAD.
The new category of derivatives was introduced in the sixth edition of the IMF’s balance of payments and international investment position manual, released in 2009.
Detailed information on the nature of direct investment and its measurement can be found in the OECD’s “Benchmark Definition of Foreign Direct Investment” (OECD 2008a).
For more detailed information, see Rosen and Hanemann (2011) and IMF (2004).
For detailed information on BPM5, see IMF (1993). IMF General Data Dissemination System (GDDS) on China is available at http://dsbb.imf.org/pages/gdds/ComprehensiveFwReport.aspx?ctycode=CHN&catcode=BPS00
The 2012 China Outward Foreign Direct Investment Statistical Bulletin was released in September 2013. An official summary is available at http://www.mofcom.gov.cn/article/ae/ai/201309/20130900292811.shtml
The 2012 China Outward Foreign Direct Investment Statistical Procedure is available at http://www.mofcom.gov.cn/article/b/bf/201212/20121208507450.shtml
BEA ultimate beneficiary ownership FDI statistics put the accumulated stock of Chinese FDI in the US at USD 9.5 billion at the end of 2011, less than 0.4 % of total US FDI intake. According to official Eurostat statistics, by 2010, China had invested USD 8.9 billion in OFDI stock in Europe—under 0.1 % of the EU’s total, and under 0.3 % of the total from outside Europe.
BEA’s definition of ultimate beneficiary owner available at http://www.bea.gov/international/di1fdibal.htm; http://www.bea.gov/faq/index.cfm?faq_id=1008
Fig. 3 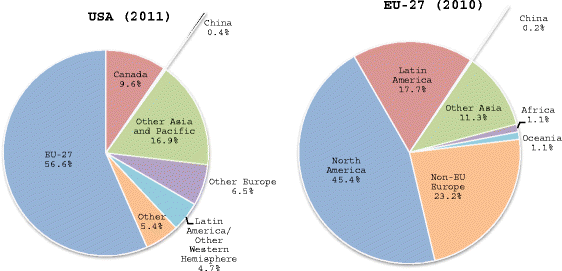
China’s role as direct investor in the European Union* and the US. Percent share of total inward FDI stock, latest available year. Percent share of total inward FDI stock, latest available year, sources: Bureau of Economic Analysis; Eurostat. *EU-27 FDI stocks exclude intra-EU FDI
Heritage Foundation China Investment Tracker, available at: http://www.heritage.org/research/projects/china-global-investment-tracker-interactive-map
Rhodium Group China Investment Monitor, available at: http://rhg.com/interactive/china-investment-monitor
Antwerp Management School Euro-China Investment Report, available at:
TAC ChinaObs fdiMonitor, available at: http://www.chinaobs.eu/
For example KPMG or Ernst&Young.
For a detailed analysis of Chinese investment activities during the first half of 2012, see Hanemann (2012).
See for example Godement and Parello-Plesner (2011), Time, “Will Asia “buy up” America?” August 30, 2011, available at: http://business.time.com/2011/08/30/will-asia-buy-up-america/.
Source: US Treasury International Capital System, available at: http://www.treasury.gov/resource-center/data-chart-center/tic/Pages/index.aspx
Some of the largest oil and gas plays since 2010 include CNOOC’s acquisition of stakes in Chesapeake Energy projects in 2010 and 2011 worth USD 1.7 billion and Sinopec’s acquisition of a stake in a Devon Energy project in early 2012 valued at USD 2.5 billion.
The biggest transactions were the USD 3.3 billion purchase of a stake in GDF Suez’s overseas gas exploration and production division by China Investment Corporation in late 2011, the USD 877 million takeover of Emerald Energy by Sinochem Resources in 2009, the USD 406 million acquisition of Caledon Resources by Guangdong Rising in 2011, and the USD 256 million investment by China Railway Materials in African Minerals in 2010.
According to the Chinese version of the Ministry of Commerce’s 2009 report on Outward Foreign Direct Investment, state-owned enterprises accounted for around 70 % of total Chinese OFDI stock in 2009. The authors’ interviews with economists and researchers at the China’s State-Owned Assets Supervision and Administration Commission suggest that the share of state-owned enterprises in total OFDI stock could be higher.
This refers to CIC’s 2010 USD 1.58 billion investment of Virginia’s AES Corporation. Details of the deal can be found at: http://investor.aes.com/phoenix.zhtml?c=76149&p=irol-newsArticle&ID=1402516.

References
Beugelsdijk S, Hennart JF, Slangen A, Smeets R (2010) Why and how FDI stocks are a biased measure of MNE affiliate activity. J Int Bus Stud 41:1444–1459
Borrmann C (2003) Methodological problems of fdi statistics in accession countries and EU countries. Hamburg Institute of International Economics, 2003
Hanemann T (2012) Chinese FDI in the United States: Q3 2012 Update. Rhodium Group. http://rhgroup.net/notes/chinese-fdi-in-the-united-states-q3 -2012-update. Accessed July 25, 2012
He JW, and Kujis L (2007) Rebalancing China’s economy—modeling a policy package. World Bank, China Research Paper no. 7, available at: http://www.worldbank.org.cn/english/content/working_paper7.pdf
He D, Cheung L, Zhang WL, and Wu T (2012) How would capital account liberalisation affect China’s capital flows and the Renminbi real exchange rates? Hong Kong Institute for Monetary Research. http://www.hkimr.org/uploads/publication/17/ub_full_0_2_316_wp-no-09_2012-final-.pdf. Accessed 20 April 2013
International Monetary Fund (1993) Balance of payments manual. IMF. http://www.imf.org/external/pubs/ft/bopman/bopman.pdf. Accessed 27 July 2013
Lardy NR (2012) Sustaining China’s Economic growth after the global financial crisis. Peterson Institute
Naughton B (1995) Growing out of the plan: Chinese economic reform, 1978–1993. Cambridge University Press, New York
Organisation for economic cooperation and development (1996) benchmark definition of foreign direct investment. OECD. http://www.oecd.org/daf/inv/investment-policy/2090148.pdf. Accessed 28 July 2013
Rosen DH (1999) Behind the open door: Foreign enterprises in the Chinese Marketplace. http://www.amazon.com/Behind-Open-Door-Enterprises-Marketplace/dp/0881322636. Accessed 25 Mar 2014
Rosen DH, and Hanemann T (2011) An American open door? Maximizing the benefits of Chinese foreign direct investment. Center on US-China Relations, Asia Society. http://asiasociety.org/files/pdf/AnAmericanOpenDoor_FINAL.pdf. Accessed 28 July 2013
Rosen DH, and Hanemann T (2012). China invests in Europe: patterns, impacts and policy implications. China International Capital Corporation, Brunswick Group. Rhodium Group. http://rhg.com/wp-content/uploads/2012/06/RHG_ChinaInvestsInEurope_June2012_ExecutiveSummary.pdf. Accessed 5 August 2013
Schüler-Zhou Y, Schüller M (2009) The internationalization of Chinese companies: What do official statistics tell us about Chinese outward foreign direct investment? Chin Manag Stud 3(1):25–42
Stephan M, Pfaffmann E (2001) Detecting the Pitfalls of data on foreign direct investment: scope and limits of FDI data. Manag Int Rev 41(2):189–218
United Nations Conference on Trade and Development (2005a) report of the expert meeting on capacity building in the area of FDI: data compilation and policy formulation in developing countries. UNCTAD. http://unctad.org/en/Docs/c2em18d3_en.pdf. Accessed 28 July 2013
United Nations Conference on Trade and Development (2005b) Expert meeting on capacity building in the area of FDI: data compilation and policy formulation in developing countries—introduction to major FDI issues. UNCTAD. http://unctad.org/sections/wcmu/docs/C2em18p23_en.pdf. Accessed 28 July 2013
Author information
Authors and Affiliations
Corresponding author
Rights and permissions
About this article
Cite this article
Hanemann, T. Chinese direct investment in the EU and the US: a comparative view. Asia Eur J 12, 127–142 (2014). https://doi.org/10.1007/s10308-014-0379-5
Published:
Issue Date:
DOI: https://doi.org/10.1007/s10308-014-0379-5