
Abstract
The weak form of the efficient market hypothesis is identified with the conditions established by different types of random walks (1–3) on the returns associated with the prices of a financial asset. The methods traditionally applied for testing weak efficiency in a financial market as stated by the random walk model test only some necessary, but not sufficient, condition of this model. Thus, a procedure is proposed to detect if a return series associated with a given price index follows a random walk and, if so, what type it is. The procedure combines methods that test only a necessary, but not sufficient, condition for the fulfilment of the random walk hypothesis and methods that directly test a particular type of random walk. The proposed procedure is evaluated by means of a Monte Carlo experiment, and the results show that this procedure performs better (more powerful) against linear correlation-only alternatives when starting from the Ljung–Box test. On the other hand, against the random walk type 3 alternative, the procedure is more powerful when it is initiated from the BDS test.
1 Introduction
The hypothesis of financial market efficiency is an analytical approach aimed at explaining movements in prices of financial assets over time and is based on the insight that prices for such assets are determined by the rational behaviour of agents interacting in the market. This hypothesis states that stock prices reflect all the information available for the agents when they are determined. Therefore, if the hypothesis is fulfilled, it would not be possible to anticipate price changes and formulate investment strategies to obtain substantial returns, i.e., predictions about future market behaviour could not be performed.
The validation of the hypothesis of efficiency in a given financial market is important for both investors and trade regulatory institutions. It provides criteria to assess whether the environment favours the state that all agents playing in the market are subject to equal footings in a “fair game”, where expectations of success and failure are equivalent.
Although the theoretical origin of the efficiency hypothesis arises from the work of Bachelier in 1900, Samuelson reported the theoretical foundations for this hypothesis in 1965. On the other hand, Fama established, for the first time, the concept of an efficient market. A short time later, the concept of the hypothesis of financial market efficiency emerged from the work of Roberts (1967), which also analysed efficiency with an informational outlook, leading to a rating for efficiency on three levels according to the rising availability of information for agents: weak, semi-strong and strong. Thus, weak efficiency means that information available to the agents is restricted to the historical price series; semi-strong efficiency means that all public information is available for all agents; and strong efficiency means that the set of available information includes the previously described information and other private data, known as insider trading.
The weak form of the efficiency hypothesis has been the benchmark of the theoretical and empirical approaches throughout history. In relation to the theoretical contributions, most link the weak efficiency hypothesis to the fact that financial asset prices follow a random walk (in form 1, 2 or 3) or a martingale. However, since it is necessary to impose additional restrictions on the underlying probability distributions that lead to one of the forms of random walk to obtain testable hypotheses derived from the martingale model, it seems logical to assume any of these forms as a pricing model.
Specifically, the types of random walks with which the weak efficiency hypothesis is identified are conditions that are established on the returns of a financial asset, which are relaxed from random walk 1 (which is the most restrictive) to random walk 3 (which corresponds to the most plausible in economic terms since it is not as restrictive). This makes it possible to evaluate the degree of weak efficiency.
Although numerous procedures have traditionally been used to test the weak efficiency of a financial market according to the random walk model, many test only some necessary, but not sufficient, condition of the aforementioned model in any of its forms (this is the case, for example, of the so-called linear methods that test only the necessary uncorrelation for the three types of random walk). In any case, applying one of these tests can lead to an incorrect conclusion. On the other hand, there are methods that directly test a specific type of random walk.
Through the strategic combination of both types of methods, a procedure that allows us to detect if a time series of financial returns follows a random walk and, if so, its corresponding type, is proposed. The objective is to reduce the effect of the above-mentioned limitation of some traditional methods when studying the weak efficiency hypothesis.
Consequently, the work begins (Sect. 2) by describing how the hypothesis of efficiency in a financial market is evaluated based on the so-called joint-hypothesis problem (Fama 1991). The different methods traditionally applied to test the weak efficiency in the forms that establish the random walk types are detailed in Sect. 3. Next, a procedure is proposed to detect if a return series associated with a given price index follows a random walk and, if so, what type it is. This procedure combines methods that test only a necessary, but not sufficient, condition for the fulfilment of the random walk hypothesis and methods that directly test for a particular type of random walk. The proposed procedure is evaluated by means of a Monte Carlo experiment, and the results are presented in Sect. 4. Finally, Sect. 5 contains the main conclusions of the study.
2 Evaluation of the efficiency hypothesis
To evaluate the efficiency of a financial market, Bailey (2005) proposes a procedure on the basis of the joint-hypothesis problem of Fama (1991), that is, considering, in addition to the available information, the existence of an underlying model to fix the prices of financial assets. Specifically, based on the aforementioned model and the cited set of information, the criterion that determines the efficiency of the market is established to create a testable hypothesis. Thus, by means of some method designed to test the hypothesis of efficiency, whether the collected data (observed prices) evince this hypothesis is tested, which would imply the efficiency or inefficiency of the market. Figure 1 shows this whole process schematically.

Source: Bailey (2005)
Scheme of the procedure to evaluate the efficiency of a market.
Clearly, in this procedure, the efficiency of a market depends on the pricing model and the information set assumed. Thus, if the conclusion for a market is efficiency (inefficiency) given a pricing model and a specific information set, it is possible that inefficiency (efficiency) would be concluded if another model and/or different set are assumed.
Traditionally, the martingale and the random walk are assumed to be models to fix the price Pt of a financial asset whose continuously compounded return or log return is given by the expression
2.1 Martingale
Samuelson (1965) and Fama (1970), understanding the market as a fair game, raised the idea of efficiency from an informational outlook, with the less restrictive model, the martingale model. In this case, if \(\Omega_{t}\) is the available information set at time t,
That is, in an efficient market, it is not possible to forecast the future using the available information, so the best forecast for the price of an asset at time \(t + 1\) is today's price. The second condition of expression (1) implies
which reflects the idea of a fair game and allows us to affirm that the return \(r_{t}\) constitutes a martingale difference sequence, i.e., it satisfies the conditions
2.2 Random walk
The random walk was initially formulated as
where \(r_{t}\) is considered an independent and identically distributed process with mean 0 and constant variance, which assumes that changes in prices are unpredictable and random, a fact that is inherent to the first versions of the efficient market hypothesis. Nevertheless, several studies have shown that financial data are inconsistent with these conditions.
Campbell et al. (1997) adjusted the idea of random walks based on the formulation
where μ is a constant term. By establishing conditions on the dependency structure of the process \(\{ \varepsilon_{t} \}\) (which the authors call increments), they distinguish three types of random walks: 1, 2 and 3. In this case, the change in the price or return is
So the conditions fixed on the increments \(\{ \varepsilon_{t} \}\) can be extrapolated integrally to the returns {\(r_{t}\)}.
-
a.
Random walk 1 (RW1): IID increments/returns
In this first type, \(\varepsilon_{t}\) is an independent and identically distributed process with mean 0 and variance \(\sigma^{{2}}\), or \(\varepsilon_{t} \sim {\text{IID(0,}}\sigma^{{2}} {)}\) in abbreviated form, which implies \(r_{t} \sim {\text{IID(}}\mu {,}\sigma^{{2}} {)}\). Thus, formulation (2) is a particular case of this type of random walk for \(\mu = 0\). Under these conditions, the constant term μ is the expected price change or drift. If, in addition, normality of \(\varepsilon_{t}\) is assumed, then (3) is equivalent to arithmetic Brownian motion.
In this case, the independence of \(\varepsilon_{t}\) implies that random walk 1 is also a fair game but in a much stronger sense than martingale, since the mentioned independence implies not only that increments/returns are uncorrelated but also that any nonlinear functions of them are uncorrelated.
-
b.
Random walk 2 (RW2): independent increments/returns
For this type of random walk, \(\varepsilon_{t}\) (and by extension \(r_{t}\)) is an independent but not identically distributed process (INID). RW2 contains RW1 as a particular case.
This version of the random walk accommodates more general price generation processes and, at the same time, is more in line with the reality of the market since, for example, it allows for unconditional heteroskedasticity in \(r_{t}\), thus taking into account the temporal dependence of volatility that is characteristic of financial series.
-
c.
Random walk 3 (RW3): uncorrelated increments/returns
Under this denomination, \(\varepsilon_{t}\) (and therefore \(r_{t}\)) is a process that is not independent or identically distributed but is uncorrelated; that is, cases are considered
$$Cov\left( {\varepsilon_{t} ,\varepsilon_{t - k} } \right) = 0\quad \forall k \ne 0{\text{ but }}Cov\left( {\varepsilon_{t}^{2} ,\varepsilon_{t - k}^{2} } \right) \ne 0{\text{ for some }}k \ne 0$$which means there may be dependence but no correlation.
This is the weakest form of the random walk hypothesis and contains RW1 and RW2 as special cases.
As previously mentioned, financial data tend to reject random walk 1, mainly due to non-compliance with the constancy assumption of the variance of \(r_{t}\). In contrast, random walks 2 and 3 are more consistent with financial reality since they allow for heteroskedasticity (conditional or unconditional) in \(r_{t}\). Consequently, we could say that RW2 is the type of random walk closest to the martingale [actually, RW1 and RW2 satisfy the conditions of the martingale, but in a stronger sense (Bailey 2005)].
2.3 Martingale vs. random walk
The random walk hypothesis, in its three versions, and that of the martingale are captured in an expression that considers the kind of dependence that can exist between the returns r of a given asset at two times, t y \( t{ + }k\),
where, in principle, \(f( \cdot )\) and \(g( \cdot )\) are two arbitrary functions and may be interpreted as an orthogonality condition. For appropriately chosen \(f( \cdot )\) and \(g( \cdot )\), all versions of the random walk hypothesis and martingale hypothesis are captured by (4). Specifically,
-
If condition (4) is satisfied only in the case that \(f( \cdot )\) and \(g( \cdot )\) are linear functions, then the returns are serially uncorrelated but not independent, which is identified with RW3. In this context, the linear projection of \(r_{t + k}\) onto the set of its past values \(\Omega_{t}\) satisfies
$$Proj\left( {\left. {r_{t + k} } \right|\Omega_{t} } \right) = constant,\quad \forall t,\forall k \ge 1$$ -
If condition (4) is satisfied only when \(g( \cdot )\) is a linear function but \(f( \cdot )\) is unrestricted, then the returns are uncorrelated with any function of their past values, which is equivalent to the martingale hypothesis. In this case,
$$E\left[ {\left. {r_{t + k} } \right|\Omega_{t} } \right] = 0,\quad \forall t,\forall k \ge 1$$ -
If condition (4) holds for any \(f( \cdot )\) and \(g( \cdot )\), then returns are independent, which corresponds to RW1 and RW2. In this case,
$$d.f.\left( {\left. {r_{t + k} } \right|\Omega_{t} } \right) = d.f.\left( {r_{t + k} } \right),\quad \forall t,\forall k \ge 1$$
where d.f. denotes the probability density function.
Table 1 summarizes the hypotheses derived from expression (4).
Since, in practice, additional restrictions are usually imposed on the underlying probability distributions to obtain testable hypotheses derived from the martingale model, which results in the conditions of some of the random walk versionsFootnote 1 (Bailey 2005, pp. 59–60), it is normal to assume the random walk as a pricing model.
Therefore, if the available information set is the historical price series and the pricing model assumed is the random walk, weak efficiency is identified with some types of random walks.
3 Evaluation of the weak efficiency
3.1 Traditional methods
The methods traditionally used to test the weak form of efficiency, as established by some of the random walk types, are classified into two groups depending on whether they make use of formal statistical inference.
RW2 is analysed with methods that do not use formal inference techniques (filter rules and technical analysisFootnote 2) because this type of random walk requires that the return series is INID. In this case, it would be very complicated to test for independence without assuming identical distributions (particularly in the context of time series) since the sampling distributions of the statistics that would be constructed to carry out the corresponding test could not be obtained (Campbell et al. 1997, p. 41).
On the other hand, the methods that apply formal inference techniques for the analysis can be classified into two groups according to whether they allow direct testing of a type of random walk or only some necessary, but not sufficient, condition for its fulfilment.
The methods of the second group include the Bartlett test, tests based on the Box–Jenkins methodology, the Box–Pierce test, the Ljung–Box test and the variance ratio test. These methods test only the uncorrelation condition on the return series (they are also called linear methodsFootnote 3) necessary for any type of random walk. Since these tests do not detect non-linear relationshipsFootnote 4 that, if they exist, would entail the dependence of the series, rejection of the null hypothesis would imply no uncorrelation of the series and, consequently, the non-existence of any type of random walk.
On the other hand, for tests that try to detect ARCH effects, rejection of the null hypothesis involves only the acceptance of non-linear relationships, which does not necessarily imply that the series is uncorrelated.
Other methods allow direct determination of whether the return series follows a specific type of random walk. This means that these procedures also take into account the possibility of non-linear relationships in the series, either because they are considered by the null hypothesis itself or because the cited methods have power against alternatives that capture these relationships (they would be, therefore, non-linear methods). These methods include those that allow testing of the random walk type 1 (BDS test, runs test and sequences and reversals test) and one that tests for a type 3 random walk (variance ratio test, which considers the heteroskedasticity of the series).
Figure 2 shows the classification established in this section for the different methods that are traditionally used to test the hypothesis of weak efficiency.

Source: own elaboration
Methods traditionally used to test the random walk hypothesis (weak efficiency).
The financial literature shows that the methods described above have traditionally been applied to test the weak efficiency hypothesis in financial markets.
Correlation tests to determine the efficiency of a market were first used when Fama (1965) and Samuelson (1965) laid the foundations of efficient market theory. From these beginnings, the works developed by Moore (1964), Theil and Leenders (1965), Fama (1965) and Fisher (1966), among others, stand out.
These tests were used as almost the only tool to analyse the efficiency of a market until, in the 1970s, seasonal effects and calendar anomalies became relevant for the analysis. Then, new methodologies incorporating these effects emerged, such as the seasonality tests applied by Roseff and Kinney (1976), French (1980) and Gultekin and Gultekin (1983).
In the 1990s, studies that analysed the efficiency hypothesis in financial markets using so-called traditional methods began to appear. This practice has continued to the present day, as evidenced by the most prominent empirical works on financial efficiency in recent years.
Articles using technical analysis to test for the efficiency of a financial market include Potvin et al. (2004), Marshall et al. (2006), Chen et al. (2009), Alexeev and Tapon (2011), Shynkevich (2012), Ho et al. (2012), Leković (2018), Picasso et al. (2019) and Nti et al. (2020).
On the other hand, among the studies that apply methods that test only a necessary, but not sufficient, condition of the random walk hypothesis, the most numerous are those that use correlation tests. In this sense, we can cite the studies developed by Buguk and Brorsen (2003), DePenya and Gil-Alana (2007), Lim et al. (2008b), Álvarez-Ramírez and Escarela-Pérez (2010), Khan and Vieito (2012), Ryaly et al. (2014), Juana (2017), Rossi and Gunardi (2018) and Stoian and Iorgulescu (2020). Research applying the variance ratio test (also very numerous) includes Hasan et al. (2003), Hoque et al. (2007), Righi and Ceretta (2013), Kumar (2018), Omane-Adjepong et al. (2019) and Sánchez-Granero et al. (2020). Finally, ARCH effect tests have been used in several papers, such as Appiah-Kusi and Menyah (2003), Cheong et al. (2007), Jayasinghe and Tsui (2008), Lim et al. (2008a), Chuang et al. (2012), Rossi and Gunardi (2018) and Khanh and Dat (2020).
Regarding methods that directly test a type of random walk, the runs test has been used in works such as Dicle et al. (2010), Jamaani and Roca (2015), Leković (2018), Chu et al. (2019) and Tiwari et al. (2019). Meanwhile, the application of the BDS test can be found in studies such as Yao and Rahaman (2018), Abdullah et al. (2020), Kołatka (2020) and Adaramola and Obisesan (2021).
Therefore, the proposal of a procedure (Sect. 3.2) that reduces the limitations of traditional methods would be a novel contribution to the financial field as far as the analysis of the weak efficiency hypothesis is concerned. Moreover, it would be more accurate than the traditional methods in determining whether a return series follows a random walk.
3.2 Proposed procedure
By strategically combining the methods analysed in the previous section, we propose a procedure to test the random walk hypothesis that can be started either from a method that tests only a necessary, but not sufficient, condition or from one that directly tests a specific type of random walk (1, 2 or 3).
On the one hand, if the procedure is started with a method from the first group and shows correlation of the return series, it would not follow any type of random walk. In the opposite case (uncorrelation), an ARCH effect test is recommended to determine the type of random walk. Thus, if ARCH effects are detected, which implies the existence of non-linear relationships, it should be concluded that the series is RW3. Otherwise, the series will be RW1 or RW2, and a non-formal statistical inference technique can be applied to test for type 2. Finally, if the RW2 hypothesis is rejected, then the series is necessarily RW1.
On the other hand, regarding the methods that directly test a type of random walk, it is proposed to start the procedure with one that tests RW1. Thus, if the null hypothesis is rejected with this method, it cannot be ruled out that the series is RW2, RW3 or not a random walk at all. Before affirming that we are not facing any type of random walk, first it is suggested to check for type 2 by applying a non-formal statistical inference technique. If the RW2 hypothesis cannot be accepted, then RW3 is tested. In this case, rejection of the RW3 hypothesis implies that the series is not a random walk.
Figure 3 schematically shows the described procedure.

Source: Own elaboration
Procedure for testing the random walk hypothesis.
The acceptance of market inefficiency (i.e., that the return series is not RW) occurs when the price series analysed shows non-randomness, a structure that can be identified, long systematic deviations from its intrinsic value, etc. (even the RW3 hypothesis implies dependence but no correlation). This indicates a certain degree of predictability, at least in the short run, i.e., it is possible to forecast both the asset returns and the volatility of the market using past price changes. These forecasts are constructed on the basis of models reflecting the behaviour of financial asset prices.
Among the models that allow linear structures to be captured, the ARIMA and ARIMAX models stand out. Moreover, ARCH family models are used for modelling and forecasting the conditional volatility of asset returns. On the other hand, when the return series presents non-linear relationships, it is common to use non-parametric and non-linear models, including those based on neural networks and machine learning techniques. Finally, hybrid models (a combination of two or more of the procedures described above) consider all the typical characteristics of financial series.
4 Monte Carlo experiment
The procedure introduced in the previous section is evaluated by means of a Monte Carlo experiment,Footnote 5 considering the variance ratio test proposed by Lo and MacKinlay (1988)Footnote 6 and the Ljung–Box test (1978), when started from methods that test only some necessary, but not sufficient, condition of the random walk hypothesis; and the BDS testFootnote 7 and the runs test when starting from methods that directly test the mentioned hypothesis. If the procedure requires the application of an ARCH effect test to decide between random walks 1 and 3, ARCH models up to order 4 are used.
To conduct this analysis, return series are generated from two different models because the objective is twofold: to evaluate the performance of the procedure in the analysis of the random walk 1 hypothesis against the linear correlation alternative, on the one hand, and against that of the random walk 3, on the other.Footnote 8
Thus, the BDS, runs, variance ratio and Ljung–Box tests are applied to each generated return series. Then, if the RW1 hypothesis is rejected by the first two tests, the variance-ratio test is applied to determine whether the series is at least RW3. On the other hand, if the random walk hypothesis is not rejected with the first two tests, an ARCH effect test is applied to discern between RW1 and RW3. The process is replicated 10,000 times for each sample size T and each value of the parameter involved in the generation of the series (see the whole process in Fig. 4).

Source: Own elaboration
Iteration of the simulation process.
-
a.
Nominal size
Before analysing the Monte Carlo powers of the procedure initiated from the different indicated tests, the corresponding nominal size is estimated; that is, the maximum probability of falsely rejecting the null hypothesis of random walk 1 is calculated in each case. Since the different ways of executing the proposed procedure contemplate the possibility of applying tests sequentially to make a decision, we must not expect, in general, the nominal size of each case to coincide with the significance level α which is fixed in each of the individual tests.
To estimate the mentioned nominal size, return series that follow a random walk 1 are generated
where \(\varepsilon_{t} \sim iid(0,1)\). Specifically, 10,000 series of size T are generated, and the tests required by the specific way in which the procedure is being applied are performed on each data series independently, not sequentially, with significance level α. The reiteration of this process allows us to determine, for each T, the number of acceptances and rejections of the null hypothesis (random walk 1) that occur with the independent application of each test. This makes possible the estimation of the nominal size of the procedure in each case as the quotient of the total rejections of the null hypothesis divided by the total number of replications (10,000 in this case).
The process described in the previous paragraph was performed for the sample sizes T = 25, 50, 100, 250, 500 and 1000 and significance levels α = 0.02, 0.05 and 0.1 [application of the process in Fig. 4 for expression (5)]. The results (Table 2) indicate, for a given value T, the (estimated) theoretical size of the procedure when a significance level α is set in the individual tests required by the cited procedure initiated from a specific method. For example, if for \(T = 100\) the researcher sets a value of \(\alpha = 0.05\) in the individual tests and wishes to apply the procedure initiated from the variance ratio test, he will be working with a (estimated) theoretical size of 0.0975.
The estimated nominal size of the procedure when starting from methods that directly test the hypothesis of random walk 1 is much better in the case of the runs test since it practically coincides with the significance level α fixed (in the individual tests) for any sample size T. However, size distortions (estimated values far from the level α) are evident when the procedure is initiated from the BDS test, and the results are clearly affected by T. In effect, the greatest distortions occur for small sample sizes and decrease as T increases (at \(T = 1000\), the estimated nominal size for each α is 0.0566, 0.133244 and 0.2214, respectively, i.e., approximately \(2\alpha\)).
Since the variance ratio test and the Ljung–Box test do not directly test the random walk 1 hypothesis—to estimate the nominal size of the procedure initiated from any of them, it is necessary to apply tests sequentially—the results that appear in Table 2 for these two cases are expected in the sense that the estimates of the respective nominal sizes for each T are greater than the significance level α. In this context of size distortion, the best results correspond to the case of the variance ratio test, with estimated values very close to the significance level α for small sample sizes (\(T = 25\) and 50) but that increase as T increases (note that at \(T = 1000\), for each value of α, the nominal size is approximately double that at \(T = 25\), i.e., approximately \(2\alpha\)). In the case of the Ljung–Box test, where the distortion is greater, the sample size T hardly influences the estimated values of the nominal size since, irrespective of the value of T, they remain approximately 10%, 21% and 37% for levels 0.02, 0.05 and 0.1, respectively.
-
b.
Empirical size and Monte Carlo power
(b1) The performance of the procedure for testing the random walk 1 hypothesis against the only linear correlation alternative (among the variables of the return series generating process) is analysed using the model
with \(r_{0} = 0\) and \(\varepsilon_{t} \sim iid(0,1)\). By means of (6), ten thousand samples of sizes T = 25, 50, 100, 250, 500 and 1000 of the series \(r_{t}\) are generated for each value of parameter \(\phi_{1}\) considered: − 0.9, − 0.75, − 0.5, − 0.25, − 0.1, 0, 0.1 0.25, 0.5. 0.75 and 0.9. In this way, the model yields return series that follow a random walk 1 (particular case in which \(\phi_{1} = 0\)) and, as an alternative, series with a first-order autoregressive structure (cases in which \(\phi_{1} \ne 0\)), i.e., they would be generated by a process whose variables are correlated. Therefore, when the null hypothesis is rejected, some degree of predictability is admitted since by modelling the above autoregressive structure with an ARMA model, it is possible to predict price changes on the basis of historical price changes.
The procedure, starting from each of the considered tests (BDS, runs, Ljung–Box and variance ratio), was applied to the different series generated by the combinations of values of T and \(\phi_{1}\) with a significance level of 5% [application of the process in Fig. 4 for expression (6)]. Then, we calculated the number of times that the different decisions contemplated by the two ways of applying the procedure are made (according to whether we start from a method that does or does not directly test the random walk hypothesis).
From the previous results, we calculate, for each sample size T, the percentage of rejection of the null hypothesis (random walk 1) when starting from each of the four tests considered, depending on the value of parameter \(\phi_{1}\). Since \(\phi_{1} = 0\) implies that the null hypothesis is true, in this particular case, the calculations represent the empirical probability of committing a type I error for the procedure in the four applications, i.e., the empirical size. However, when \(\phi_{1} \ne 0\), the cited calculations represent the Monte Carlo power of each version of the procedure since for these values of \(\phi_{1}\), the null hypothesis is false.
-
b1.1
Empirical size
The empirical sizes (Table 3) that resulted from the different cases analysed nearly coincide with the corresponding theoretical probabilities calculated for \(\alpha = 0.05\) (see Table 2). Therefore, there is empirical confirmation of the size distortions that appear in the procedure according to the test from which it is started. In effect,
-
When the procedure is initiated from methods that directly test the random walk 1 hypothesis, the results confirm that for the runs test, the size of the procedure remains approximately 5% (the significance level) for all T. Nevertheless, when initiating from the BDS test, a very high size distortion is produced for small sample sizes (0.6806 and 0.5425 at \(T = 25\) and 50, respectively), but the distortion decreases as T increases (it reaches a value of 0.1334 at \(T = 1000\)).
-
The size distortions exhibited by the procedure when starting with methods that test only a necessary, but not sufficient, condition of the random walk hypothesis, are less pronounced when the procedure is applied starting from the variance ratio test than when starting from the Ljung–Box test. Likewise, in the former case, the empirical size increases with the sample size T from values close to the significance level (0.05) to more than double the significance level (from 0.0603 at \(T = 25\) to 0.1287 at \(T = 1000\)). In the latter case (Ljung–Box), the values between which the empirical size oscillates (18% and 22%) do not allow us to affirm that there exists an influence of T.
-
b1.2
Monte Carlo power
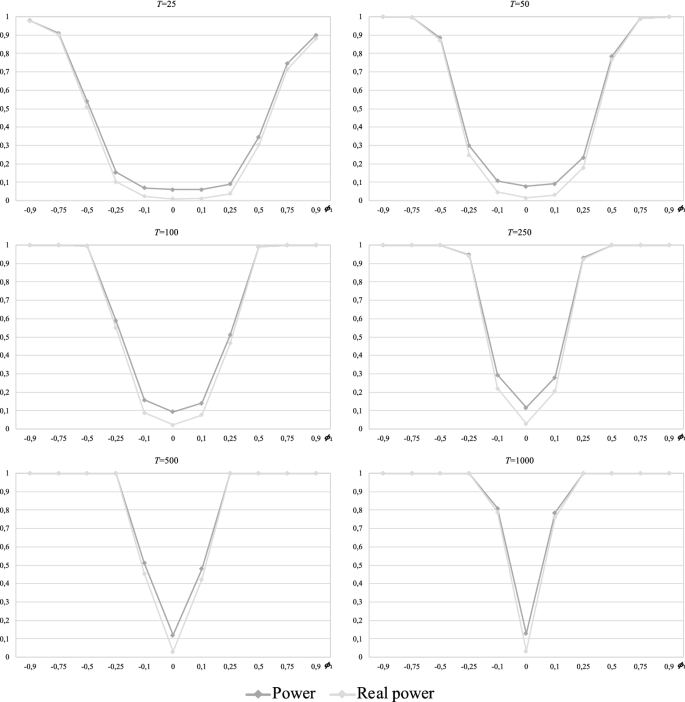
Table 4 reports, for each sample size T, the power calculations of the procedure started from each of the four tests considered in this study, i.e., the probability of rejecting the null hypothesis (random walk 1) with each version of the procedure on the assumption that the hypothesis is false. Likewise, since several alternatives to the null hypothesis (values that satisfy \(\phi_{1} \ne 0\)) are considered, the corresponding power functions of the cited versions of the procedure are obtained and plotted in a comparative way for each T (Fig. 5).

Source: Own elaboration
Monte Carlo power of the procedure when starting from each test against linear correlation-only alternatives.
For each sample size T and regardless of the test from which the procedure is started, the corresponding probabilities of rejection of the random walk 1 hypothesis are distributed symmetrically around the value \(\phi_{1} = 0\) (random walk 1 hypothesis). Additionally, these probabilities tend to unity as \(\left| {\phi_{1} } \right|\) increases, reaching 1 for values of \(\left| {\phi_{1} } \right|\) increasingly closer to 0 as the sample size T increases. The velocity of the described behaviour depends on the test from which the procedure is started:
-
For the two smallest sample sizes (\(T = 25\) and 50), a power of 1 is hardly achieved for any of the alternatives. Only at \(T = 50\) is the power approximately 100 percent, with the procedure initiated from any of the four tests, for \(\left| {\phi_{1} } \right| \ge 0.75\). On the other hand, at \(T = 25\), the estimated powers of the procedure initiated from the BDS test for \(\left| {\phi_{1} } \right| \le 0.5\) are much higher than those presented by the other cases. A similar situation occurs at \(T = 50\), but with less pronounced differences between what the procedure with the BDS test and the other cases yield and restricted to the alternatives with \(\left| {\phi_{1} } \right| \le 0.25\).
-
From sample size 100, we observe differences in the convergence to unity of the estimated powers according to the test from which the procedure is initiated. Thus, when starting from the Ljung–Box test and the variance ratio test, a power of approximately 1 is achieved for \(\left| {\phi_{1} } \right| \ge 0.5\) at \(T = 100\), whereas for larger sample sizes, convergence to 1 is nearly reached for \(\left| {\phi_{1} } \right| \ge 0.25\). On the other hand, when the procedure is started from the BDS test, a power of 1 is reached for \(\left| {\phi_{1} } \right| \ge 0.75\) at \(T = 100\) and for \(\left| {\phi_{1} } \right| \ge 0.5\) at \(T \ge 250\) (note that at \(T = 1000\), the estimated power does not exceed 0.89 for \(\left| {\phi_{1} } \right| = 0.25)\). Finally, when the procedure is initiated from the runs test, the value of \(\left| {\phi_{1} } \right|\) for which the powers achieve unity decreases as the sample size T increases beyond 100. Specifically, at \(T = 100\), unity is reached for \(\left| {\phi_{1} } \right| \ge 0.75\); at \(T = 250\), for \(\left| {\phi_{1} } \right| \ge 0.5\); and at \(T = 1000\), for \(\left| {\phi_{1} } \right| \ge 0.25\) (at \(T = 500\), the power is approximately 0.95 for \(\left| {\phi_{1} } \right| = 0.25\)). The plots in Fig. 5 show that the power function of the procedure initiated from the Ljung–Box test is always above the other power functions, i.e., it is uniformly more powerful for \(T \ge 100\).
-
Regardless of the test from which the procedure is started, a power of 1 is not achieved for \(\left| {\phi_{1} } \right| = 0.1\) for any sample size, not even at \(T = 1000\) (the best result corresponds to the Ljung–Box case with an estimated power of approximately 0.91, followed by the variance ratio and runs cases with values close to 0.8 and 0.53, respectively; the BDS case yields the worst result of approximately 0.18).
At this point, we can say that the power of the procedure has been analysed, that is, its capability of rejecting the null hypothesis (random walk 1) when the null hypothesis is false. As already mentioned, for \(\phi_{1} \ne 0\), Model (6) yields a series that does not follow any type of random walk. However, the proposed procedure contemplates random walk 3 among the possible decisions. Therefore, if from the powers calculated for each version of the procedure, we subtract the portion that corresponds to the (wrong) decision of random walk 3, we obtain the power that the procedure initiated from each test actually has, i.e., its capability to reject the null hypothesis in favour of true alternatives when the null hypothesis is false.
In this sense, Table 4 and Fig. 6 report, for each sample size T, the power calculations of the procedure initiated from each of the tests considered after subtracting the effect of the (false) alternative of random walk 3. Furthermore, the cited powers and those initially calculated for each version of the procedure are compared for each T in Figs. 9, 10, 11 and 12 (Appendix).

Source: Own elaboration
Real Monte Carlo power of the procedure when starting from each test against linear correlation-only alternatives.
When the procedure is started from the runs test, the variance ratio test or the Ljung–Box test (Appendix Figs. 10, 11, 12), what we call real power hardly differs from that initially calculated for each sample size T (these slight differences occur for \(\left| {\phi_{1} } \right| \le 0.5\) with \(T \le 100\) and \(\left| {\phi_{1} } \right| = 0.1\) with \(T \ge 250\)). Therefore, all the above-mentioned findings in relation to the power of these three cases is maintained.
Nevertheless, there are considerable differences between the real power and that initially calculated when the procedure is started from the BDS test. In effect, the initial calculations indicated that this version of the procedure was the most powerful for \(\left| {\phi_{1} } \right| \le 0.5\) and \(\left| {\phi_{1} } \right| \le 0.25\) for \(T = 25\) and \(T = 50\), respectively (with all the values greater than 0.5), but the results in Table 4 and Fig. 6 show that the powers in these cases are actually much lower (0.2 is hardly reached in one single case). Although these differences persist for \(T = 100\), also in the context of \(\left| {\phi_{1} } \right| \le 0,25\), they start to decrease as the sample size increases from \(T \ge 250\) (we could say that, for \(T \ge 500\), there are minimal differences between the real power and the initially calculated power).
Consequently, in terms of the power referring only to true alternatives (linear correlation in this case), the procedure initiated from the Ljung–Box test is the most powerful.
(b2) The performance of the procedure for testing the random walk 1 hypothesis against only the non-linear alternative (among the variables of the return series generating process) is analysed by means of an ARCH(1) model.
where \(h_{t}\) and \(\varepsilon_{t}\) are independent processes of each other such that \(h_{t}\) is stationary and \(\varepsilon_{t} \sim iid(0,1)\), with \(\alpha_{0} > 0\) and \(\alpha_{1} \ge 0\). Specifically, taking \(r_{0} = 0\) in (7), 10,000 samples of sizes T = 25, 50, 100, 250, 500 and 1000 of the series \(r_{t}\) are generated for \(\alpha_{0} = 1\) and each value of \(\alpha_{1}\) considered: 0, 0.1, 0.2, 0.3, 0.4 and 0.5.Footnote 9 In the particular case in which \(\alpha_{1} = 0\), Model (7) yields a return series that follows a random walk 1 and, for \(\alpha_{1} > 0\), series that are identified with a random walk 3, i.e., they would be generated by a process whose variables are uncorrelated but dependent (there are non-linear relationships among the variablesFootnote 10). Therefore, when random walk 3 is accepted, it is possible to develop models that allow market volatility to be predicted (model types ARCH and GARCH).
The procedure, starting from each of the four tests considered in this study, was applied to the different series generated by the combination of values for T and \(\alpha_{1}\) with a significance level of 5% [application of the process in Fig. 4 for expression (7)]. Then, we calculated the number of times that the different decisions contemplated by the two already known ways of applying the procedure were made.
On the basis of the results indicated in the previous paragraph and analogously to that described in Section (b1), we calculate, for each sample size T, the empirical size and the Monte Carlo power of each version of the procedure. In this context, \(\alpha_{1} = 0\) implies that the random walk 1 hypothesis is true, and \(\alpha_{1} > 0\) implies that it is not (it corresponds to a random walk 3).
-
b2.1
Empirical size
Since in this case the null hypothesis is again random walk 1, the obtained empirical sizes are nearly identical to those calculated in Section (b1) (the results are available on request).
-
b2.2
Monte Carlo power
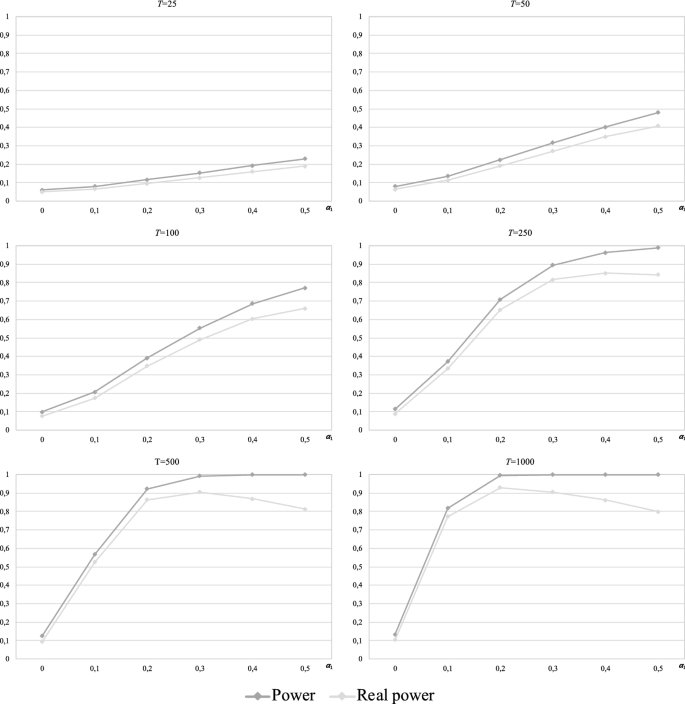
Table 5 and Fig. 7 show, respectively, the power calculations of each version of the procedure and the plots of the corresponding power functions (in terms of parameter \(\alpha_{1}\)) for each sample size T.

Source: Own elaboration
Monte Carlo power of the procedure when starting from each test against non-linear alternatives only.
The estimated power of the procedure when starting from the runs test is approximately 0.05 for all alternatives, irrespective of the value of T. In the other cases, the power is influenced by parameters T and \(\alpha_{1}\); as the values of these parameters increase, the power tends to unity.
-
Fig. 7 shows that the procedure initiated from the BDS test is uniformly more powerful when \(T \le 100\), and the difference between the estimated powers of the procedure with the BDS test and those of the other cases becomes more pronounced as the sample size decreases. When \(T = 25\), the estimated power of the procedure initiated from the BDS test is approximately 0.7 for all alternatives, while the estimated power when starting from the Ljung–Box test and the variance ratio test increases with \(\alpha_{1}\) from 0.2 and 0.08 to 0.35 and 0.23, respectively. The difference in the estimated power in favour of the procedure initiated from the BDS test decreases with increasing sample size T, especially at high values of \(\alpha_{1}\). Likewise, in all three cases, the estimated power improves when the sample size increases, but a power of 1 is not reached in any case (at \(T = 100\), the estimated power for \(\alpha_{1} = 0.5\) is approximately 0.8 in all three cases).
-
For \(T \ge 250\), the estimated power of the procedure initiated from the BDS test, Ljung–Box test and variance ratio test converges to 1 as \(\alpha_{1}\) increases. In all these cases, the value of \(\alpha_{1}\) for which the power achieves unity decreases as the sample size increases. Thus, at \(T = 250\), unity is reached for \(\alpha_{1} = 0.5\); at \(T = 500\), for \(\alpha_{1} \ge 0.3\), and at \(T = 1000\), for \(\alpha_{1} \ge 0.2\). On the other hand, the plots in Fig. 7 show that the power function of the procedure initiated from the Ljung–Box is always above the other power functions, i.e., it is uniformly more powerful for \(T \ge 250\). However, the difference in the estimated power (in favour of the procedure initiated with the Ljung–Box test) is not pronounced.
-
Finally, regardless of the test from which the procedure is started, a power of 1 is not achieved for \(\alpha_{1} = 0.1\) for any sample size, not even \(T = 1000\) (the best result corresponds to the Ljung–Box case with an estimated power of approximately 0.83, followed by the variance ratio case with a value of 0.82; the BDS case yields the worst result–without considering the runs case–of approximately 0.74).
In this case, for alternative \(\alpha_{1} > 0\), Model (7) yields a series that follows a random walk 3, and the proposed procedure contemplates “non-random walk” among the possible decisions. Therefore, it is interesting to analyse, with each version of the procedure, to what extent the rejection of the random walk 1 hypothesis (when this is false) leads correctly to random walk 3. In other words, we are interested in determining what part of the power calculated in each case corresponds to the acceptance of the random walk 3 hypothesis (under the assumption that the hypothesis of random walk 1 is false). According to Section b1), we calculate the power that the procedure initiated from each test actually has. Thus, Table 5 and Fig. 8 report, for each sample size T, Monte Carlo estimates of the probability of accepting the random walk 3 hypothesis (given that the type 1 is false) with the procedure initiated from each of the tests considered (i.e., the real power). Additionally, the cited real powers and those initially calculated for each version of the procedure are compared for each T in Figs. 13, 14, 15 and 16 (Appendix).

Source: Own elaboration
Real Monte Carlo power of the procedure when starting from each test against non-linear alternatives only.
As shown (Fig. 13), almost all the powers of the procedure initiated from the BDS test correspond to the acceptance of random walk 3 since the so-called real power hardly differs from that initially calculated for each sample size T. For large sample sizes, the real power tends to stabilize at approximately 0.96 as \(\alpha_{1}\) increases.
Similar behaviour is observed when the procedure is started from the variance ratio test, with the exception that, for \(T \ge 250\), the real powers become lower than those initially calculated as \(\alpha_{1}\) increases (for example, at \(T = 1000\), the estimated power for \(\alpha_{1} = 0.5\) was initially 1, but only 80% corresponds to the acceptance of the random walk 3 hypothesis).
Finally, the results show that an important part of the power initially calculated for the procedure when starting from the Ljung-Box test corresponds to the acceptance of a wrong alternative, i.e., the real power is significantly lower than the initial power, mainly at the small sample sizes (\(T = 25\) and 50). This extent of this loss of power decreases when \(T \ge 100\), and at \(T \ge 250\), the observed behaviour for high values of \(\alpha_{1}\) is the same as that described for the variance ratio case. Regardless, the real powers for the Ljung–Box case are lower than those for the variance ratio case.
Consequently, for the random walk 3 alternative (the only one that is true in this case), the procedure initiated from the BDS test is the most powerful.
5 Concluding comments
The methods traditionally applied to test the weak efficiency in a financial market, as the random walk model states, have serious limitations. They only test for a type of random walk or some necessary, but not sufficient, condition to accept the random walk hypothesis in one of its forms.
To address these limitations, a procedure that strategically combines traditional methods is proposed to detect whether a return series follows a specific type of random walk (1, 2 or 3). When the random walk hypothesis is rejected, the inefficient market is accepted, i.e. the market is predictable. In this context, future price changes can be predicted based on past price changes through a model of asset prices.
The proposed procedure is evaluated in the context of a random walk 1 against linearity and non-linearity alternatives using a Monte Carlo experiment. This procedure is applied starting from methods that test only a necessary, but not sufficient, condition for the fulfilment of the random walk 1 hypothesis (variance ratio test and Ljung–Box test) and from methods that directly test a particular type of random walk (BDS test and runs test).
The results allow us to conclude that, against linear correlation-only alternatives, the procedure performs best when starting from the Ljung–Box test. In this case, the real power of the procedure is higher than that when starting from any of the other tests, for any sample size, especially for larger ones (\(T \ge 100\)). In all cases, serious power distortions occur in the alternatives close to the null hypothesis (RW1). However, these distortions disappear as the sample size increase, except when the procedure is initiated from the BDS test (the aforementioned distortions remain for large sample sizes).
In contrast, against the random walk 3 alternative, the highest real powers for each sample size occur when the procedure is started from the BDS test. Again, all cases show poor real power in the alternatives close to the null hypothesis (random walk 1). These powers improve as the sample size increases, except in the case where the procedure is initiated from the runs test, which retains very low power against the RW3 alternative for all sample sizes (around the significance level \(\alpha = 0.05\)).
Regarding the size of the procedure, all the cases analysed present empirical values very similar to the corresponding estimated nominal size (for a significance level of \(\alpha = 0.05\)). In particular, the procedure initiated from the BDS test exhibits the greatest size distortions for small samples. However, there are no distortions when the procedure is started from the runs test, although its application is discouraged because its power for the random walk 3 alternative is poor.
The procedure introduced in this paper has been applied to evaluate the degree of fulfilment of the weak efficiency hypothesis in four European financial markets (Spain, Germany, France and Italy) from 1st January 2010 to 15th May 2020 (García-Moreno and Roldán 2021).
Currently, the authors are analysing the performance of the proposed procedure against other alternatives to the random walk hypothesis that are not considered in this work. They are also analysing the performance of the procedure when it combines formal and non-formal statistical inference techniques to accommodate random walk 2.
Availability of data and material
Not applicable.
Code availability
Not applicable.
Notes
The additional restrictions that are usually imposed correspond to the conditions of random walks 1 or 2, which fulfil the martingale hypothesis in a stronger sense (see Sects. 2.2.a and 2.2.b).
Filter rules and technical analysis are two forms of empirical testing of the RW2 hypothesis that, by not making use of formal statistical inference, are considered "economic" tests of the random walk 2 hypothesis.
Methods that try to detect non-linear relationships are called non-linear methods regardless of whether they are sensitive to the existence of linear relationships.
According to Hinich et al. (2005), economic systems are non-linear, and if this non-linearity is considerable, it is erroneous to forecast based on an estimated linear approximation. Therefore, the authors claim that testing for non-linearity is a means of validating the linearity of a system.
Since the testing of the RW2 hypothesis is not based on formal statistical inference, only the random walk types 1 and 3 can be considered in the experiment.
The variance ratio test suggested by Lo and MacKinlay (1988) has two versions: one that allows testing the uncorrelation of a return series and another that tests if the aforementioned series follows a random walk 3. The application of one version or another will depend on what the procedure requires at all times. If the variance ratio test, in any of its versions, leads to contradictory decisions for different values of parameter k (first values of the return series), the final decision is based on the global test proposed by Chow and Denning (1993).
Nonparametric test proposed by Brock, Dechert, LeBaron and Scheinkman (1996) for testing the null hypothesis that a series is independent and identically distributed. It is based on the correlation integral developed by Grassberger and Procaccia (1983), which is a measure of spatial correlation between two points of an m-dimensional space. We consider m = 2, 3, 4 and 5 since Monte Carlo experiments have shown that the BDS statistic has good properties for \(m \le 5\), regardless of the sample size (Kanzler 1999).
All the simulations were performed using routines developed in EViews 8 with the random number generator contained therein.
For an ARCH(1) model such as (7), the 4th-order moment of \(r_{t}\)
\(E\left[ {r_{t}^{4} } \right] = \frac{{3\alpha_{0}^{2} (1 + \alpha_{1} )}}{{(1 - \alpha_{1} )(1 - 3\alpha_{1}^{2} )}}\)
will be finite and positive if \(\alpha_{1}^{2} \in [0,1/3]\).
From Model (7) and the conditions under which it is defined, the uncorrelation of \(r_{t}\) is derived \(Cov(r_{t} ,r_{t - k} ) = E\left[ {(h_{t} \varepsilon_{t} )(h_{t - k} \varepsilon_{t - k} )} \right] = E\left[ {(h_{t} h_{t - k} )(\varepsilon_{t} \varepsilon_{t - k} )} \right] = E\left[ {h_{t} h_{t - k} } \right]E\left[ {\varepsilon_{t} \varepsilon_{t - k} } \right] = 0\) \(\forall k \ne 0\) (where it has been taken into account that \(E\left[ {r_{t} } \right] = E\left[ {h_{t} \varepsilon_{t} } \right] = E\left[ {h_{t} } \right]E\left[ {\varepsilon_{t} } \right] = 0\)\(\forall t\)), just as the non-linear relationship among the variables of the process \(r_{t}\) since \(r_{t}^{2}\) has a first-order autoregressive structure \(r_{t}^{2} = r_{t}^{2} + h_{t}^{2} - h_{t}^{2} = h_{t}^{2} + r_{t}^{2} - h_{t}^{2} = \alpha_{0} + \alpha_{1} r_{t - 1}^{2} + r_{t}^{2} - h_{t}^{2} = \alpha_{0} + \alpha_{1} r_{t - 1}^{2} + v_{t}\) being \(v_{t} = r_{t}^{2} - h_{t}^{2} = h_{t}^{2} \varepsilon_{t}^{2} - h_{t}^{2} = h_{t}^{2} \left( {\varepsilon_{t}^{2} - 1} \right)\) white noise.
References
Abdullah AÇIK, Baran E, Ayaz İS (2020) Testing the efficient market hypothesis: a research on stocks of container shipping companies. Glob J Econ Bus Stud 9(17):1–12
Adaramola AO, Obisesan OG (2021) Adaptive market hypothesis: evidence from nigerian stock exchange. J Dev Areas 55(2):1–16
Alexeev V, Tapon F (2011) Testing weak form efficiency on the Toronto Stock Exchange. J Empir Financ 18(4):661–691
Alvarez-Ramirez J, Escarela-Perez R (2010) Time-dependent correlations in electricity markets. Energy Econ 32(2):269–277
Appiah-Kusi J, Menyah K (2003) Return predictability in African stock markets. Rev Financ Econ 12(3):247–270
Bachelier L (1900) Théorie de la spéculation. In: Annales Scientifiques de l É.N.S., 3e série, tome 17, pp 21–86
Bailey RE (2005) The economics of financial markets. Cambridge University Press, New York
Brock WA, Dechert WD, Scheinkman JA (1987) A test for independence based on the correlation dimension. University of Wisconsin at Madison, Department of Economics Working Paper
Brock WA, Dechert WD, Lebaron B, Scheinkman JA (1996) A test for independence based on the correlation dimension. Econ Rev 15(3):197–235
Buguk C, Brorsen BW (2003) Testing weak-form market efficiency: evidence from the Istanbul Stock Exchange. Int Rev Financ Anal 12(5):579–590
Campbell JY, Lo AW, Mackinlay AC (1997) The econometrics of financial markets. Princeton University Press, New Jersey
Chen CW, Huang CS, Lai HW (2009) The impact of data snooping on the testing of technical analysis: an empirical study of Asian stock markets. J Asian Econ 20(5):580–591
Cheong CW, Nor AHSM, Isa Z (2007) Asymmetry and longmemory volatility: some empirical evidence using GARCH. Physica A 373:651–664
Chow KV, Denning KC (1993) A simple multiple variance ratio test. J Econ 58(3):385–401
Chu J, Zhang Y, Chan S (2019) The adaptive market hypothesis in the high frequency cryptocurrency market. Int Rev Financ Anal 64:221–231
Chuang WI, Liu HH, Susmel R (2012) The bivariate GARCH approach to investigating the relation between stock returns, trading volume, and return volatility. Glob Financ J 23(1):1–15
DePenya FJ, Gil-Alana LA (2007) Serial correlation in the Spanish stock market. Glob Financ J 18(1):84–103
Dicle MF, Beyhan A, Yao LJ (2010) Market efficiency and international diversification: Evidence from India. Int Rev Econ Financ 19(2):313–339
Fama EF (1965) The behavior of stock-market prices. J Bus 38(1):34–105
Fama EF (1970) Efficient capital markets: a review of theory and empirical work. J Financ 25(2):383–417
Fama EF (1991) Efficient capital markets: II. J Financ 46(5):1575–1617
Fisher L (1966) Some new stock-market indexes. J Bus 39:191–225
French KR (1980) Stock returns and the weekend effect. J Financ Econ 8(1):55–69
García-Moreno MB, Roldán JA (2021) Análisis del grado de eficiencia débil en algunos mercados financieros europeos. Primer impacto del COVID-19. Revista de Economía Mundial 59:243–269
Grassberger P, Procaccia I (1983) Characterization of strange attractors. Phys Rev Lett 50(5):346–349
Gultekin MN, Gultekin NB (1983) Stock market seasonality: international evidence. J Financ Econ 12:469–481
Hasan T, Kadapakkam PR, Ma Y (2003) Tests of random walk for Latin American stock markets: additional evidence. Lat Am Bus Rev 4(2):37–53
Hinich MJ, Mendes EM, Stone L (2005) A comparison between standard bootstrap and Theiler's surrogate methods. University of Texas, Austin
Ho KY, Zheng L, Zhang Z (2012) Volume, volatility and information linkages in the stock and option markets. Rev Financ Econ 21(4):168–174
Hoque HA, Kim JH, Pyun CS (2007) A comparison of variance ratio tests of random walk: a case of Asian emerging stock markets. Int Rev Econ Financ 16(4):488–502
Jamaani F, Roca E (2015) Are the regional Gulf stock markets weak-form efficient as single stock markets and as a regional stock market? Res Int Bus Financ 33:221–246
Jayasinghe P, Tsui AK (2008) Exchange rate exposure of sectoral returns and volatilities: evidence from Japanese industrial sectors. Jpn World Econ 20(4):639–660
Juana J (2017) Foreign exchange market efficiency in Botswana. Rev Econ Bus Stud 10(1):103–125
Kanzler L (1999). Very fast and correctly sized estimation of the BDS statistic. Unpublished manuscript. Department of Economics, University of Oxford
Khan W, Vieito JP (2012) Stock exchange mergers and weak form of market efficiency: the case of Euronext Lisbon. Int Rev Econ Financ 22(1):173–189
Khanh P, Dat P (2020) Efficient market hypothesis and calendar effects: empirical evidences from the Vietnam stock markets. Accounting 6(5):893–898
Kołatka M (2020) Testing the adaptive market hypothesis on the WIG Stock Index: 1994–2019. Prace Naukowe Uniwersytetu Ekonomicznego We Wrocławiu 64(1):131–142
Kumar D (2018) Market efficiency in Indian exchange rates: adaptive market hypothesis. Theor Econ Lett 8(9):1582–1598
Leković M (2018) Evidence for and against the validity of efficient market hypothesis. Econ Themes 56(3):369–387
Lim KP, Brooks RD, Hinich MJ (2008a) Nonlinear serial dependence and the weak-form efficiency of Asian emerging stock markets. J Int Financ Markets Inst Money 18(5):527–544
Lim KP, Brooks RD, Kim JH (2008b) Financial crisis and stock market efficiency: empirical evidence from Asian countries. Int Rev Financ Anal 17(3):571–591
Ljung GM, Box GEP (1978) On a measure of lack of fit in time series models. Biometrika 65(2):297–303
Lo AW, MacKinlay AC (1988) Stock market prices do not follow random walks: evidence from a simple specification test. Rev Financ Stud 1(1):41–66
Marshall BR, Young MR, Rose LC (2006) Candlestick technical trading strategies: can they create value for investors? J Bank Finance 30(8):2303–2323
Moore AB (1964) Some characteristics of changes in common stock pices. In: Cootner P (ed) The random character of stock market prices. MIT Press, Cambridge, pp 262–296
Nti IK, Adekoya AF, Weyori BA (2020) A systematic review of fundamental and technical analysis of stock market predictions. Artif Intell Rev 53(4):3007–3057
Omane-Adjepong M, Alagidede P, Akosah NK (2019) Wavelet time-scale persistence analysis of cryptocurrency market returns and volatility. Physica A 514:105–120
Picasso A, Merello S, Ma Y, Oneto L, Cambria E (2019) Technical analysis and sentiment embeddings for market trend prediction. Expert Syst Appl 135:60–70
Potvin JY, Soriano P, Vallée M (2004) Generating trading rules on the stock markets with genetic programming. Comput Oper Res 31(7):1033–1047
Righi MB, Ceretta PS (2013) Risk prediction management and weak form market efficiency in Eurozone financial crisis. Int Rev Financ Anal 30:384–393
Roberts HV (1967) Statistical versus clinical prediction of the stock market. Unpublished paper presented at The Seminar on the Analysis of the Security Prices, University of Chicago
Roseff M, Kinney W (1976) Capital market seasonality: the case of stock market returns. J Financ Econ 3:379–402
Rossi M, Gunardi A (2018) Efficient market hypothesis and stock market anomalies: empirical evidence in four European countries. J Appl Bus Res 34(1):183–192
Ryaly VR, Kumar RK, Urlankula B (2014) A study on weak-form of market efficiency in selected Asian stock markets. Indian J Finance 8(11):34–43
Samuelson PA (1965) Proof that properly anticipated prices fluctuate randomly. Ind Manag Rev 6(2):41–49
Sánchez-Granero MA, Balladares KA, Ramos-Requena JP, Trinidad-Segovia JE (2020) Testing the efficient market hypothesis in Latin American stock markets. Physica A 540:1–14
Shynkevich A (2012) Short-term predictability of equity returns along two style dimensions. J Empir Financ 19(5):675–685
Stoian A, Iorgulescu F (2020) Fiscal policy and stock market efficiency: an ARDL bounds testing approach. Econ Model 90:406–416
Theil H, Leenders CT (1965) Tomorrow on the Amsterdam stock exchange. J Bus 38:277–284
Tiwari AK, Aye GC, Gupta R (2019) Stock market efficiency analysis using long spans of data: a multifractal detrended fluctuation approach. Financ Res Lett 28:398–411
Yao H, Rahaman ARA (2018) Efficient market hypothesis and the RMB-dollar rates: a nonlinear modeling of the exchange rate. Int J Econ Finance 10(2):150–160
Funding
Open Access funding provided thanks to the CRUE-CSIC agreement (University of Cordoba/CBUA) with Springer Nature.
Author information
Authors and Affiliations
Corresponding author
Ethics declarations
Conflict of interest
We have no conflicts of interest to disclose.
Additional information
Publisher's Note
Springer Nature remains neutral with regard to jurisdictional claims in published maps and institutional affiliations.
Appendix
Appendix

Source: own elaboration
Procedure started from the BDS test: power vs. real power (linear correlation-only alternatives).

Source: own elaboration
Procedure started from the runs test: power vs. real power (linear correlation-only alternatives).
Source: own elaboration
Procedure started from the variance ratio test: power vs. real power (linear correlation-only alternatives).

Source: own elaboration
Procedure started from the Ljung–Box test: power vs. real power (linear correlation-only alternatives).

Source: own elaboration
Procedure started from the BDS test: power vs. real power (non-linear alternatives only).

Source: own elaboration
Procedure started from the runs test: power vs. real power (non-linear alternatives only).
Source: own elaboration
Procedure started from the variance ratio test: power vs. real power (non-linear alternatives only).

Source: own elaboration
Procedure started from the Ljung–Box test: power vs. real power (non-linear alternatives only).
Rights and permissions
Open Access This article is licensed under a Creative Commons Attribution 4.0 International License, which permits use, sharing, adaptation, distribution and reproduction in any medium or format, as long as you give appropriate credit to the original author(s) and the source, provide a link to the Creative Commons licence, and indicate if changes were made. The images or other third party material in this article are included in the article's Creative Commons licence, unless indicated otherwise in a credit line to the material. If material is not included in the article's Creative Commons licence and your intended use is not permitted by statutory regulation or exceeds the permitted use, you will need to obtain permission directly from the copyright holder. To view a copy of this licence, visit http://creativecommons.org/licenses/by/4.0/.
About this article

Cite this article
Roldán-Casas, J.A., García-Moreno García, M.B. A procedure for testing the hypothesis of weak efficiency in financial markets: a Monte Carlo simulation. Stat Methods Appl 31, 1289–1327 (2022). https://doi.org/10.1007/s10260-022-00627-4
Accepted:
Published:
Issue Date:
DOI: https://doi.org/10.1007/s10260-022-00627-4