
Abstract
The P-Graph framework is an efficient tool that deals with the solution of Process Network Synthesis (PNS) problems. The model uses a bipartite graph of material and operating unit nodes, with arcs representing material flow. The framework includes combinatorial algorithms to identify solution structures, and an underlying linear model to be solved by the Accelerated Branch and Bound algorithmic method. An operating unit node in a P-Graph consumes its input materials and produces its products in a fixed ratio of operation volume. This makes it inadequate in modeling such real-world operations where input composition may vary, and may also be subject to specific constraints. Recent works address such cases by directly manipulating the generated mathematical model with linear programming constraints. In this work, a new general method is introduced which allows the modeling of operations with flexible input ratios and linear constraints in general, solely by tools provided by the P-Graph framework itself. This includes representing the operation with ordinary nodes and setting up their properties correctly. We also investigate how our method affects the solution structures for the PNS problem which is crucial for the performance of algorithms in the framework. The method is demonstrated in a case study where sustainable energy generation for a plant is present, and the different types of available biomass introduce a high level of flexibility, while consumption limitations may still apply.
1 Introduction
Finding sustainable energy supply methods is of crucial importance in today’s society. This is a necessary condition in establishing and maintaining conditions on Earth which allows civilized human life at the long term. It is also a challenging task, as human population is rapidly increasing, along with total consumption and energy demands (Worldwatch Institute 2018). Manufacturing on its own consumes an enormous amount of 2.2 EJ energy annually (Lan et al. 2016; US Energy Information Administration 2018), and is still strongly relying on fossil fuels (International Energy Agency 2019).
Designing a process network for sustainable energy supply in general can be difficult due to the number of options to choose from. Originally, decisions about which technologies to be used, what capacities to invest into, which material sources to be utilized, and how to schedule workflow were made by experts intuitively. However, systematic modeling and optimization tools can help reducing or eliminating human errors, as computational power can be utilized to consider a huge number of possibilities. Common objectives for optimization include profit or throughput maximization, or makespan, total cost and resource usage minimization.
There are combinatorial algorithms available for specific optimization problems, where the exact step by step manipulation of data and construction of the final solution is explicitly formalized. The advantage of combinatorial algorithms is that their performance can be estimated well while they are potentially very fast, because the structure of the underlying problem to be solved is captured in the logic of the algorithm. The disadvantage is that development and extension of such methods is often difficult. It is a common scenario that a new circumstance arises which shall be incorporated into finding the most suitable solution, but extending a simple method to a larger problem class can be tedious or impossible.
An alternative to combinatorial algorithms is the usage of mathematical programming models. This is a fundamentally different approach because it is not the solution procedure which is formalized, but the rules describing the situation. The freedom of choice is represented in variables, the rules are represented as constraints, and the goal of optimization is represented as an objective function. It is not the designer of the mathematical model who evaluates it, but a general purpose model solver software. The difficulty of solving a general model depends on what kinds of variables and constraints are present, for this reason model classes are distinguished. A common class is Linear Programming (LP), in which variables are continuous, the constraints and the objective are all linear. Another, very popular model class is Mixed-Integer Linear Programming (MILP), which extends LP by allowing integer variables. MILP models are a good compromise between describing power of the model and acceptable solver performance. The advantage of mathematical programming in general is that it is easier and faster to develop, maintain and extend with additional constraints if needed. Complex and unique manufacturing and scheduling models may not have general algorithms existing, but may be modeled with mathematical programming. The drawbacks of mathematical programming are the difficulty of verification, solution performance is usually limited, and is highly dependent on the model itself, therefore modeling requires great expertise. Another problem is that because the solution procedure is done by a solver tool, usually there is a little control over it.
The P-Graph framework, originally introduced by Friedler et al. 1992, tackles Process Network Syntheses (PNS) problems. The framework consists of both combinatorial and mathematical programming parts. The term P-Graph has a twofold meaning: it is the name of the representation and also the name of the framework. The P-Graph framework can effectively be used to graphically model and optimize complex process networks. It has the generality and ease of development experienced for mathematical programming models. Meanwhile the rigorous mathematical formulation allows precise and proven algorithmic methods for solution. Solving optimization problems with PNS therefore combines advantages of both combinatorial algorithms and mathematical programming. For example, an important advantage of the P-Graph framework is that the best \( n \) solutions all can be computed easily.
A P-Graph model consists of material and operating unit nodes, with arcs between them representing the material flows the operating units may perform. The methodology was adapted to problems other than process networks network synthesis, for example scheduling problems, separation network synthesis, heat-exchanger network synthesis, etc. There is one difficulty in modeling with P-Graphs which is in focus of our work: operating unit nodes must have fixed ratios for input material consumption and output material production. This reflects reality in a lot of cases, for example if the operating unit represents a product with fixed recipe, requiring exact amount of materials to be produced. But in other cases an operation step, which can be any process, technological step, transformation, transportation or storage, may be more complex and would allow variable ratios of input materials to be used there. Inputs can even be independent in some cases. These operations cannot be represented by a single operating unit node in a P-Graph.
Recent methods tackled the problem of flexible inputs by manually altering the model with MILP constraints added to the solution of the P-Graph model (Szlama et al. 2016). Besides being an ad hoc solution for a particular case study, with this method the original framework cannot be used on its own. Therefore, adequate methods for modeling different kinds of operations with flexible inputs were investigated and described. The point is that we only use the tools of the P-Graph framework itself to obtain the models. That means, the model works by the introduction of additional nodes and arcs in the P-Graph and properly adjusting their parameters. A range of different operating unit models are presented that can be used in general in PNS problems. We also examine how our models affect the solution structures of the PNS problem, which is an important factor for the existing combinatorial algorithms in the framework.
A case study is also presented which optimizes sustainable energy supply. The study involves different types of biomass, which can be used in any combinations—a typical scenario for flexible inputs. The pelletizer and biogas plant equipment units in the problem therefore require adequate modeling. Also, we introduce another type of constraint into the model which limits relative usage of energy grass, to demonstrate the different kinds of general flexible input handling methods we presented.
Our work is structured as follows. Section 2 is a literature review. The basics of P-Graphs and PNS problems, along with our motivation and problem statement in Sect. 3 are introduced. In Sect. 4, we describe the model elements proposed. Finally, a case study is presented in Sect. 5, followed by our conclusions.
2 Literature review
The P-Graph methodology is based on the bipartite Process Graph, or in short, P-Graph model. It is able to unambiguously describe flow networks, and correctly model PNS problems (Friedler et al. 1992). Note that P-Graphs can be applied to similar network-based problems as Petri nets, but while Petri nets are discrete and target simulation, P-Graphs represent PNS problems with continuous nature and their main purpose is synthesis and optimization. The theoretical method described in the first publication was soon followed by the main algorithms of the framework, Maximal Structure Generation (Friedler et al. 1993), Solution Structure Generation (Friedler et al. 1995), and the Accelerated Branch and Bound method (Friedler et al. 1996), which is used until today for solving PNS problems.
The P-Graph Studio (2019) (available at www.p-graph.org) is a software tool supporting modeling and solving PNS problems with P-Graphs, with all the benefits of the framework. This software allows a graphical editor for P-Graphs, similar to graphical programming languages like LabView or Scratch. Solution algorithms are still tuned and new features are introduced to improve performance (Bartos and Bertok 2018). One important feature is that not only the best, but the first \( n \) best solution structures can be reported for a PNS (Varga et al. 2010), which is in contrast with LP/MILP models.
The framework was extended to Time-Constrained PNS problems (Kalauz et al. 2012), where scheduling decisions can be associated with the materials and operating units of an ordinary PNS. Another extension was the multi-periodic modeling scheme (Heckl et al. 2015), which was also included in the framework (Bertok and Bartos 2018). This scheme allows demands and/or supplies that strongly fluctuate in time to be adequately modeled, especially for estimating required equipment capacities.
The P-Graph framework was originally targeted at chemical engineering, but the method was widely adapted since to a wide range of problems. It turned out that it is an alternative to mathematical programming tools, having notable advantages. The framework is also useful for teaching purposes (Lam et al. 2016; Promentilla et al. 2017). Reviews of potential usages are done by Lam 2013, Klemeš and Varbanov 2015. There are numerous applications for projects targeting sustainable operation (Cabezas et al. 2018).
With the sheer modeling potential of P-Graphs, problems having a strong combinatorial nature can also be tackled, for example special kinds of Vehicle Routing Problems (Barany et al. 2011), scheduling problems (Frits and Bertok 2014), assigning workforce to jobs (Aviso et al. 2019b), and production line balancing (Bartos and Bertok 2019). Separation Network Synthesis involves separation of chemicals with multiple options of predefined technological steps, which is also addressed by the framework (Heckl et al. 2010).
It is possible to estimate and take into account the risks of a system to be optimized (Süle et al. 2019; Benjamin 2018). This is important because systems addressed as PNS problems usually consist of a set of interconnected elements, therefore a possible failure may pose threat to the whole system, which is hard to intuitively measure. Reliability analysis can be included into the solution algorithms (Orosz et al. 2018), and it is also possible to propose reactions for equipment failure based on the found PNS solutions (Tan et al. 2014).
Sustainability is a key goal when decisions are to be made about supply chains, for which general solution methods are published (Saavedra et al. 2018; Nemet et al. 2016), some involving smaller to larger scales (Kalaitzidou et al. 2016). Purely mathematical programming methods exist, as well as hybrid P-Graph and mathematical programming approaches, addressing for example biomass supply chain optimization (How et al. 2016; Lam et al. 2010). Some economical scenarios include cogeneration of heat and electricity in the same facility, sometimes even incorporating cooling other products (polygeneration). Integration of production and industrial demands can improve energy efficiency, and a need for adequate modeling tools is arising. Operating costs can be minimized by a P-Graph model of the system, while other factors like carbon footprint can also be taken into account (Cabezas et al. 2015; Vance et al. 2015). Okusa et al. 2016 proposed a method to address sustainable polygeneration system design. For such systems, the multi-periodic scheme can also be applied (Aviso et al. 2017). Biomass supply chains were also investigated with the methodology to find bottleneck factors in the system (Lam et al. 2017; How et al. 2018). Carbon Management Networks (CMN) can also be modeled and optimized with P-Graphs (Tan et al. 2017; Aviso et al. 2019a).
Managing the inputs of operations is in focus of this work. It shall be noted that operating units with flexible input were modeled in case studies with heat and electricity generation (Szlama et al. 2016), by the manipulation of the mathematical programming model generated by the P-Graph. Cogeneration plant modeling may also include smaller models within the framework itself, for example a P-Graph model for fuzzy constraints (Aviso and Tan 2018). Note that it is also possible to model independent inputs with the tools of the framework itself, proven in previous works for a case study of sustainable energy supply of a manufacturing plant (Éles et al. 2018, 2019).
3 Methodology
Here we first introduce the main concepts of the P-Graph framework and corresponding solution methods, followed by our motivation of work and exact definition of the problem we intend to solve.
3.1 The P-Graph
The bipartite graph model, the P-Graph itself has two sets of nodes: material nodes (\( M \)) and operating unit nodes (\( O \)).
-
Material nodes represent states of the model, or simply materials. These can be actual materials, workforce, funds, and more. States available at different times, places, roles or conditions may be modeled as different material nodes depending on modeling goal. Usually, each material node stands for something from which a positive quantity may be utilized.
-
Operating unit nodes represent different kinds of transformations of some set and amount of materials to others. Examples include technological steps in some production equipment, storage and transportation.
Some materials and operating unit nodes may be present for modeling purposes only and do not resemble physical activities and actual materials.
Arcs connect operating unit nodes to material nodes and vice versa, describing the operating units’ capabilities as follows.
-
An arc from a material node to an operating unit node represents that the material is an input to the modeled operation, which is consumed as the operation takes place.
-
An arc from an operating unit node to a material node represent that the material is an output from the modeled operation, which is produced as the operation takes place.
Usually an operating unit models some material manipulation step that has an operation volume, a quantity which scales the amount of inputs utilized as well as products produced.
The P-Graph is described by sets \( M \), \( O \) and arcs between these nodes.
3.2 PNS problems with P-Graphs
A PNS problem description consists of the P-Graph of all the available materials and operations (see Fig. 1), and additional data. There are three kinds of material nodes in a PNS.
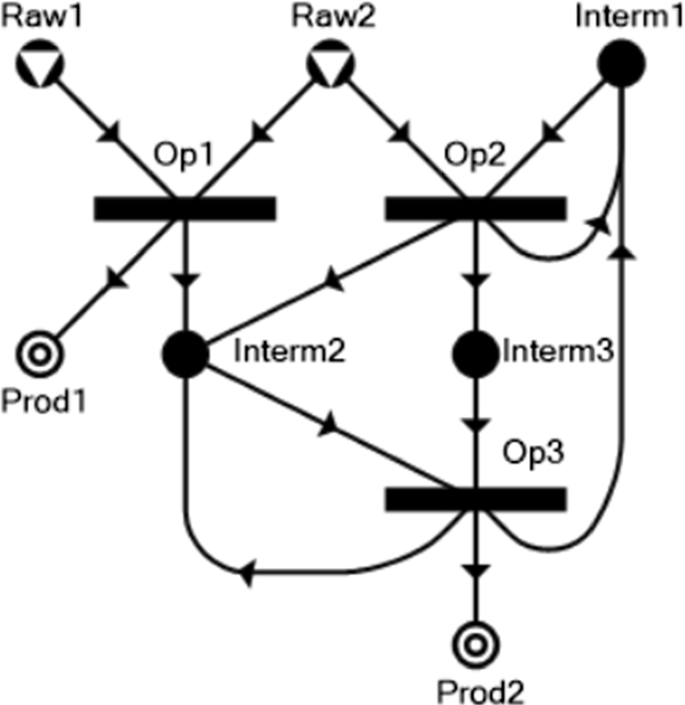
Example of a P-Graph with different kinds of material nodes
-
A product material node is one which is a target for PNS. All solutions must include at least one way to produce it by some operating units.
-
A raw material node is one which is available a priori. It cannot be an output of an operating unit node.
-
Any other nodes are intermediate material nodes. These can only be obtained by operating units in the PNS, but can be used as input for other operating units. If we do not explicitly refer to a node as being raw material or product material node, we assume it is an intermediate material node.
The PNS problem can be described as a \( \left( {P, R, O} \right) \) triplet. The first term is the set of products, the second is the set of raw materials, and the third is the set of all operating units that can be involved. The goal is a working solution for the network, in which all products are actually produced and the system is feasible.
A solution structure is a subset of a P-Graph that represents the solution of a PNS defined on it. Therefore, it is itself a P-Graph. It shows which operating units are actually utilized, and what materials are involved in the solution. There are five axioms which precisely describe what P-Graphs are the solution structures of a PNS (Friedler et al. 1992). A subset of a process network fulfilling these conditions is also called combinatorially feasible.
-
(S1) All final products must be included in a solution structure.
-
(S2) Any material, which is not a raw material, must be the output of some operating unit.
-
(S3) Only such operating units can be selected that are defined in the PNS.
-
(S4) Each operating unit must have a path leading to a final product.
-
(S5) Any material must be an input from or an output to at least one operating unit.
3.3 Fundamental algorithms
There are fundamental algorithms based on P-Graphs, which help in solving PNS problems.
-
The Maximal Structure Generation (MSG) algorithm (Friedler et al. 1993) finds the so-called maximal structure of a PNS problem. In polynomial time, MSG eliminates redundant operating units and materials which can be a priori known not to be useful. The resulting structure is called maximal structure, and is proven to be itself a solution structure. The MSG algorithm is commonly used as an initial preprocessing step for other algorithms.
-
The Solution Structure Generation (SSG) algorithm (Friedler et al. 1995) systematically lists all solution structures of a PNS problem. Note that the work required can be very large, as it is proportional to the number of solution structures. Combinatorial explosion can also be observed for P-Graphs. Nevertheless, SSG can be used as part of sophisticated solution algorithms for PNS.
3.4 Problem data
The parts of the P-Graph mentioned so far capture the structure of a PNS or other optimization problem well, but it must also be supported by additional problem data in order to fully describe a problem instance. These may include, but are not limited to the following.
-
For material nodes, maximum and minimum available amounts, costs and measurement units, can be provided.
-
For operating unit nodes, yearly investment and operational costs (both fixed and proportional), as well as minimum and maximum operation volume, and payback period can be provided.
-
For arcs, flow rates have to be provided as ratios. These ratios determine the flow rates in terms of the operation volume of the corresponding operating unit, regardless of being an input or output.
The basis of a solution for a PNS problem is a solution structure. However, a complete solution also includes additional decisions, including operation volumes for units, and material balances for each material (see Fig. 2). The objective of optimization can also be varied, but cost minimization and throughput maximization are the most common.

Sample PNS problem with its P-Graph add flow rates also depicted
The addition of the aforementioned constraints and other factors into a PNS problem cause that some of the solution structures may even turn out to be infeasible.
Solving a PNS problem would be possibly done by an implementation of a MILP model, however, there are effective methods utilizing the P-Graph framework. One simple method is the combination of SSG and LP relaxations. Alternatively there is an Accelerated Branch and Bound (ABB) method specifically designed for PNS problems modeled by a P-Graph (Friedler et al. 1996).
One major advantage of solving a PNS problem by a P-Graph model with the above methods is that we can find and report the solutions for the \( n \) best solutions structures. This means not only the optimal, but the first \( n \) best solutions are reported, in order. This is a great advantage for decision makers, and is in contrast with MILP models where usually only a single optimal or suboptimal solution is to be found.
3.5 Motivation
One fundamental property of operating unit nodes is that the ratios of their total inputs and outputs are fixed. This is a natural consequence of the fact that the operation volume, a single continuous variable, can describe material flows for all inputs and outputs of the operating unit. Historically, PNS problems were first formulated for chemical engineering problems, where this was a good assumption.
This kind of operating unit model would work well for some cases, for example chemical reactions, where the exact proportion of inputs and outputs are known a priori. However, in other cases we have to model technological steps or equipment units with a greater variability in inputs. For example, a furnace can be fed with different materials, in any composition, and would produce different amounts of heat based on our choice. Or, a storage tank can hold any amounts of different materials at once. Intuitively, the total freedom of choice can be described by not a single variable operation volume, but a variable per each of the input materials. This is what flexible inputs mean in our interpretation: complex operating unit models, where the ratio of input material amounts can vary.
One operating unit node in a P-Graph is not suitable to model these instances. There have been efforts to achieve the optimization goal where the P-Graph included some production steps with flexible input ratios. This was done by manipulating the solution of the model by LP tools (Szlama et al. 2016). However we propose to use several operating unit and/or material nodes to obtain an equivalent P-Graph model for such cases. This means that flexible inputs can be implemented within the P-Graph framework itself. This is essential because the original algorithmic and solution framework can be used on such problems without further manipulation of the solution procedure.
Therefore, some specific cases of operating units with flexible inputs in general were investigated, and the results were applied on a case study where a sustainable energy supply of a manufacturing plant is in question, and multiple possible biomass sources are included.
3.6 Problem definition
We formally define what kind of operations our work focuses on. Suppose that the inputs are materials \( A_{1} , A_{2} \ldots A_{n} \) and the outputs are materials \( B_{1} ,B_{2} \ldots B_{k} \) already modeled in the P-Graph. Assumptions are the following.
-
Input material amounts of each \( A_{i} \), from now denoted by \( x_{i} \), and output amounts of each \( B_{j} \) unambiguously describe a situation.
-
These amounts, regardless of quantity, are always nonnegative. Negative consumption or negative production are rarely a case and are not covered here. Note that, in such cases the roles of being an input or output can be simply switched. Or, if both positive and negative directions of material flow are possible, these can be modeled by two separate operating units simultaneously with nonnegative flows each.
-
Output material amounts of each \( B_{j} \) are determined as linear combinations of the input material amounts. This means that the total freedom regarding an operating unit with flexible input in this work relies solely on the amounts of inputs used.
-
Linear constraints can be formulated on input amounts. These constraints are independent of each other. In each constraint, any amounts of \( A_{i} \) multiplied by a positive coefficient may appear as a term in either (but not both) side of a non-strict inequality. There can be a positive constant term also, at either (but not both) sides.
Actually the description of a constraint can simply be something like \( \sum\nolimits_{i = 1}^{n} {\lambda_{i} x_{i} \le C} \) where \( x_{i} \) are input material amounts, \( \lambda_{i} \) are coefficients, and \( C \) is the constant term. However, the above definition relies only positive (or zero, as missing) coefficients and terms and therefore introduces several distinct cases for flexible inputs. This prepares for modeling with the P-Graph framework.
We also investigate how such complex operating units may appear in solution structures. For simple operations that can be modeled by a single operating unit node, this is easy: it can either be part of a solution structure or not. If it is not part of any solution structure, then the MSG algorithm excludes it, possibly with some material nodes. However, when a complex operating unit in a P-Graph is modeled via a set of operating units, then it is a valid question that which subset of those operating units may appear in a solution structure, and how many redundant solutions may exist.
4 Modeling cases for flexible inputs
Instead of showing the final P-Graph for modeling the general case of flexible inputs, we start from simple instances and go towards generality, illustrating each step with examples.
For the sake of simplicity, we assume there is a single output material. Later we will see that multiple output materials can be implemented in parallel and independent of each other, so we do not lose generality by considering only one output at a time.
A small nomenclature is provided here for common symbols in the model descriptions.
-
\( a_{i} \) Input flow rate for input material \( A_{i} \) in a single operating unit node.
-
\( b \) Output flow rate for the output material in a single operating unit node.
-
\( \lambda_{i} \) Constant coefficient for input material \( A_{i} \) in imposed linear constraints.
-
\( n \) Number of input materials for the operation.
-
\( v_{i} \) Linear contribution factor of input material \( A_{i} \) to the output amounts.
-
\( x \) Operating volume of a single operating unit node.
-
\( x_{i} \) Operating volume of the operating unit node introduced for input material \( A_{i} \), which equals the amount consumed by the modeled operation.
-
\( y \) Output material amount produced.
4.1 Single operating unit node
As a starting point, let us see what happens when an operation is modeled with a single operating unit node in a P-Graph. This is the traditional interpretation of an operating unit: the input materials are consumed in a fixed ratio, and the output is a linear expression of the input amounts. A single variable \( x \) for volume of operation is sufficient to express the input and output amounts as follows.
Note that \( a_{i} \) and \( b \) are not only constants describing the operation, these are also the flow ratios on the arcs if a P-Graph operating unit is used for modeling (see Fig. 3).

Single operating unit node having three inputs and single output, with flow rates depicted
Real-world situations where a product has a fixed recipe and therefore requires a fixed amount per unit production can be modeled with a single operating unit node.
Solution structures may either include this node or not, based on whether the operation is needed in some nonzero volume in the solution or not at all.
4.2 Independent inputs
In some circumstances, the inputs of an operation are independent of each other. Provided that our assumptions still hold and the output is a linear expression of the inputs, the following equation describes the operation.
Contrary to the single node case, there is not a single free variable, but one for each input material, and they differ at the contribution ratio \( v_{i} \) for the output material amount \( y \).
The model of such an operating unit is still straightforward. We can introduce a single operating unit node for each of the inputs, which produce \( v_{i} \) units of the output material per \( 1 \) unit of input material \( A_{i} \) consumed (see Fig. 4).

Modeling operation with three completely independent input materials
This operation can be the case when a desired product is to be obtained from different and independent sources. For example, if a furnace is to be modeled, and its output is heating, then its inputs can be different combustible materials, each having a unique heating value \( v_{i} \) contributing to production.
There are \( 2^{n} \) possible ways such an operation may appear in a solution structure, as either input may be chosen to be present or not. If the operation is not used at all, then none of its inputs are active, and therefore none of them are present. If there is some production, then there are \( 2^{n} - 1 \) different possibilities. Note that each input method may have own fixed or proportional investment and operating costs, and also capacities associated. These details usually make some of the input methods financially more favorable than others.
4.3 Output capacity
A possible extension from the cases of independent inputs is when the operation with flexible inputs to be modeled has some constraint for the output material amount. For example, a capacity, which is an upper bound. For example, the furnace as in the previous example, or an electric converter may have several feeds, buts its total throughput is bounded. The bound can either be fixed, or can be scaled as an investment parameter.
Equation (2) describes the situation formally, but there is a \( y \le C_{max} \) capacity constraint added.
The problem is that \( y \le C_{max} \) is directly supported by the modeling software for a single operating unit only. This is the case for the P-Graph Studio where \( C_{max} \) is the capacity of operating volume, it can either be fixed, or can be scaled by investment costs linearly. But how can the same bound be implemented if the operating unit is itself modeled as a set of operating unit nodes in a P-Graph, as in the case of independent inputs?
One key observation about this case is that the constraint itself only relies on information about the final output amount itself, which is \( y \), and it does not matter which inputs it comes from. This fact is a serious distinction from future cases for flexible input. In this case, a single operating unit after the original output material can be introduced. This shall consume the original output material and produce the actual one (see Fig. 5). Any parameters about the output volume that may impose restrictions, for example capacity, investment and operating costs, shall be provided to this new unit.

Modeling operation with three independent inputs and a maximal capacity for the total output amount produced
The solution structures in this case are quite similar as before. The newly introduced operating unit has to be present whenever any of the input methods are utilized.
4.4 Unique input capacity
Suppose that the operating unit with flexible inputs is modeled, but now it is not the output which has a capacity restriction but some other, general linear combination of the inputs. Formally as Eq. (2) with the following constraint added.
Here \( \lambda_{i} \) are coefficients different from \( v_{i} \), therefore we need a new constraint to express the upper limit \( C_{max} \). Note that we suppose that \( \lambda_{i} \ge 0 \), so each input actually contributes to the capacity. This can be a real world situation for example in case of a pelletizer, where different types of biomass can be the source of the pellets, and the heating value of the pellets is the output. The problem is that the pelletizer has some capacity which is usually expressed in terms of total mass or volume of the biomass used, but has nothing to do with the heating power of the product. It is likely not an option to model the pelletizing processes individually for each input, as the same pelletizer equipment may be used anyways for all purposes, so inputs are no way independent anymore.
The solution is that a logical capacity operating unit is introduced which produces a logical capacity material. This material node is then fed to each of the individual operating unit nodes of the input materials, in their own ratios (see Fig. 6).

Modeling operation with a capacity based on inputs independent of the output amount
This way, the capacity available can be limited by the logical capacity operating unit. Moreover, the ratios of capacity consumption may be set so that the unique constraint for capacity is obtained, independent of the outputs.
If we investigate this structure, we can see that whenever an input method is used in a solution structure, then the logical capacity material must be included, which implies that the logical capacity operating unit must also be present. The number of possible solution structures is the same as in the case of output capacity constraints.
Note that this logical capacity operating unit must be implemented in this direction, that is, as a logical input. It might be possible to implement the capacity as a logical output, and a logical operating unit that consumes the “arising” capacity. In PNS problems there can usually be a zero material balance set for material nodes, so this might seem equivalent to the previous case (see Fig. 7).

Modeling a unique capacity constraint as logical outputs instead of logical inputs
However, the MSG algorithm, based on axiom (S4) of solution structures may eliminate the logical part in this case, as it seemingly does not contribute to products. This is certainly not what we want, so logical inputs instead are the better choice.
4.5 Minimum input usage
We could investigate the case when the constraint does not impose an upper, but a lower bound for input material usage, the same way, as Eq. (2) describing the output amounts plus the following constraint.
We suppose \( \lambda_{i} \ge 0 \), so each input actually contribute to reach the minimum goal of \( C_{min} \), or is independent of it if \( \lambda_{i} = 0 \). This can be a real-world case where the owner of a furnace is somehow obliged to consume some input materials for example by law, regulation or contract, and this restriction is not implicitly achieved elsewhere.
The solution is that now we can introduce a product material node in the P-Graph, which is produced as outputs by the operating unit nodes for each individual input, in the corresponding \( \lambda_{i} \) ratios (see Fig. 8). The new product shall be set a minimum demand of \( C_{min} \).

Modeling of minimum capacity for inputs utilized, independent of the output amount
Note that in this case, the product material node enforces the usage of at least one input method in the solution structures. This is a good behavior, because the constraint does not only have an effect on solutions for each solution structure, but affect the structures themselves. Cases where the input materials are not used are infeasible because of \( C_{min} \) and are eliminated early by the MSG algorithm.
4.6 Ratio constraints
So far only such constraints were investigated where there was one constant term present, implying either a minimum or a maximum. If it is not the case, then each amount appears in either side of the inequality as a linear term with a positive coefficient. This means the constraint in general is similar to the following.
There \( \lambda_{i} \) are all positive, and \( L \) and \( R \) are disjoint index sets. Note that any linear inequality without a constant term can be arranged to such a form. There is no point in having any material amount present at both sides. Also, because of all material amounts being nonnegative, such a constraint makes sense only if there are terms at both sides. One important property of such constraints is that all material amounts can be simultaneously scaled, that is, multiplied by the same positive constant factor, and it does not change whether the constraint is fulfilled or not. For this reason we call Inequality (5) as ratio constraint throughout this work, because only the ratio of the amounts is important.
Many ratio constraints at the same time can be present to describe what compositions of input materials are valid for an operation. A practical example for a ratio constraint is the burning of wood together with coal in a coal furnace. A coal furnace is designed to handle coal but wood can be used for a certain degree. If the limit is overstepped special maintenance is needed. A ratio constraint can make sure that, for example, at most 20% wood can be used and the rest must be coal.
4.7 Convex sums
One candidate in modeling ratio constraints is the application of convex sums. This is a method that focuses on implementing multiple ratio constraints at the same time. We still assume that the constraints are linear, which makes the set of possible compositions a convex polytope in \( {\mathbb{R}}^{n} \) for \( n \) input materials. The idea is that we can define a set of vectors that are edge cases, so that any possible composition can be obtained as a convex sum of these vectors. A convex sum is a sum with nonnegative coefficients. Without providing the general method for this, we show two examples.
Suppose that there are two input materials, \( A_{1} \) and \( A_{2} \), and it is a constraint that none of the input materials can contribute to more than 80% of the total inputs. This can be a possible real-world scenario for any of the mentioned examples so far, as relying too much on a single source would impose a risk. If \( x_{1} \) and \( x_{2} \) are the used amounts, then the two constraints are \( x_{1} \le 0.8\left( {x_{1} + x_{2} } \right) \) and \( x_{2} \le 0.8\left( {x_{2} + x_{1} } \right) \). These can be simplified to ratio constraints \( x_{1} \le 4x_{2} \) and \( x_{2} \le 4x_{1} \) respectively. Now instead of modeling these constraints independently, consider these as edge cases: \( 1 \) unit of \( A_{1} \) and \( 4 \) units of \( A_{2} \) is the first vector, \( \left( {1,4} \right) \), and \( 4 \) units of \( A_{1} \) and \( 1 \) unit of \( A_{2} \) is the second, \( \left( {4,1} \right) \). The observation is that any feasible \( \left( {x_{1} ,x_{2} } \right) \) can be expressed as a convex sum of \( \left( {1,4} \right) \) and \( \left( {4,1} \right) \). Without providing a precise proof, the reason is that the possible ratios are on a segment in \( {\mathbb{R}}^{2} \) ending in \( \left( {\frac{1}{5},\frac{4}{5}} \right) \) and \( \left( {\frac{4}{5},\frac{1}{5}} \right) \), and each point on a segment can be obtained as a weighted average of its endpoints.
This makes modeling with P-Graph possible with only a few nodes (see Fig. 9). The two extreme cases can be modeled with an operating unit node each. Output(s) can always be assigned for each of the introduced operating units because it is a linear function of input amounts, so it is also a linear function of the vectors used.

Application of the convex sums method for modeling an 80% capacity constraint for both inputs at the same time
Note that if the complex operation is not used in a solution structure, then operating unit nodes are all omitted. If it is used, then for the two edge cases, there is one possible structure: the one containing only the operating unit for that particular extreme case. Non-extreme ratios require both operating units. So in this case, there is no much redundancy in the model.
However, one drawback of this convex sum method is that the number of extreme cases can be large, and then a high level of redundancy is introduced structurally in the model. Consider the case when there are three materials \( A_{1} \), \( A_{2} \), \( A_{3} \), and none of them can be over 70%, which is only a slightly larger problem. The edge case vectors are \( \left( {7,3,0} \right) \), \( \left( {7,0,3} \right) \), \( \left( {3,7,0} \right) \), \( \left( {0,7,3} \right) \), \( \left( {3,0,7} \right) \), \( \left( {0,3,7} \right) \), and the design requires six operating units (see Fig. 10).

Application of the convex sums method for modeling a 70% capacity constraint for three inputs at the same time
However, in this case, any three of the edge case vectors may be used to compose a given non-edge ratio, that gives rise to \( \left( {\begin{array}{*{20}c} 6 \\ 3 \\ \end{array} } \right) = 20 \) different solution structures. Moreover, composition of a non-edge ratio of edge cases can be ambiguous, more than three edge cases can be used. So this design contains a lot of redundancy, even structurally. Therefore, it is not advisable to use convex sums, only in very simple situations like the first case with two inputs only.
4.8 Individual ratio constraints
Instead of using convex sums, a single ratio constraint can be implemented at a time. For now, we suppose again that for each input material, its own operating unit node is already introduced, the operation volume of which represents the amount of input material consumed. We have also seen how to implement lower and upper bound constraints into this design. Now suppose we have a ratio constraint as before, in Inequality (5).
Now the left-hand side (LHS) and right-hand side (RHS) can be considered as two distinct logical materials and be connected as follows (see Fig. 11).

Modeling operation with four independent inputs, and an added example constraint of \( \lambda_{1} x_{1} + \lambda_{3} x_{3} \le \lambda_{2} x_{2} + \lambda_{4} x_{4} \). This is the long version
-
The LHS is consumed by the input operating units, for each \( A_{i} \) in \( \lambda_{i} \) ratio. This ensures that there must be sufficient amount of the logical material for the LHS present.
-
The RHS is produced by the input operating units, for each \( A_{i} \) in \( \lambda_{i} \) ratio. This ensures that there are the amounts of the RHS material produced in the actual value of the RHS of the constraint.
-
The two logical material nodes are connected by a logical operating unit that consumes the RHS and produces the LHS, in a \( 1{:}1 \) ratio. This completes a loop of logical material flow from the operating units introduced for the input materials, ending in themselves.
Observe that by the material flow, the RHS of the constraint is the only source of the logical material for the LHS, which is consumed in the exact amount of the LHS. Therefore, the introduced parts of the P-Graph ensure that the constraints are always true, but it also allows full freedom beyond this, because not all of the logical RHS material is required to be consumed. One property of ratio constraints is that all the \( \lambda_{i} \) flow ratios associated with the arcs can be scaled by any positive factor.
This design allows us to implement some additional features. For example, a fixed cost can be introduced to the logical operating unit, which would reflect additional costs. However, if this is not needed, the design can be simplified into a single material node as follows. The two logical materials and the logical operating units are merged into a single logical material for the constraint (see Fig. 12).

Modeling operation with four independent inputs, and an added example constraint of \( \lambda_{1} x_{1} + \lambda_{3} x_{3} \le \lambda_{2} x_{2} + \lambda_{4} x_{4} \). This is the simplified version with a single material node for the constraint
Note that there are arcs from the logical material from and to the operating units of the inputs if those inputs appear in the right and left hand side of the constraints, respectively.
If we investigate any of the two designs in terms of solution structures, we can observe that the usage of any input material present in the LHS of the constraint forces the logical material node for the constraint to be included in the solution structure, which also forces at least one of the input materials present in the RHS to be produced in the solution structure. This is again a good behavior, as infeasible solutions are structurally excluded, namely where some LHS materials are present, but RHS materials are not at all.
One drawback of modeling flexible inputs shall be mentioned. The introduced logical nodes and operating units, if visible, may severely affect the readability of the graphical representation of the resulting P-Graph. This should be kept in mind, because one benefit of using the P-Graph framework over MILP models is the easier readability, especially for decision makers not familiar with optimization tools.
4.9 General constraints
So far examples were presented for constant terms, but only with linear terms on one side of the constraint. Ratio constraints were also treated, where there are no constant terms but linear terms at both sides. Now we can conclude the methods for the most general case of constraints, which is the following.
Note that here \( C_{min} \) and \( C_{max} \) are positive constants, but for the sake of simplicity we may assume that at least one of them is zero. We also assume that the constraint is not trivially redundant or cause an infeasibility of the whole operation. The starting point is the case of independent inputs, where an operating unit for each input material \( A_{i} \) is already introduced, with unit consumption ratio from \( A_{i} \) and corresponding output ratio to the output material. The method for modeling with P-Graphs is the following.
-
If \( C_{min} \) is present, introduce a logical material node as a product node in the P-Graph, with \( C_{min} \) as its minimum demand.
-
If \( C_{max} \) is present, introduce a logical material node as an intermediate material, and a logical operating unit which outputs the logical material in a maximum amount of \( C_{max} \).
-
If neither \( C_{min} \) nor \( C_{max} \) are present, introduce a single logical material node for the constraint.
-
If an input material is present in the LHS of the constraint, add the logical material node as an input to the individual operating unit node introduced for that particular input material, with a \( \lambda_{i} \) ratio.
-
If an input material is present in the RHS of the constraint, add the logical material node as an output from the individual operating unit node introduced for that particular input material, again with a \( \lambda_{i} \) ratio.
The importance of a logical operating unit introduced is that it can have parameters supported by PNS software. For example, fixed and proportional investment and operating costs based on operating unit capacity can be provided, which makes \( C_{max} \) not only a constant but a tunable model variable.
So far we assumed there is a single output material. However, it does not matter how many outputs are there, as each can be modeled the same way. Produced amounts depend directly and linearly on the input materials used, the formula is \( y = \mathop \sum \nolimits_{i = 1}^{n} v_{i} x_{i} \). This can be implemented easily, the material node for the output must be connected to each of the operating unit nodes introduced for input materials \( A_{i} \) with the corresponding ratio of \( v_{i} \). The same procedure must be repeated if there are multiple output materials.
5 Case study
We now demonstrate the general method of modeling flexible input materials in a case study of the sustainable energy supply of a manufacturing plant.
The plant has indoors heating and electricity demands throughout the year, which are originally bought from the public service provider. Decision makers considered the investment into the usage of renewable energy sources to improve energy efficiency of the plant, and achieve an overall reduction of annual costs in the long term.
Considered alternatives for a sustainable energy supply are solar (photovoltaic) power plant for electricity and possibly heat production, biogas combined heat and power (CHP) plant and biogas furnace based on seven different sources: corn cobs, energy grass, wood, saw dust, wood chips, sunflower stem and vine stem (see Table 1). The former four of these seven types of biomass are needed to be pelletized first which implies an investment into a pelletizer machine. The pellets and other biomass can be fed into a biogas plant producing biogas, which is then used for producing heat and power. Altogether, there are five possible investments into equipment (see Table 2). The business as usual solution, which is purchasing gas from the service provider and burn it in a furnace, and purchasing electricity from the grid, are also kept in the model as possibilities.
This scenario had been studied for single-periodic (Éles et al. 2018), and extended for multi-periodic demands (Éles et al. 2019), as a PNS problem modeled and optimized by the P-Graph framework. The importance of this study is that the pelletizer and the biogas plant units have flexible inputs. One additional constraint is included in the scenario and the PNS model is resolved with the P-Graph framework in the present case study, while flexible input implementations are examined. These models were all implemented in P-Graph Studio v5.2, and solved by the ABB algorithm, on a Lenovo Y50-70 computer with Intel i7-4720HQ CPU and 8 GB RAM.
The most straightforward P-Graph model for the case study is shown in Fig. 13. Both the biogas plant and the pelletizer are already modeled with the independent inputs method. However, as equipment capacities are also modeling variables, the output capacities method was also used. The biomass types are immediately converted to heating powers in the modeling point of view by their respective operating units, and therefore the capacity constraints are expressed in terms of total heating power.

Most straightforward P-Graph model for the case study, working by implementation of completely independent inputs, and output capacity for both the pelletizer and the biogas plant
The more adequate modeling requires that the biomass input capacities are expressed in terms of their total mass instead of heating power. This requires a unique input capacity constraint, and is done by the proposed method (see Fig. 14). A logical capacity material node and a logical operating unit producing this capacity material are introduced for both units. The logical operating unit has the data of the modeled equipment associated with it, namely fixed and proportional operating costs. This is a case when the upper bound \( C_{max} \) is itself a modeling variable, because the P-Graph Studio software supports the capacity of the operating unit to be scaled, and have a proportional cost.

Independent input capacities implemented for both the biogas plant and the pelletizer. Note that the implementations are done jointly for the two equipment units, resulting in only seven inputs for both equipment units in total
This scenario has a specialty which is apparent at the P-Graph. That is, the outputs of the pelletizer, which are the different types of pellets, have only one usage: being fed into the biogas plant. For this reason, those four input materials of the biogas plant are merged with the four output materials of the pelletizer, which results in a single operating unit node for each biomass type, for both equipment units at the same time. Note that the investment and operating costs are implemented at the logical capacity production operating units in the PNS problem. The product of the biogas plant (or the pelletizer and then the biogas plant) is biogas expressed in terms of heating value for all seven types of biomass.
This model is extended by an additional constraint for demonstration purposes. For safety reasons, it was a request from the management that the sustainable energy supply should not rely strongly on a single source of energy. One possible mitigation for this risk is when the ordinary methods of purchasing gas and electricity from the grid are still present in the PNS. However, another method is to explicitly declare constraints. Now we introduce a constraint about the biomass composition. In the optimal solution for the model without the constraint, it turned out that 72% of the input amounts, in total mass, are energy grass. Hence we introduce a constraint that maximizes the composition of energy grass in 70% of total, and 50% of total biomass used, respectively. This procedure results in 3 models including the original, which we implemented, tested, and compared.
Consider the 70% ratio constraint which can be described and then arranged as follows.
If the maximal contribution of energy grass to input masses is modified to 50%, the constraint is modified to the following. Any maximum value could be implemented.
According to the general model for ratio constraints, the capacity for energy grass can be implemented as a single logical material node (see Fig. 15). It is an input to the operating unit nodes for all six types of biomass, except energy grass, which is an output. In case of the 70% limit, the flow rate for the energy grass is 3, and for all other biomass types it is 7. In case of the 50% limit, the flow rates are all 1.

Model of the case study with the additional constraint maximizing energy grass usage relative to other biomass types. Flow rates of the arcs depend on the maximum amount allowed
Note that with the constraint, each solution structure containing energy grass production must contain at least one of the other six biomass types as well, due to the introduced logical material node of the constraint.
We can compare the optimal solutions of the three cases, for the best solution structures (see Table 3). The optimal solution in all three cases rely on the Biogas CHP plant with the required Biogas plant to operate, but not the pelletizer, and the rest of the required electricity to be purchased from the grid. This gives an annual cost of 220.709 M HUF. For the following solutions, either a pelletizer, or a solar power plant investment is required, this causes the jump in the objective values.
We can observe that the solutions slightly worsen as the constraint is becoming stricter. Using energy grass is still the most beneficial way of producing energy from biomass, however the limits force the input amounts of other types of biomass to increase, in other solution structures as well (see Fig. 16).

Solution structures of the case study with the energy grass maximizing constraint added. a Optimal solution structure for all three cases, with different objective values. b Example solution structure involving other biomass types. A pelletizer is needed in this case
The slight differences between the objective values are due to the fact that solution structures #2–#9 in all three cases vary mostly in the biomass type used, which is a smaller factor than equipment costs. Possible errors in the estimation of material costs therefore have a larger impact on the optimal structures than the actual objective values. Equipment costs are more significant. However, it just turns out that using either a pelletizer or a solar power plant in addition results in roughly the same objective as well.
Results show that utilizing local biomass can be financially beneficial in the long term for the manufacturing plant. The model adequately represents the pelletizer and biogas plant technologies to handle flexible inputs, and we can also include additional constraints. The P-Graph methodology is capable of evaluating energy supply scenarios, provided that costs can be estimated and modeled with fixed and proportional components. Decision making is further supported by reporting near-optimal solution structures which can be manually investigated to discover alternatives.
Note that a very long payback period of 20 years is considered for the investments. If a shorter payback period of 5 years is assumed, which is still considered long term in practice for investments, then the business as usual solution outperforms any kinds of investment strategies. The business as usual solution is the same solution structure in all scenarios, which uses the existing furnace for gas purchased and electricity is also obtained from the grid. In short, investment into solar and biomass energy supplies is beneficial in the long term, if the options and costs in the case study are assumed.
6 Conclusions
A general method was presented to adequately model operations with flexible inputs in the P-Graph framework. The most important fact is that no external tools or modifications are used, only ordinary material and operating unit nodes. Therefore, the whole algorithmic framework designed upon P-Graphs can be directly applied on our modeling methods. Note that although the terminology uses the terms materials and operating units in a P-Graph, a wide range of optimization problems can also be modeled, including heat-exchanger network synthesis, separation network synthesis, scheduling, storage and transportation optimization problems.
Several cases for complex operations with flexible inputs were presented here from simpler to more complicated ones. The first case was the completely independent input materials. The main idea at this step was the introduction of individual operating unit nodes for each input material, which is a design utilized for the other cases as well. Later, a total output limit was added. We also described how individual limits on the total inputs independent of the total output can be implemented, for both lower and upper limits. These required the introduction of logical intermediate material and operating unit nodes, or a product node based on being an upper or lower bound, respectively.
Ratio constraints, where only the ratios of input materials are constrained, are also investigated. Expressing an arbitrary ratio with a convex sum of some predefined compositions is an elegant modeling tool for small cases, but turned out to have undesirable difficulties and redundancy for several inputs and complex search spaces. Instead, the introduction of a single logical material node was proposed to implement an arbitrary linear ratio constraint.
Finally, a guide is established for modeling the general case for operations with flexible inputs, provided that certain assumptions can be made, for example linearity. The mentioned constraints are proven to be applicable in parallel, independent of each other in the same P-Graph model. Similarly to constraints, multiple different outputs of the operation can be provided. We also examined how the model affects solution structures of the PNS problem, and found that the proposed methods either do not introduce unwanted redundancy into the model, or even excludes some solution structures that are infeasible. This is a strong advantage, because the basic combinatorial algorithms MSG and SSG are also enhanced by the new circumstances.
The usability of the flexible input modeling tools is demonstrated on a case study. Energy supplies often rely on a variety of sources, therefore input compositions are rarely fixed a priori. This is especially true for biomass and renewables. Therefore, sustainable energy supply problems are a good example for operations with flexible input material ratios. If modeled and optimized using the P-Graph framework, the proposed modeling techniques can be directly used. In the study, mass-based capacity constraints were implemented for the pelletizer and biogas plant equipment units, which are independent of the energy output. Also, the contribution of energy grass to the total usage was limited, which demonstrates how ratio constraints can be implemented.
The tools provided here could be of good use in future applications, when P-Graph models are used for PNS problems. There is still work to be made to describe modeling tools for other operations, or possibly give alternative solutions for already described methods. These research directions could also pinpoint possible new features in the P-Graph Studio to be implemented.
References
Aviso KB, Tan RR (2018) Fuzzy P-Graph for optimal synthesis of cogeneration and trigeneration systems. Energy 154:258–268
Aviso KB, Lee JY, Dulatre JC, Madria VR, Okusa J, Tan RR (2017) A P-Graph model for multi-period optimization of sustainable energy systems. J Clean Prod 161:1338–1351
Aviso KB, Belmonte BA, Benjamin MFD, Arogo JIA, Coronel ALO, Janairo CMJ, Foo DCY, Tan RR (2019a) Synthesis of optimal and near-optimal biochar-based carbon management networks with P-Graph. J Clean Prod 214:893–901
Aviso KB, Chiu ASF, Demeterio FPA III, Lucas RIG, Tseng ML, Tan RR (2019b) Optimal human resource planning with P-graph for universities undergoing transition. J Clean Prod 224:811–822
Barany M, Bertok B, Kovacs Z, Friedler F, Fan LT (2011) Solving vehicle assignment problems by process-network synthesis to minimize cost and environmental impact of transportation. Clean Technol Environ 13:637–642
Bartos A, Bertok B (2018) Parameter tuning for a cooperative parallel implementation of process-network synthesis algorithms. Cent Eur J Oper Res 27:551
Bartos A, Bertok B (2019) Production line balancing by P-Graphs. Optim Eng 21:567–584
Benjamin MFD (2018) Multi-disruption criticality analysis in bioenergy-based eco-industrial parks via the P-Graph approach. J Clean Prod 186:325–334
Bertok B, Bartos A (2018) Algorithmic process synthesis and optimisation for multiple time periods including waste treatment: latest developments in P-Graph studio software. Chem Eng Trans 70:97–102
Cabezas H, Heckl I, Bertok B, Friedler F (2015) Use the P-Graph framework to design supply chains for sustainability. Chem Eng Prog 111:41–47
Cabezas H, Argoti A, Friedler F, Mizsey P, Pimentel J (2018) Design and engineering of sustainable process systems and supply chains by the P-Graph framework. Environ Prog 37:624–636
Éles A, Halász L, Heckl I, Cabezas H (2018) Energy consumption optimization of a manufacturing plant by the application of the P-Graph framework. Chem Eng Trans 70:1783–1788
Éles A, Halász L, Heckl I, Cabezas H (2019) Evaluation of the energy supply options of a manufacturing plant by the application of the P-Graph framework. Energies 12:1484
Friedler F, Tarjan K, Huang YW, Fan LT (1992) Graph-theoretic approach to process synthesis: axioms and theorems. Chem Eng Sci 47:1973–1988
Friedler F, Tarjan K, Huang YW, Fan LT (1993) Graph-theoretic approach to process synthesis: polynomial algorithm for the maximal structure generation. Comput Chem Eng 17:929–942
Friedler F, Varga BJ, Fan LT (1995) Decision-mapping: a tool for consistent and complete decisions in process synthesis. Chem Eng Sci 50:1755–1768
Friedler F, Varga BJ, Fehér E, Fan LT (1996) Combinatorially accelerated branch-and-bound method for solving the MIP model of process network synthesis. In: Floudas CA, Pardalos PM (eds) State of the art in global optimization. Kluwer Academic Publishers, Dordrecht, pp 609–626
Frits M, Bertok B (2014) Process scheduling by synthesizing time constrained process-networks. Comput Aided Chem Eng 33:1345–1350
Heckl I, Friedler F, Fan LT (2010) Solution of separation-network synthesis problems by the P-Graph methodology. Comput Chem Eng 34:700–706
Heckl I, Halasz L, Szlama A, Cabezas H, Friedler F (2015) Process synthesis involving multi-period operations by the P-Graph framework. Comput Chem Eng 83:157–164
How BS, Hong BH, Lam HL, Friedler F (2016) Synthesis of multiple biomass corridor via decomposition approach: a P-Graph application. J Clean Prod 130:45–57
How BS, Yeoh TT, Tan TK, Chong HK, Ganga D, Lam HL (2018) Debottlenecking of sustainability performance for integrated biomass supply chain: P-Graph approach. J Clean Prod 193:720–733
International Energy Agency (2019) Electricity statistics. www.iea.org/statistics/electricity. Accessed 20 Feb 2019
Kalaitzidou MA, Georgiadis MC, Kopanos GM (2016) A general representation for the modeling of energy supply chains. Comput Aided Chem Eng 38:781–786
Kalauz K, Süle Z, Bertok B, Friedler F, Fan LT (2012) Extending process-network synthesis algorithms with time bounds for supply network design. Chem Eng Trans 29:259–264
Klemeš JJ, Varbanov P (2015) Spreading the message: P-Graph enhancements: implementations and applications. Chem Eng Trans 45:1333–1338
Lam HL (2013) Extended P-Graph applications in supply chain and process network synthesis. Curr Opin Chem Eng 2:475–486
Lam HL, Varbanov P, Klemeš JJ (2010) Optimisation of regional energy supply chains utilising renewables: P-Graph approach. Comput Chem Eng 34:782–792
Lam HL, Tan RR, Aviso KB (2016) Implementation of P-Graph modules in undergraduate chemical engineering degree programs: experiences in Malaysia and the Philippines. J Clean Prod 136:254–265
Lam HL, Chong KH, Tan TK, Ponniah GD, Tin YT, How BS (2017) Debottlenecking of the integrated biomass network with sustainability index. Chem Eng Trans 61:1615–1620
Lan J, Malik A, Lenzen M, McBain D, Kanemoto K (2016) A structural decomposition analysis of global energy footprints. Appl Energ 163:436–451
Nemet A, Klemeš JJ, Duić N, Yan J (2016) Improving sustainability development in energy planning and optimisation. Appl Energy 184:1241–1245
Okusa JS, Dulatre JCR, Madria VRF, Aviso KB, Tan RR (2016) P-Graph approach to optimization of polygeneration systems under uncertainty. In: Proceedings of the DLSU research congress, Manila, Philippines, 7–9 March 2016
Orosz A, Kovacs Z, Frieder F (2018) Processing systems synthesis with embedded reliability consideration. Comput Aided Chem Eng 43:869–874
P-Graph Studio (2019) www.pgraph.org. Accessed 31 Jan 2019
Promentilla MAB, Lucas RIG, Aviso KB, Tan RR (2017) Problem-based learning of process systems engineering and process integration concepts with metacognitive strategies: the case of P-Graphs for polygeneration systems. Appl Therm Eng 127:1317–1325
Saavedra MR, Fontes CHO, Freires FGM (2018) Sustainable and renewable energy supply chain: a system dynamics overview. Renew Sustain Energy Rev 82:247–259
Süle Z, Baumgartner J, Gy D, Abonyi J (2019) P-graph-based multi-objective risk analysis and redundancy allocation in safety-critical energy systems. Energy 179:989–1003
Szlama A, Heckl I, Cabezas H (2016) Optimal design of renewable energy systems with flexible inputs and outputs using the P-Graph framework. AIChE J 62:1143–1153
Tan RR, Cayamanda CD, Aviso KB (2014) P-Graph approach to optimal operational adjustment in polygeneration plants under conditions of process inoperability. Appl Energy 135:402–406
Tan RR, Aviso KB, Foo DCY (2017) P-Graph and Monte Carlo simulation approach to planning carbon management networks. Comput Chem Eng 106:872–882
US Energy Information Administration (2018) First use of energy for all purposes (fuel and nonfuel). www.eia.gov/consumption/manufacturing/data/2010/pdf/Table1_1.pdf. Accessed 16 Mar 2018
Vance L, Heckl I, Bertok B, Cabezas H, Friedler F (2015) Designing sustainable energy supply chains by the P-Graph method for minimal cost, environmental burden, energy resources input. J Clean Prod 94:144–154
Varga V, Heckl I, Friedler F, Fan LT (2010) PNS solutions: a P-Graph based programming framework for process network synthesis. Chem Eng Trans 21:1387–1392
Worldwatch Institute (2018) The state of consumption today. www.worldwatch.org/node/810. Accessed 16 Mar 2018
Acknowledgements
Open access funding provided by University of Pannonia (PE). We acknowledge the financial support of Széchenyi 2020 programme under the Project No. EFOP-3.6.1-16-2016-00015. This research was supported from the Thematic Excellence Program 2019 the Grant of the Hungarian Ministry for Innovation and Technology. (Grant Number: NKFIH-843-10/2019).
Author information
Authors and Affiliations
Corresponding author
Ethics declarations
Conflict of interest
The authors declare that they have no conflict of interest.
Additional information
Publisher's Note
Springer Nature remains neutral with regard to jurisdictional claims in published maps and institutional affiliations.
Rights and permissions
Open Access This article is licensed under a Creative Commons Attribution 4.0 International License, which permits use, sharing, adaptation, distribution and reproduction in any medium or format, as long as you give appropriate credit to the original author(s) and the source, provide a link to the Creative Commons licence, and indicate if changes were made. The images or other third party material in this article are included in the article's Creative Commons licence, unless indicated otherwise in a credit line to the material. If material is not included in the article's Creative Commons licence and your intended use is not permitted by statutory regulation or exceeds the permitted use, you will need to obtain permission directly from the copyright holder. To view a copy of this licence, visit http://creativecommons.org/licenses/by/4.0/.
About this article

Cite this article
Éles, A., Heckl, I. & Cabezas, H. Modeling technique in the P-Graph framework for operating units with flexible input ratios. Cent Eur J Oper Res 29, 463–489 (2021). https://doi.org/10.1007/s10100-020-00683-9
Published:
Issue Date:
DOI: https://doi.org/10.1007/s10100-020-00683-9