Abstract
Today’s nacelle test benches are facing several challenges regarding meeting the increasing demands of modern wind turbines, which have been growing rapidly in operational range, size, and complexity. These challenges include reproducing the demanded extreme loads, dynamic load bandwidth, power capacity, and cost of testing. This contribution presents a new testing approach to tackle some of the aforementioned challenges faced by existing nacelle test benches. The method is demonstrated in a case study involving experimental measurements and simulations of a multi-megawatt wind turbine drivetrain recently tested at the DyNaLab of Fraunhofer IWES. By combining high-fidelity simulation models and partial load tests, the proposed approach has shown high potential for representing the full load response of a wind turbine nacelle. The proposed testing methodology has potential for resolving some of the challenges being faced by modern test benches in terms of obtaining full load responses on a nacelle test bench with a possibility of reducing the cost of testing.
Zusammenfassung
Moderne Gondelprüfstände stehen vor umfangreichen Herausforderungen, um den rapiden steigenden Anforderungen moderner Windenergieanlagen hinsichtlich Leistung, Größe und Komplexität gerecht zu werden. Zu diesen Herausforderungen gehören die Nachbildung der erforderlichen Extremlasten, die Dynamik der Lasteinleitung, die Last- und Leistungskapazität sowie die Prüfkosten. In diesem Beitrag wird eine neue Prüfmethode vorgestellt, mit welcher einige dieser Herausforderungen für bestehende Gondelprüfstände gelöst werden können. Die Methode wird anhand einer Fallstudie demonstriert, welche auf experimentellen Messungen und Simulationen eines auf dem Gondelprüfstand DyNaLab des Fraunhofer IWES getesteten Antriebsstrangs einer Multi-Megawatt-Windenergieanlage basiert. Durch die Kombination von detaillierten Simulationsmodellen mit physikalischen Tests unter Teillast zeigt die vorgeschlagene Methode ein großes Potenzial zur korrekten Vorhersage des Verhaltens eines Antriebsstrangs unter Volllast. Die vorgeschlagene Prüfmethode hat das Potenzial, einige der Herausforderungen zu lösen, mit denen moderne Prüfstände konfrontiert sind, indem das Volllastverhalten des Prüflings auf einem Gondelprüfstand präzise vorhergesagt wird, während sie gleichzeitig die Möglichkeit bietet, Prüfkosten zu senken.
1 Introduction
The growth in wind power generation has maintained its rapid pace, as almost 94 GW of capacity were added in 2021 with a year-over-year growth of 12% [1]. In this growing industry, wind turbine manufacturers are competing to capture the greatest market share by developing reliable and cost-effective wind turbine systems [2, 3]. They strive for successful and rapid prototype testing to ensure the desired product reliability and a faster time to market. These objectives have led to significant advances toward the development of several full-scale nacelle testing facilities around the world [4]. Table 1 lists some of the typical tests that can be conducted on a nacelle test bench. These facilities have become an attractive method for testing, as they offer system-level testing capabilities for the complete nacelle with the goal of applying realistic loads that the nacelle will experience in field operation in a controlled and repeatable environment.
However, the fast-growing trend of wind turbine size and operational capacity has increased the demands on the existing nacelle testing facilities. Many of them are already (or will soon be) too small to provide the required set of operational loads for the growing demands of larger wind turbines. As wind turbine technology is evolving, the existing testing methods also need to adapt correspondingly. There has been a trend for establishing larger test benches with increased load application capabilities to accommodate the demands of larger wind turbines [5]. However, this continuous trend of constructing bigger nacelle test benches for larger wind turbines might not be a sustainable solution. Furthermore, accessing the established nacelle test facilities is already financially difficult for smaller manufacturers of wind turbines and currently only possible for the bigger ones [6]. Constructing even larger test benches with possibly higher test costs may leave very few wind turbine manufacturers with the financial means to utilize these facilities in their development process.
Therefore, innovations are needed to enhance the functionality of the existing nacelle test benches and maximize their use. Scaled testing offers a potential solution, as it is a widely used approach across several industries for resolving difficulties related to test capacity and specimen size. Efforts are being made in the INNTERESTING research project [7] to explore the innovative use of scaled tests to resolve the abovementioned challenges in wind turbine system testing. This project proposes an innovative testing approach where advanced simulation techniques are combined with scaled tests of drivetrain components. The models are developed and validated using scaled test results and then used to simulate the full-scale component response without requiring full-scale tests. However, the successful demonstration and the application scope for this approach are yet to be seen.
Another possible solution lies in the use of virtual testing, which has already seen application in almost every major industrial sector including the automotive [8,9,10,11], railway [12,13,14], and aerospace [15, 16] industries. Virtual testing forms a fundamental part of the development process in these industries, with the aim of either reducing the number of physical tests or pushing past the limits of physical testing. Although virtual testing of wind turbine drivetrains is rather new when compared with other industrial sectors, it has nevertheless demonstrated promising potential in several recent research studies [17,18,19,20,21,22,23,24,25,26,27]. The VirtGondel research project [28] at Fraunhofer IWES aims to advance the application of virtual testing further. The project proposes an innovative hybrid testing approach utilizing the virtual test bench model in combination with full-scale physical tests, which allows load ranges beyond the test bench capacity to be investigated. Unlike scaled testing, this approach removes the uncertainties that are inherent to a physical scaling of the test specimen.
This contribution presents this hybrid testing approach for emulating the full load response of a nacelle device under test (DUT). The detailed methodology will be explained in Sect. 2. The high-fidelity model is described in Sect. 3 along with the required model fidelity. Case studies performed to demonstrate the proposed hybrid testing methodology are presented in Sect. 4, followed by further discussion of the presented methodology in Sect. 5. The conclusion can be found in Sect. 6.
2 Hybrid nacelle test methodology
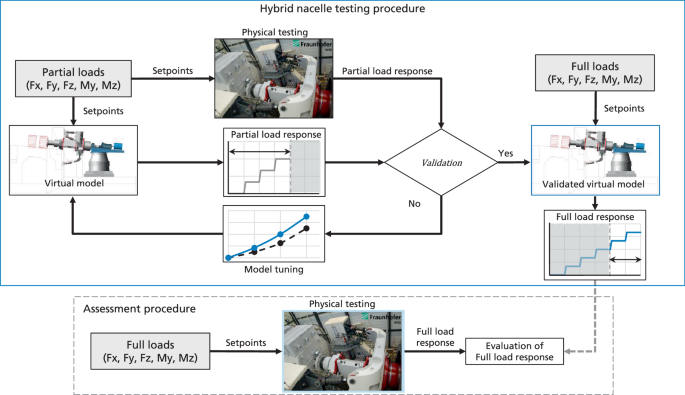
The proposed hybrid testing methodology for wind turbine nacelles is elaborated in Fig. 1 (represented inside the blue box). First, full-scale physical tests are conducted on a nacelle test bench at partial loads that are achievable within the load application capability of the test bench. Alongside these tests, virtual testing is performed for the same load regime. The measured DUT response at partial loads obtained from physical tests is compared against simulation results from virtual tests, and the virtual model is adapted as necessary to achieve the desired accuracy. Afterward, the validated virtual model is used to simulate the response of the DUT under full loads beyond the testing limits of the test bench.
Nacelle tests on a 5 MW GE Cypress platform conducted at the DyNaLab facility of Fraunhofer IWES were used to demonstrate the proposed hybrid testing method. The nacelle features a multi-stage geared high-speed drivetrain with three point suspension topology. The main shaft is connected with the test bench load application system (LAS) via a hub adapter. The entire nacelle system rests on the tower adapter at the yaw bearing interface. During testing, the yaw system is locked to restrict the nacelle motion in the yaw direction. From the list of nacelle tests mentioned in Table 1, the parasitic load tests have been chosen. The DyNaLab offers electrical and mechanical tests for a wind turbine nacelle of up to 10 MW power with the capability to apply up to 20 MNm bending moments and 2 MN forces at the hub interface. The virtual model of the nacelle is validated using only the partial load response obtained during the physical testing of the 5 MW nacelle. In this way, the capability of the validated virtual model to simulate the full load response can be evaluated using the available measurements from the physical tests conducted at full loads as shown in Fig. 1 (represented inside the gray dashed box).
3 Model description
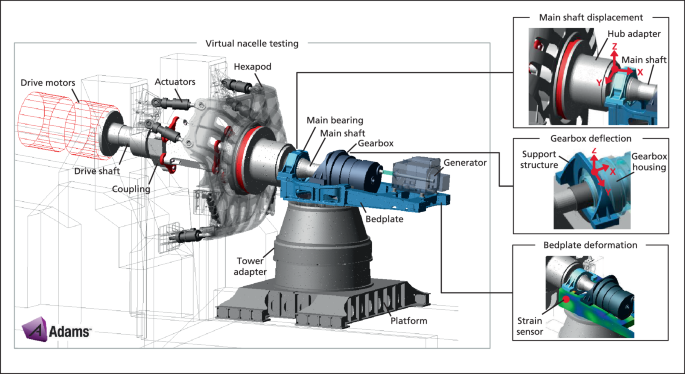
A high-fidelity multibody simulation (MBS) model of the test setup was developed in Adams [29]. The model serves as a virtual twin of the physical test setup, as it includes all the relevant components of the test bench load application system and the nacelle drivetrain to reproduce the functionality and response of the actual physical system. Fig. 2 shows the entire virtual testing setup and the measurement locations for the DUT response of interest. The test bench flange adapters, coupling, and drive shaft are modeled as flexible bodies created by modal reduction of their respective finite element (FE) models using Craig-Bampton component mode synthesis [30]. Further details of the test bench LAS model have been elaborated in [31]. The MBS model of the nacelle drivetrain was developed such that it fulfills the NREL recommendations for drive train MBS model fidelity [32]. However, some enhancements have been made with regard to bearing stiffness. Instead of using bushing elements with a constant stiffness matrix, nonlinear force elements were used with spline functions to represent the bearing movements for wider ranges of applied load correctly. Table 2 summarizes the implemented modeling approach for the global system model.
Fig. 2 also shows the three measurement locations for the evaluation of the desired DUT response, which were implemented during the physical testing of the DUT. The first one is the relative displacement between the main shaft and the bedplate. This is measured in the physical system using three laser sensors for the measurement of the relative displacements in axial (X), yaw (Y), and pitch (Z) directions. The second one is the relative displacement between the gearbox housing and the gearbox support structure. Multiple laser sensors are installed between these two components to measure the gearbox housing deflections relative to the support structure in axial, yaw, and pitch directions. The simulation model delivers the relative displacements at the same locations to provide a one-to-one match with the physical measurements. Lastly, the bedplate deformations are measured using strain gauges installed at a location of interest. These are directly compared with the modal strains extracted from the bedplate flexible body at the same location where the strain gauge is installed.
4 Case studies
To demonstrate the proposed hybrid testing methodology, parasitic load tests have been carried out in which the LAS system of the test bench applies the following unidirectional loads on the drivetrain:
-
Pitch forces
-
Yaw forces
-
Axial forces
-
Pitch moments
-
Yaw moments
In each of these tests, loads are applied individually at the hub interface with a stepped profile of increasing amplitude. As discussed in Sect. 2, model validation and tuning using the results from partial load tests is a fundamental part of the proposed hybrid testing approach. However, performing the necessary tuning of model parameters to improve the error of a particular system response should not be detrimental to the remaining ones, since model parameters are very likely to have an influence on multiple system responses. It is vital to identify the influence of model parameters on the DUT responses first. Therefore, a sensitivity study is conducted by changing model parameters individually and comparing the changes in the response of interest. The findings are used as a reference during the model validation at partial loads for each of the unidirectional load cases.
4.1 Sensitivity study
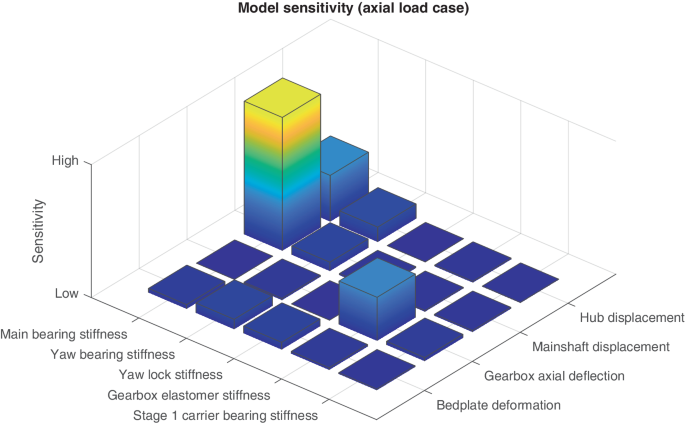
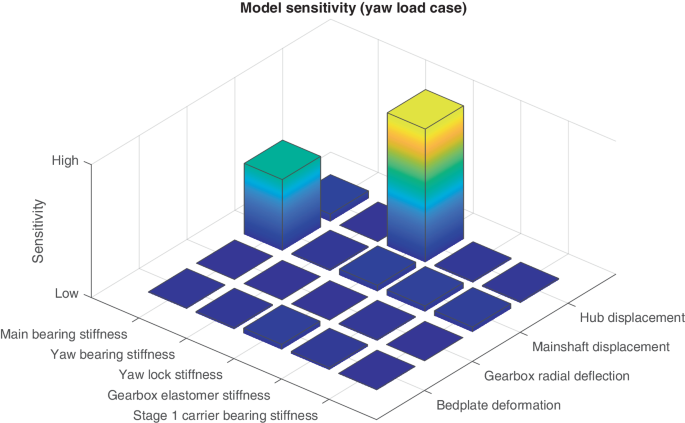
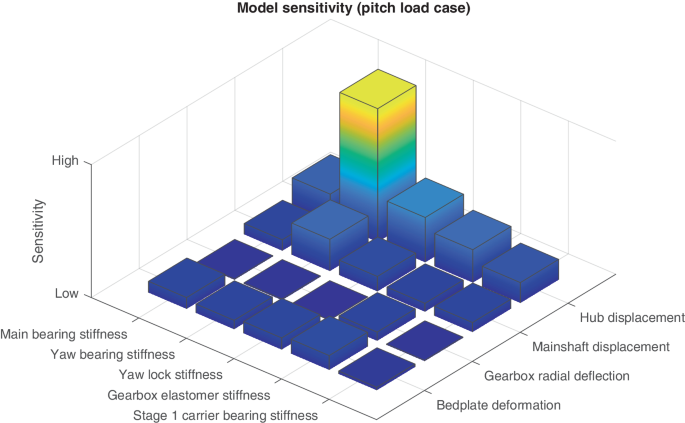
The model parameters under study are the main bearing stiffness, the yaw bearing stiffness, the stiffness of the yaw lock system, the stiffness of the planet carrier bearing (stage 1), and the elastomer stiffness of the bolted connections between the gearbox housing flange and the gearbox support structure. These parameters are independently changed by a fixed percentage while keeping the remaining parameters unchanged. The results of the sensitivity study are plotted in Figs. 3–5. The exact values of percentage change in response due to the parameter change are not shown for reasons of confidentiality. Instead, the percentage change is plotted in the vertical axis as a qualitative sensitivity measure with an upper limit (high) representing larger differences in response due to parameter change and a lower limit (low) representing no noticeable differences in response. Several interdependencies can be observed between some model parameters and the drivetrain response.
It is important to mention that, even though the main shaft is directly connected to the hub adapter, the displacement measurements of the two components have a key difference: the hub displacement measures the global movement of the hub relative to the stationary reference point on the ground, while the main shaft displacement is the relative motion between the main shaft and the bedplate. The stiffness of the main bearing has a direct influence on the displacement of the main shaft and the hub. It also has a noticeable effect on the strain readings at the strain gauge location on the bedplate for the pitch loads. The yaw bearing shows a higher influence on the hub displacement for the pitch loads as well as a noticeable effect on the bedplate strain readings and the main shaft displacement. The stiffness of the yaw locks strongly influences the hub displacements in the yaw direction and has some noticeable influence in the pitch direction. The gearbox elastomer stiffness has a stronger influence on the gearbox housing deflection for axial loads and shows some noticeable influence on several system responses for pitch loads. The bearing stiffness of the first stage planet carrier shows noticeable influence on the main shaft displacement and hub displacement for the pitch load case. These findings are used as a reference for the parameter tuning and model validation under partial loads.
4.2 Response under pitch forces
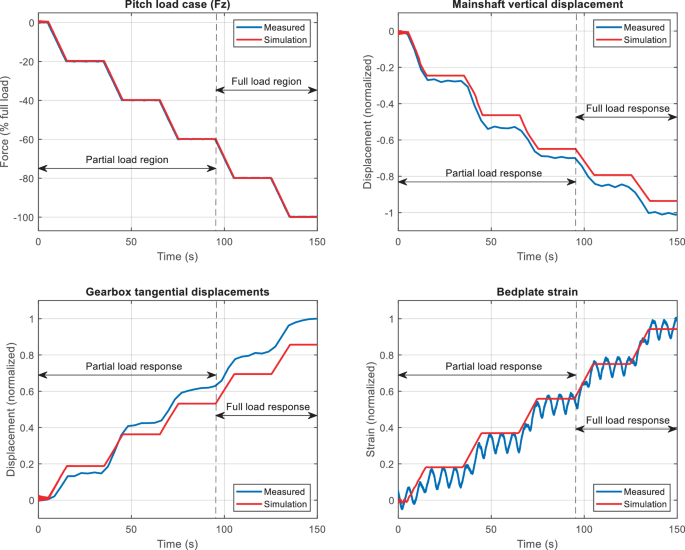
Fig. 6 shows the results for applied pitch loads. The DUT response corresponding to the partial loads and full load regions is separated by a vertical dashed line. The measured response at partial loads (i.e., below 60% load range) is used for model tuning with the objective of minimizing the error. This tuned model then simulates the response for extrapolated full loads (i.e., above 60% load range) shown on the right side of the vertical dashed line. The measured responses for all load ranges are also plotted for evaluation purposes. The relative error of the main shaft vertical displacement, although high in the 20–40% load regions, remains below 7% in the 60% load region and reduces significantly in the full load region. The reason for the higher relative error in the lower load regions could be linked to the higher nonlinearity in the stiffness of the main bearing at lower loads, due to which minor deviation of the modeled nonlinear stiffness curve from the real behavior can lead to higher uncertainties in response. The gearbox tangential deflection shows sufficient correlation with the measured results with the relative error remaining below 15% in the full load region. The simulated bedplate strain, although having a higher relative error in the partial load region, shows good correlation with the measured strain in the full load region with less than 3% relative error. The strain sensors installed on the bedplate also captured the oscillations corresponding to the main shaft rotation frequency. This is the reason for the noticeable oscillations in the bedplate strain measurements. These oscillations are not visible in the displacement measurements as those signals included filtering.
4.3 Response under yaw forces
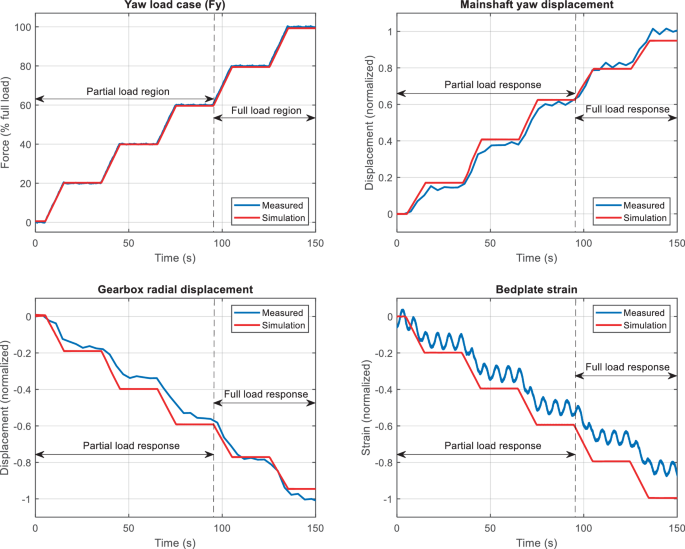
Fig. 7 shows the case of yaw loads applied at the hub interface and the corresponding drivetrain response. The main shaft displacement in the yaw direction and gearbox radial deflection show a slight error in the partial load region but good agreement of the full load displacement response with the relative error remaining below 7%. However, the bedplate strain shows higher differences with a maximum relative error of 20% in the full load range.
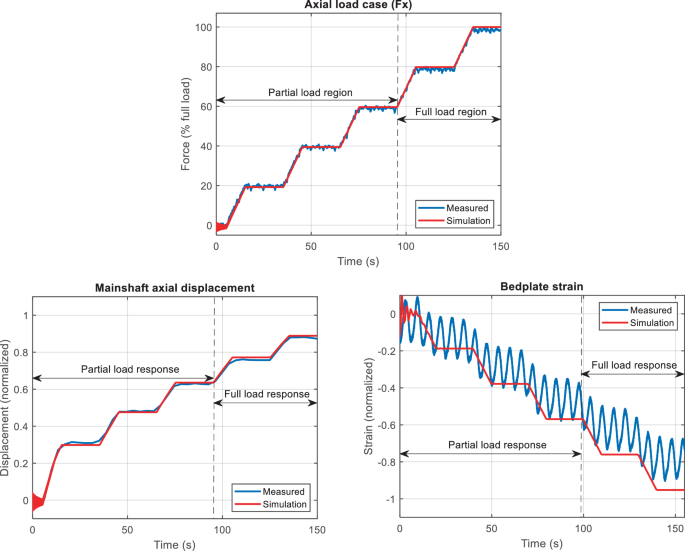
4.4 Response under axial forces
For the axial load case, the main shaft axial displacement and the bedplate strain are compared and plotted in Fig. 8. Due to the type of drivetrain topology, axial deflections of the gearbox housing did not occur in the discussed load regime and, therefore, are not included for this load case. The main shaft displacement results show good correlation with the measured values, with errors remaining below 4% in all load regions. The simulated bedplate strain follows the measured strain trajectory with a maximum relative error of 20% in the full load range.
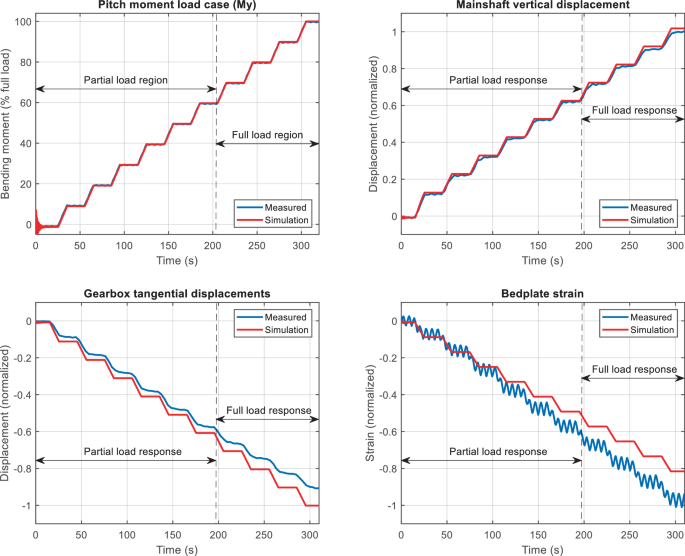
4.5 Response under pitch moments
Fig. 9 shows the case for applied pitch moments and the corresponding response. Very good agreement can be observed for the main shaft pitch displacement with the maximum relative error below 7% in full load response. The relative error in gearbox tangential deflection remains mostly very low until 75% load levels and below 12% in the full load range. The bedplate strain shows very good agreement in the partial load region with the error building up in the full load region but remaining just above 15%.
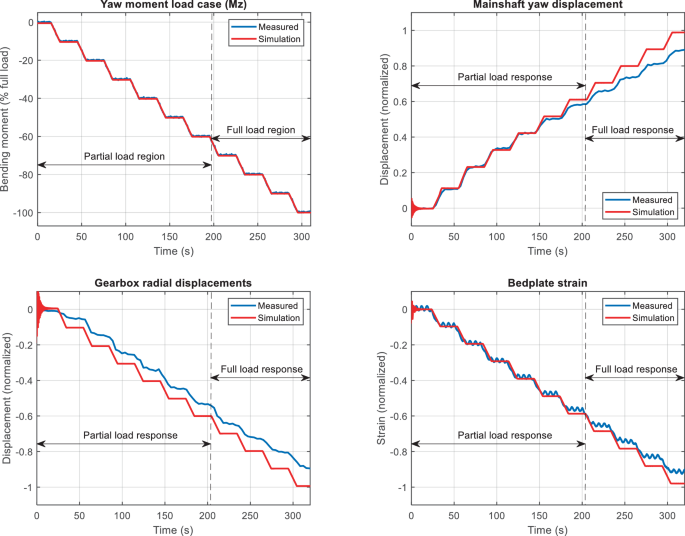
4.6 Response under yaw moments
The drivetrain response under yaw moments is shown in Fig. 10. The main shaft displacement remains in good agreement with the measured results, with the relative error less than 5% in partial loads. However, the error gradually increases at higher loads with a maximum relative error of 11% at full load. The bedplate strain response shows a good match with measured strains, with less than 5% relative error at partial loads and a maximum relative error of 8% in the full load region. The gearbox radial deflection, although having a higher relative error in the partial load range, shows satisfactory results at full loads with a maximum relative error of around 11%.
5 Discussion
The proposed hybrid testing approach presented in this contribution aims to enhance the existing nacelle testing methods by combining the simulations with the experimental measurements. The results from the demonstrated load cases are promising, as the proposed hybrid test methodology was able to predict the full load drivetrain response under parasitic loads for most of the considered load cases. Table 3 summarizes the uncertainty in predicting the full load response of all the considered load cases. The bedplate strain showed a higher error in some load cases, which can be due to multiple reasons such as insufficient selected modes during flexible body generation, oversimplified interface definition (e.g., fixed joints instead of bolted connection with pretension) in the regions near the strain sensor, uncertainty in material definition (elastic modulus), or insufficient mesh density. Another possible solution for removing such errors is the integration of better validation criteria such as the incorporation of the rate of increase in error. These aspects will be investigated further in future work. It is also vital to identify the correlation between model parameters and the system response as well as possible nonlinearity in the system. The presented work considered nonlinear bearing stiffness, which showed good results for predicting the main shaft displacements at full loads. Only the parasitic load tests were considered in the presented work. Future work will incorporate this approach for more types of nacelle tests as listed in Table 1.
The combined used of physical and simulative testing methods has been witnessed in almost every major industrial sector. Its implementation in the wind industry has significant potential, as it can help with the discovery of solutions to some of the challenges facing nacelle testing. The presented work is an attempt at advancing the use of hybrid testing methodology for wind turbine nacelles. This procedure achieves the actual test results covering most of the important aspects for design evaluation as well as obtaining the full load response backed up by validated models. The conducted physical tests, although in partial load regime, give important insights into the relevant system behavior and foster confidence in the validity of simulation models. These measurements are vital for developing reliable virtual models, as simulation models often require tuning and validation. The validated virtual model covers the full load response with potentially lower uncertainties compared with a virtual model which has not been validated. This method allows combination of the advantages of both realms (physical and virtual) of nacelle testing. Furthermore, the use of validated simulation models not only provides insights into the full load response, but can also reduce the number of physical tests required, which can reduce the test costs.
6 Conclusion
This contribution presented a hybrid testing method for nacelle testing which aims to predict the full load response of a wind turbine nacelle. The proposed approach utilized a high-fidelity virtual model of the nacelle and the test bench, which was validated by using measurements via physical nacelle testing conducted only at partial loads. Different parasitic load cases were considered as case studies for the demonstration of the proposed methodology. The results have shown that the virtual model after being validated using partial load measurements has performed well in predicting the full load response of the drivetrain. Possible solutions for the errors observed in some of the predicted responses have been discussed. This approach utilizes the existing tools and methods for predicting load response beyond the testing capacity of the nacelle test bench. Following further improvements, this method of hybrid nacelle testing not only has potential for resolving some of the challenges facing existing test benches for testing larger wind turbines, but might even help reduce the cost of conducting nacelle tests.
References
Lee J, Zhao F (2022) GWEC Global Wind Report 2022
Mehroliya S, Anoop A, Mitra U, Paliwal P, Mundra P (2021) Comparative analysis of conventional technologies and emerging trends in wind turbine generator. In: IEEE 2nd International Conference On Electrical Power and Energy Systems (ICEPES). IEEE, pp 1–6
Prakash G, Anuta H (2019) Future of wind: deployment, investment, technology, grid integration and socio-economic aspects
International Energy Agency (2012) Advances in wind turbine and components testing. IEA R&D Wind Task 11 – Topical Expert Meeting
Siddiqui MO, Feja PR, Borowski P, Kyling H, Nejad AR, Wenske J (2023) Wind turbine nacelle testing: state-of-the-art and development trends. Renew Sust Energ Rev (under review)
MEGAVIND (2016) Test and demonstration facilities for wind energy test and demonstration facilities for wind energy needed to promote a competitive wind industry in Denmark
INNTERESTING: Innovative Future-Proof Testing Methods For Reliable Critical Components In Wind Turbines. https://www.innterestingproject.eu/. Accessed 01-10-2022
Dressler K, Speckert M, Bitsch G (2009) Virtual durability test rigs for automotive engineering. Int J Veh Mech Mobil 47(4):387–401. https://doi.org/10.1080/00423110802056255
Huizinga FTMJM, van Ostaijen RAA, van Oosten Slingeland A (2002) A practical approach to virtual testing in automotive engineering. J Eng Des 13(1):33–47. https://doi.org/10.1080/09544820110090304
Lee D-C, Han C-S (2009) CAE (computer aided engineering) driven durability model verification for the automotive structure development. Finite Elem Anal Des 45(5):324–332. https://doi.org/10.1016/j.finel.2008.10.004
Zhang B, Qingzhu C, Lu Y, Jianfeng W, Wang L, Wenqian C, Yao L, Yuqing G, Gu T, You SS (2017) Component tests based on vehicle modeling and virtual testing. SAE technical paper series. SAE International, Warrendale. https://doi.org/10.4271/2017-01-0384
Matsumoto A, Sato Y, Ohno H, Suda Y, Michitsuji Y, Komiyama M, Miyajima N, Tanimoto M, Kishimoto Y, Sato Y, Nakai T (2008) Curving performance evaluation for active-bogie-steering bogie with multibody dynamics simulation and experiment on test stand. Int J Veh Mech Mobil 46:191–199. https://doi.org/10.1080/00423110801935806
Spiryagin M, Sun YQ, Cole C, McSweeney T, Simson S, Persson I (2013) Development of a real-time bogie test rig model based on railway specialised multibody software. Int J Veh Mech Mobil 51(2):236–250
Weidemann C (2010) State-of-the-art railway vehicle design with multi-body simulation. J Mech Syst Transp Logist 3(1):12–26
Ostergaard MG, Ibbotson AR, Le Roux O, Prior AM (2011) Virtual testing of aircraft structures. CEAS Aeronaut J 1(1–4):83–103. https://doi.org/10.1007/s13272-011-0004-x
You S, Gao SX, Nelson A (2019) Breaking the testing pyramid with virtual testing and hybrid simulation. Fatigue Aircr Struct 2019(11):1–10. https://doi.org/10.2478/fas-2019-0001
Giguère P, Wagner JR (2017) Wind turbine drivetrain test bench capability to replicate design loads: part I — evaluation methodology. In: ASME 2017 11th International Conference on Energy Sustainability
Giguère P, Wagner JR (2017) Wind turbine drivetrain test bench capability to replicate design loads: part II — case study of a multi-MW Drivetrain. In: ASME 2017 11th international conference on energy sustainability
Giguère P, Wagner JR (2022) Acceptance criteria for the tracking error of wind turbine drivetrain test bench when replicating dynamic loads. Wind Eng 46(1):160–176. https://doi.org/10.1177/0309524X211015271
Giguère P, Wagner JR (2022) Experimental verification of predicted capability of a wind turbine drivetrain test bench to replicate dynamic loads onto multi-megawatt nacelles, p 0309524X2110653
Matzke D, Schelenz R, Reisch S, Roscher B, Jacobs G, Theling J, Schroers M, Löpenhaus C, Brecher C (2018) Validation of the gearbox load calculation of a wind turbine MBS model. J Phys Conf Ser 1037:62025. https://doi.org/10.1088/1742-6596/1037/6/062025
Matzke D, Jacobs G, Schelenz R (2019) Validation of MBS modeling methods to calculate bearing and tooth loads in the planetary gear stage of a wind turbine. In: Conference for Wind Power Drives, CWD 2019 : conference proceedings. RWTH, Aachen, pp 333–348
Matzke D, Schelenz R, Jacobs G (2017) Full scale system simulation of a 2.7 MW wind turbine on a system test bench. In: Conference for Wind Power Drives, CWD 2017 : conference proceedings. RWTH, Aachen
Panyam M, Bibo A, Roach S (2018) On the multi-body modeling and validation of a full scale wind turbine nacelle test bench. In: ASME dynamic systems and control conference
Röder J, Jacobs G, Duda T, Bosse D (2020) Simulative investigation of the load propagation in a wind turbine drive train during a power converter fault. J Phys Conf Ser 1618(3):32028. https://doi.org/10.1088/1742-6596/1618/3/032028
Röder J, Jacobs G, Duda T, Bosse D, Herzog F (2021) Investigation of dynamic loads in wind turbine drive trains due to grid and power converter faults. Energies 14(24):8542. https://doi.org/10.3390/en14248542
Röder J, Jacobs G, Duda T, Bosse D, Herzog F (2021) Simulative investigation of wind turbine gearbox loads during power converter fault. Forsch Ingenieurwes 85(2):251–256. https://doi.org/10.1007/s10010-021-00461-2
VirtGondel: Development and validation of a virtual representation of the nacelle test bench for the elaboration of advanced test methods and more efficient test campaigns. Fraunhofer IWES
MSC Software Corporation Adams – the multibody dynamics simulation solution. http://www.mscsoftware.com/. Accessed 06-09-2022
Craig RR (1987) A review of time-domain and frequency-domain component-mode synthesis techniques. 2:59–72. https://ntrs.nasa.gov/citations/19860042139
Siddiqui MO, Eich N, Eustorgi K, Feja P (2020) Implementation and experimental validation of a dynamic model of a 10 MW nacelle test bench load application system. J Phys Conf Ser 1618(3):32044. https://doi.org/10.1088/1742-6596/1618/3/032044
Guo Y, Keller J, Lacava W, Austin J, Nejad A, Halse C, Bastard L, Helsen J (2015) Recommendations on model fidelity for wind turbine gearbox simulations
Acknowledgments
The authors would like to thank the involved colleagues at Fraunhofer IWES and GE Renewable Energy for their contributions to the VirtGondel project. The funding of the VirtGondel project by the German Federal Ministry for Economic Affairs and Climate Action (BMWK) is kindly acknowledged.
Funding
Open Access funding enabled and organized by Projekt DEAL.
Author information
Authors and Affiliations
Corresponding author
Rights and permissions
Open Access This article is licensed under a Creative Commons Attribution 4.0 International License, which permits use, sharing, adaptation, distribution and reproduction in any medium or format, as long as you give appropriate credit to the original author(s) and the source, provide a link to the Creative Commons licence, and indicate if changes were made. The images or other third party material in this article are included in the article’s Creative Commons licence, unless indicated otherwise in a credit line to the material. If material is not included in the article’s Creative Commons licence and your intended use is not permitted by statutory regulation or exceeds the permitted use, you will need to obtain permission directly from the copyright holder. To view a copy of this licence, visit http://creativecommons.org/licenses/by/4.0/.
About this article
Cite this article
Siddiqui, M.O., Nejad, A.R. & Wenske, J. On a new methodology for testing full load responses of wind turbine drivetrains on a test bench. Forsch Ingenieurwes 87, 173–184 (2023). https://doi.org/10.1007/s10010-023-00629-y
Received:
Accepted:
Published:
Issue Date:
DOI: https://doi.org/10.1007/s10010-023-00629-y


