
Abstract
Despite the millions of electronic theses and dissertations (ETDs) publicly available online, digital library services for ETDs have not evolved past simple search and browse at the metadata level. We need better digital library services that allow users to discover and explore the content buried in these long documents. Recent advances in machine learning have shown promising results for decomposing documents into their constituent parts, but these models and techniques require data for training and evaluation. In this article, we present high-quality datasets to train, evaluate, and compare machine learning methods in tasks that are specifically suited to identify and extract key elements of ETD documents. We explain how we construct the datasets by manual labeling the data or by deriving labeled data through synthetic processes. We demonstrate how our datasets can be used to develop downstream applications and to evaluate, retrain, or fine-tune pre-trained machine learning models. We describe our ongoing work to compile benchmark datasets and exploit machine learning techniques to build intelligent digital libraries for ETDs.
1 Introduction

We present datasets for metadata extraction, figure and table extraction, and document structure extraction. For each, we give examples of how we are using the dataset to train, evaluate, or compare machine learning models used for extracting metadata and other key document elements. Identifying these elements facilitates developing value-added user services for ETD libraries
Despite the large number of electronic theses and dissertations (ETDs) publicly available online, this rich body of scholarly work is insufficiently utilized. Partly to blame is the lack of innovation in digital library services for ETDs. Not much has changed since the release in 2002 of DSpace [67], the open source institutional repository platform ubiquitous with ETDs. Twenty years later, digital library services for ETDs have not moved beyond simple search and browse at the metadata level. Users can download a PDF of the ETD, but all other interactions with the content must occur outside of the digital library.
Digital libraries lack computational models, tools, and services for discovering and accessing the knowledge buried in ETDs and other long documents. Accordingly, one phase of our research involves deconstructing ETDs into smaller document elements. ETDs contain novel ideas and findings that make a significant contribution to their subject areas. They often contain extensive bibliographies and reviews of the literature, as well as useful graphs, figures, and tables. Key document elements of these long documents can be identified and extracted computationally to improve access and discoverability and to facilitate the creation of richer user interfaces. Using machine learning methods for document classification and understanding, individual document elements can be automatically classified and summarized, allowing users to easily assess their relevance.
Machine learning techniques for document analysis and understanding offer opportunities to build intelligent digital libraries [22]. The user interfaces of traditional digital libraries usually only show basic bibliographic metadata and a download link to a PDF of the ETD. A more intelligent digital library can allow its users to interact directly with the content within the digital library. Interactive outlines or tables of contents can be created by applying document layout analysis to expose an ETD’s logical structure, allowing users to quickly find the entry point that best matches their particular information need or interest. Individual chapters can be described and summarized automatically. Figures and tables can be extracted and displayed separately. Machine learning techniques for metadata extraction, topic modeling, and entity recognition can enable both inter- and intra-document search and browsing.
Beginning with Virginia Tech in 1997, graduate programs all over the world allow (and often mandate) electronic submission of an ETD as a requirement for graduation. These ETDs are typically made publicly accessible through institutional repository programs administered by university libraries. This is in keeping with the long-held university library practice of binding and housing paper copies of thesis and dissertation collections in the stacks. To bolster their electronic collections, some universities now provide electronic access to historical ETDs by scanning (digitizing) these print volumes. For instance, Virginia Tech’s ETD collection is a mix of born-digital and scanned print volumes dating back to 1903. Generally, ETDs written before 2000 are scanned versions of physical copies.
Scanned ETDs present challenges different from those of their born digital counterparts. PDFs created from word processing software or LaTeX may have some structural information embedded in their coding. But scanned ETDs are basically just images. Like the physical copies they were created from, the logical structure of a scanned ETD is only communicated by typesetting conventions—blocks of text form sections, boldface or larger texts indicate section headings, and so on. Fortunately, there are a number of machine learning techniques for decomposing the contents of scanned ETDs. However, each of these techniques requires data for analysis, for developing a set of training examples, and for measuring the predictive accuracy of machine learning models. In this paper, we present several datasets for evaluating and comparing the abilities of different machine learning methods at tasks specifically suited to building digital libraries for ETDs.
This article builds upon and extends the research presented in two previously published JCDL papers, which are referenced below as [12] and [34]. The ETD500 dataset introduced in [12], consists of 500 annotated ETD cover pages with human-validated metadata. The ScanBank dataset introduced in [34], contains 10 thousand scanned page images manually labeled for the presence of figures and tables.
Our current research extends beyond the scope of metadata extraction and figure and table extraction to include topic modeling, entity recognition, and chapter-boundary detection. In the sections that follow, we present our suite of ground-truth datasets developed for building digital library services tailored to ETDs, including two new datasets: ChapterParse and ETDText. Some of the datasets described below were created by manual labeling of the data. Others were derived through a synthetic process. For each task, we describe how we developed the dataset, and give examples of how we are using the dataset in developing digital library services for ETDs.
2 Related work
The past decade has seen great advances in scholarly big data, wherein hundreds of millions of scholarly papers have been mined [36]. Comprehensive frameworks were developed to segment scholarly papers into different levels of elements (e.g., GROBID [47] and CERMINE [74]). Table and figure extraction software also was developed, such as PDFFigures [14], PDFFigures2 [15], TableBank [41], DocBank [42], and DeepFigures [64]. These either rely on the underlying document structure of a PDF file [13,14,15, 74], or exclusively cater to the analysis of born-digital documents [41, 42, 64]. However, most off-the-shelf frameworks work poorly for ETDs.
In this section, we briefly review datasets for identifying or segmenting relevant document elements of scholarly documents, focusing on metadata extraction and figure/table extraction.
2.1 Metadata extraction datasets
Automatically extracting metadata from academic documents is a long-standing problem. Metadata fields include, but are not limited to, title, authors, year, venues, volume, number (or issue), DOI, and abstracts. The Dublin Core describes 15 key metadata fields [38, 81] and was later expanded to 55 fields according to the DCMI Metadata Terms specification.Footnote 1 The Text Encoding Initiative (TEI) consortium collectively develops and maintains a standard for the structural representation of documents in digital form.Footnote 2 The Open Archives Initiative Object Reuse and Exchange (OAI-ORE) defines standards for the description and exchange of aggregations of Web resources [48], with a more general scope than scholarly documents. Metadata extraction provides textual information for structured search (e.g., via a relational database) or full-text search (e.g., via an inverted file). Metadata can also be used to link data across multiple databases and repositories (e.g., [82]).

Examples of ETD front pages. First row, from left to right: University of Illinois Urbana-Champaign (1955), University of California, Berkeley (1968), California Institute of Technology (1971), University of Pittsburgh (1971); Second row, from left to right: Virginia Polytechnic Institute and State University (1987), Massachusetts Institute of Technology (1994), East Tennessee State University (2005), Pennsylvania State University (2019)
Automatic metadata extraction is challenging because scholarly documents could be written with a variety of format settings. Although ETDs are usually written in relatively common styles, the layout varies a lot across years and universities. Figure 2 shows several examples of ETD cover pages with varying page layouts. Unlike periodicals, ETDs are usually published as a standalone document, so they do not have venue, volume, and number (issue) information. Many ETDs do not have publisher information or DOIs, although many are assigned persistent identifiers through the Handle.Net Registry.Footnote 3 We briefly review representative contributions of datasets used for metadata extraction from scientific articles. Nasar et al. provided a systematic survey [51].
An early effort to extract metadata from academic documents used heuristic rules (e.g., [71]) that only worked well for documents in a very specific domain. Later, machine learning methods were applied to this task, such as the Hidden Markov Model (HMM) [61]. Around 1999, the CORA dataset was introduced; it contains two subsets. The first subset is used for metadata extraction and contains 935 manually annotated headers of computer science research papers. The second subset is used for parsing reference strings; it includes about 500 manually tagged reference strings from computer science papers. The dataset was used to develop a metadata extraction framework using support vector machines [24].
2.2 Figure and table extraction datasets
In PDFFigures2 [15], Clark and Divvala proposed a novel approach to figure and table identification that analyzes the structure of individual pages. Their model was evaluated on two datasets of computer science papers. The CS-150 dataset, originally introduced by Clark et al. [14], consists of 150 papers from top-tier conference proceedings. The CS-150 dataset contains 458 labeled figures and 191 tables. The CS-Large dataset consists of 346 papers originating from over 300 different venues. The CS-Large dataset contains 952 figures and 282 tables. There are labels and bounding regions for each caption, figure, and table.
Siegel et al. proposed DeepFigures [64], a method for extracting figures and tables from scholarly PDFs. Data from arXivFootnote 4 [16] and PubMedFootnote 5 were used for locating figures in scientific papers, which were then used for training a deep learning model, consisting of ResNet [27] in conjunction with the Overfeat architecture [60], to predict coordinates of the bounding boxes around figures.
Li et al. [41] proposed TableBank, an image-based table detection and recognition framework. Their contribution was a weakly supervised machine learning (ML) model trained on a dataset of Microsoft Word and LaTeX documents crawled from the Web. The authors included documents of different languages. The method modified the document source code, allowing them to generate a ground-truth dataset of figures and tables, with known bounding boxes. The authors took a step further and built a recurrent neural network that converted a detected table (in an image format) into a table markup format (i.e., a table parsed into text). In other words, it converted an image of a table into a structured machine-readable format; this was called table structure recognition.
Hansen et al. [25] employed an object detection model called Faster R-CNN, which allows them to make region assignments for tables in a PDF document that are better than DeepFigures. They introduced a dataset with 31,639 manually labeled PDF pages with image bounding boxes. Like DeepFigures, Faster R-CNN and TableBank were trained on born-digital documents, hence their performance is expected to decrease for scanned documents.
Recently, Lee et al. [40] proposed the Newspaper Navigator dataset, used to extract and analyze visual content from 16 million historic newspaper pages from “Chronicling America.” This work used a manually labeled dataset of historic newspaper pages that contained labels for seven classes (headlines, photographs, illustrations, maps, comics, editorial cartoons, and advertisements). A pre-trained Faster R-CNN model was fine-tuned on this dataset to enable the extraction of the targeted visual content. The documents used in this work were archived newspapers, which have visual structures different from those of scholarly documents, including ETDs.
2.3 Document structure parsing datasets
In 2009, a relatively large dataset was developed from PubMed articles to train GROBID [47], a machine learning library for extracting, parsing, and restructuring PDF documents into structured TEI encoded XML documents. The dataset was used for training a series of nested conditional random field models based on approximately 1,000 training samples for header information (e.g., metadata) and 1,200 training samples for cited references. The GROBID training data and source code are available on GitHub.Footnote 6
TEAM-BEAM was a system developed in 2012 to provide a flexible tool to extract a wide range of metadata from scientific articles [35]. It employed a Maximum Entropy classifier trained on three proprietary datasets: eprints (2,452 PDFs with the metadata in multiple domains), Mendeley (20,672 papers annotated by Mendeley users in multiple domains), and PubMed (9,581 papers representing a range of different article types).
Around 2015, another dataset called GROTOAP2 was compiled, consisting of 13,210 ground truth documents with labeled fragments of scientific articles in PDF format [73]. The documents were obtained from the PubMed Open Access Subset. GROTOAP2 was used for training and evaluation of CERMINE [74], a system for extracting metadata and content from scientific articles. CERMINE also used data from CiteSeer and PMC for citation parsing.
The previous datasets were all based on real documents. Recently, the Document Domain Randomization (DDR) method was proposed, which simulates document pages by randomly selecting structural and semantic content of the document [44]. Using DDR, the authors synthesized 15K document images rendered with random figures, tables, algorithms, and equations chosen from VIS30K [10]. The methods can potentially be used to generate pages used to train layout parsers of different types of documents.
Recognizing the layout of unstructured digital documents is an important step in parsing the documents into a structured machine-readable format. PubLayNet [85] is a dataset containing over 360K document images, with typical layout components, including titles, text, lists, tables, and figures. The dataset was generated by automatically matching the XML representations and the content of over 1 million PDF articles publicly available on PubMed Central. The dataset can be used to build a pre-trained model for layout parsing (e.g., [83]). Other datasets used for layout parsing include arXivdocs [55], unarXvie [58], and DocBank [42].
Although many benchmark datasets have been proposed, most are best suited for conference proceedings and journal articles (e.g., PubMed papers). As such, they are not useful for processing book-length documents with chapters. The only system for chapter segmentation we know of is ITCore (Intelligent Textbooks Core) [8, 9], which generates a TEI representation of textbooks using a rule-based approach based on information discovered from analyzing the table of contents. However, in our preliminary experiments [31], ITCore was unable to accurately or consistently segment the chapters from the ETDs. We hope our contribution of new datasets will fill a key gap, by supporting information extraction from ETDs and similar book-length documents.
3 Our ETD datasets
In this section, we describe four new datasets we have assembled for various machine learning tasks specifically suited for digital library services related to theses and dissertations (recall Sect. 1). We describe the properties of each dataset and how each dataset was generated. Table 1 summarizes the datasets we contribute.
3.1 ETD500
3.1.1 Sample selection
ETD500 was created for two tasks: extraction of metadata from ETD cover pages and page-level segmentation. In a previous study [11] we built a small dataset containing only 100 ETDs, drawn from only two universities: Massachusetts Institute of Technology (MIT) and Virginia Polytechnic Institute and State University (Virginia Tech). To increase diversity and size, we created a new dataset called ETD500, consisting of 500 scanned ETDs, including 450 ETDs from 15 U.S. universities and 50 ETDs from six non-U.S. universities (Fig. 3). The new dataset includes the 100 ETDs randomly selected from MIT and Virginia Tech libraries. The remaining ETDs were randomly selected from ProQuest’s collection. The ETDs were published between 1945 and 1990. There are 375 STEM (science, technology, engineering, and mathematics) and 125 non-STEM works. Their authors earned 468 doctoral, 27 master’s, and 5 bachelor’s degrees.
3.1.2 Data preprocessing and labeling

ETD500 dataset used for extracting metadata from ETD cover pages. (i) Distribution of ETDs by university; (ii) Distribution of ETDs by STEM vs. non-STEM subjects
Metadata extraction: To support metadata extraction, we first need to locate and annotate accurate metadata from ETD cover pages. First, we convert the cover page of each PDF to a TIFF image. Then we obtained the OCRed text by applying Tesseract-OCR [68] directly to the TIFF images. Unfortunately, faithfully extracting text from scanned ETDs is still a challenge for most open-source and commercial OCR tools (see [23] for a comparison of various OCR tools on a label extraction task). Therefore, we generated ground truth metadata by manually correcting the extraction results from Tesseract-OCR, which outputs recognized text and coordinates of bounding boxes surrounding the text. Then we manually annotated up to seven metadata fields, including title, author, advisor, year, program, institution, and degree for each ETD cover page [12]. To support related tasks, we also keep several auxiliary datasets together with the final dataset. An auxiliary dataset was created by parsing the respective fields from metadata provided by the university library. However, we observed that this dataset contained errors or inconsistent values. Therefore, we revised each field by aligning its value with what is printed on the ETD cover page. The final ground truth also preserved the positions of annotated metadata, by aligning the output of Tesseract and annotated metadata using Levenshtein distance.
Page labeling: To support our page-level segmentation task, we manually labeled 92,375 pages from 500 ETDs into 14 different categories for the pages (Table 2). The pages of each ETD were labeled according to one of the 14 labels and stored in a text file that mapped each label to the corresponding page number. A page was labeled as “Title” if it included the dissertation title, the author’s name, etc., but not a descriptive section. In some ETDs, there is an abstract for each chapter, so those pages were labeled “ChapterAbstract”. If a page did not fit into any of the 13 other categories, it was labeled “Other”.
OCR was performed on all pages using AWS Textract, a cloud-based service that reads and extracts texts from scanned documents. Because Textract accepts images in JPEG or PNG format, all pages were converted from PDF to PNG images using Adobe Ghostscript. Textract outputs an array of block objects representing the detected texts. A block contains information about a recognized text span, such as its ID, type, bounding box, and confidence score. For each ETD, we saved a text file containing the detected texts and a JSON file containing the bounding box coordinates, extracted from the block.
-
Height: The height of the bounding box as a fraction of the total height of the document page.
-
Width: The width of the bounding box as a fraction of the overall document page width.
-
Top: The top coordinate of the bounding box as a fraction of the overall document page height.
-
Left: The left coordinate of the bounding box as a fraction of overall document page width.
3.2 ScanBank
In this section, we describe our datasets for identifying and extracting figures and tables from scanned ETDs.Footnote 7
Over the past decade, deep learning techniques have significantly boosted the accuracy of object detection and classification in natural images [37, 39]. Document objects such as figures and tables contain important information. Their automatic identification and extraction from PDF files is key to enhancing computational access to scholarly works. This facilitates important operations such as semantic parsing, searching, and summarizing.
There are many challenges to accurately identify figures in scanned ETDs. The image resolution and scanning quality may vary across the collection. OCR output is often error-ridden. Many older ETDs were typewritten. In very old documents, figures and tables may have been hand drawn or rendered in a separate process and literally cut-and-pasted into typewritten documents. Additionally, since ETD collections are cross-disciplinary, the documents in them present a variety of layout styles.
Unlike born-digital PDFs, scanned PDFs began as hard copies and were later digitized into PDFs using scanning tools such as flatbed scanners. The scanning process introduces artifacts in PDFs. For example, the content of some pages might be slightly rotated or tilted due to errors in the placement of the paper on the scanner. Other types of noise, such as salt-and-pepper noise, blurring, and perspective transformations, are also possible. The content of the PDFs could have been typed using a typewriter—some very old theses were even handwritten. Therefore, the overall appearance of a scanned PDF can vary significantly from a born digital PDF. As a result, the feature distribution of the data on which DeepFigures were trained is significantly different from that of the scanned ETD PDFs. This leads to a worse performance for DeepFigures for scanned ETDs, according to our experiments (described in Sect. 4.2).
3.2.1 Manually labeled dataset
We propose a new non-born-digital benchmark standard dataset called ScanBank for training and evaluating machine learning methods specific to extracting figures from scanned ETDs.
To create ScanBank, we retrieve the PDFs and metadata of all ETDs from MIT’s Theses collection.Footnote 8 The collection contains over 50,000 undergraduate, master’s, and Ph.D. theses dating as far back as the mid-1800 s that have been scanned by MIT Libraries. We choose this collection for three reasons. First, many of these ETDs were initially submitted as paper copies and scanned into PDF. Second, the ETDs are organized by department, which facilitates sampling over different fields of study. Third, each ETD has associated metadata that can be used for sampling across years.
We randomly sampled the ETDs with the following constraints. The publication date needed to be before 1990 (to ensure that it was scanned). At most, one ETD must come from each subcommunity (doctoral, master’s, and bachelor’s) within each department. After accounting for empty subcommunities, our sample contained a total of 70 ETDs.
Next, we convert each page from PDF to an image file. Thus, if an ETD had 100 pages, we would create 100 separate image files. Then we scaled the resolution to 100 dots per inch so that each image resembles a lower quality scan. We did not change the original aspect ratio of the pages when converting them to images.
A total of 10,182 images of pages were obtained in the 70 sampled ETDs. We used the VGG Image Annotator (VIA) [20, 21] to manually label these images with bounding boxes around figures. The VIA tool provides a graphical user interface for manual labeling of images. We used rectangular bounding boxes whose coordinates can be recorded using mouse click-and-drag in the VIA tool. Each bounding box contains the coordinates of the top left corner of the bounding box and its actual width and height in pixels.
The following labeling guidelines were used:
-
1.
Some ETDs contained source code snippets. These code snippets were not labeled.
-
2.
“Table of Contents,” “List of Figures,” and “List of Tables” were not labeled since they are visually similar to tabular data.
-
3.
Figure captions were also labeled.
-
4.
The bibliography was not labeled since it can be classified neither as a figure nor a table.
-
5.
Math equations (including matrices) were not labeled.
-
6.
For screen-captures (including newspaper clippings that contain figures), the individual figures within the figures were labeled. The encompassing figure was not labeled. No nested or overlapping labeling was done.
When manually labeling the ScanBank dataset, the captions of the respective figures were included in their respective boxes to be consistent with DeepFigures. In total, 3,375 figures were labeled across the entire dataset of 10,182 page images.
The ScanBank dataset is freely available online [33]. This contains a JSON file containing the coordinates of the 3.3K bounding boxes that represent the figures in the 10K images [33]. Additionally, to limit the size of the downloaded file, this dataset only contains the URLs of the ETDs that were used to create the 10K images in this dataset [33]. The Python source code and instructions, which are included with the dataset, can be executed to download the ETDs and convert them into 10K page images [33].
3.2.2 Synthetically derived dataset
The research that most inspired this part of our work is DeepFigures [64], which generated high-quality labels for figures using data derived from arXiv and PubMed papers. Unfortunately, the model performs poorly on scanned ETDs, as we demonstrate in Sect. 4.2. The main idea is that the bounding boxes around the figures can be marked by altering the LaTeX. The result is a set of PDF papers with the bounding boxes surrounding the figures highlighted. Inspired by this idea, we describe our efforts to synthetically create a dataset to identify figures from scanned ETDs by augmenting born digital files to make them look like they were scanned.
Data augmentation [53] is a popular technique in deep learning that helps train a model better without collecting new data. Some of the common data augmentation methods are affine transformations, random rotations, additive noise (e.g., salt-and-pepper, Gaussian), perspective transformations, and random cropping [72].
Our process applies image-based and LaTeX-based transformations to modify born-digital documents. To start, we retrieved a collection of arXivFootnote 9 papers using AWS’s S3 APIFootnote 10 as mentioned on their bulk access website.Footnote 11 The arXiv data consist of the LaTeX source code for research papers. The authors of DeepFigures [64] used these LaTeX files to induce labels for the figures and then trained their models based on these labels. We take an additional step of augmenting the data to make resulting PDFs that are visually similar to scanned papers.
LaTeX-based data augmentations Although image-based transformations change the overall appearance of a page, they do not change the inherent structure of the text within the page. The text is still well-formed and does not quite resemble the text from a PDF scanned from a typewritten document. To achieve such effects, we impose modifications in the LaTeX source code in addition to the image-based transformations.
-
Font size modification. We incorporate this effect by modifying the following command at the beginning of each document.

We replace it with the following command:

-
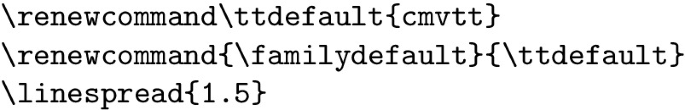
LaTeX macros modification. We add the following LaTeX source code before the beginning of the document to change the font type of the document to look more like a typewriter font and also increase the line spacing to 1.5:


a The left image shows the original page from [2] (page number 7). b The middle image shows the same page after applying only image-based transformations. c The right image shows the page after applying both image-based and LaTeX-based transformations. Note the change in font-size and font layout
Figure 4 shows three versions of an example page image. The original page is shown in Fig. 4 (left). Figure 4 (right) shows the image after applying LaTeX-based transformations. Figure 4 (middle) shows the image after applying image-based transformations (discussed below).
Image-based data augmentations We use the popular ImgAugFootnote 12 open-source software library, which provides the capability to augment not only images but also the corresponding bounding boxes around images. Each transformation below is available as a function in ImgAug.
-
Random affine rotation. While scanning the hard-copy of a document, pages may be slightly rotated, and hence might not be perfectly aligned. Therefore, we rotate each page of a PDF file by n degrees, where n is a floating point number sampled from a standard uniform distribution.
-
Additive Gaussian noise. A flatbed scanner works by reflecting light from the paper and creating an image of the paper based on the naturally reflected light. Hence, we use Additive Gaussian Noise to mimic this effect. The parameters of this noise are heuristically chosen using trial-and-error.
-
Salt-and-pepper noise. Salt-and-pepper noise is often seen on images caused by sharp and sudden disturbances in the image signal [57]. We heuristically chose 0.1 as the probability of replacing a pixel by noise.
-
Gaussian blur. Unlike natural (analog) images, digital images must be encoded with a specified resolution, resulting in a predetermined number of bytes and some loss of sharpness. Therefore, we apply Gaussian blurring to smooth the images using a Gaussian Kernel (\(\sigma =0.5\)).
-
Linear contrast. Although today’s scanners are built using modern technology, they are incapable of capturing all colors of a natural object. To incorporate this scanning effect, we add Linear Contrast (parameterized by \(\alpha =1\)).
-
Perspective transform. Since scanned pages can sometimes look stretched, we implement Perspective TransformFootnote 13 in which a part of the image (formed by randomly selecting 4 points) is stretched.
Random affine rotation and perspective transform might cause geometric changes in the images which could lead to a mismatch between the locations of bounding boxes and locations of the figures. To correct for this mismatch, we use a feature in ImgAug that transforms the bounding boxes according to the transformations that are applied.
Figure 4 (middle) shows the image of a page from a research paper downloaded from arXiv [2] after applying the image-based data augmentation operations mentioned above.
The processes for obtaining the labels from these augmented images occurs after incorporating the proposed modifications.
The source code to create this dataset is included with ScanBank [32]. The implementation of LaTeX-based augmentations is found in the source at /deepfigures/data_generation/paper_tar_processor.py. Invocations of functions for image-based augmentations are found in /deepfigures/settings.py.
3.3 ChapterParse
In this section, we propose a new benchmark standard dataset called ChapterParse for training and evaluating machine learning methods specific to identifying and extracting chapter boundaries from ETDs.
3.3.1 Manually labeled dataset
Since no manually labeled dataset was available that characterizes the segmentation of ETD chapters, we constructed one. This dataset of 150 ETDs specifies an original PDF and provides a corresponding JSON file containing manually labeled chapter boundaries. This dataset can be used to benchmark deep learning chapter segmentation models.
To evaluate such deep learning models, we collected 100 ETDs from arXiv. In addition, we sampled 50 ETDs from a large collection we crawled from the repositories of U.S. universities. For these 150 ETDs, the disciplines covered and the number of documents associated with each discipline are given in Table 3.
Pages in an ETD were manually traversed, and the chapter starts were recorded. A distinction was drawn between the front material, the chapters, and the end material. The resulting manually labeled JSON file follows the format of the JSON created by the chapter segmentation pipeline (discussed below) for the synthetically generated dataset.

Overview of chapter-segmentation pipeline
3.3.2 Synthetically derived dataset
Our second, synthetically generated dataset, required LaTeX source files (as available in arXiv [16]) to generate chapter boundary details. arXiv is an open-access archive that contains millions of scholarly works, in the fields of physics, mathematics, computer science, system science, and economics. arXiv also provides access to the source files that were used to generate each document’s original PDF. For this reason, our synthetically generated dataset contains only ETDs from arXiv.
Inspired by previous work [34, 64], we manipulated ETDs’ source LaTeX files to generate high-quality labels to identify chapter boundaries. Below we describe the chapter segmentation pipeline that we developed to derive ground-truth chapter segmentation data synthetically.
The arXiv repository contains LaTeX source files for each work. Previous studies (e.g., [46, 58]) have shown that LaTeX source files can be used to accurately analyze document structure. Unfortunately, arXiv does not provide a standard way of identifying works by type or genre.
Since we only want theses and dissertations, we employed a heuristic-based filter for finding ETDs. Specifically, we noticed that many depositors use the comment field to indicate that a work was a thesis or dissertation. Based on this observation, we began by retrieving papers with text in the comment section containing the words “phd,” “masters,” “dissertation,” or “thesis.” This yielded about 6,000 documents, but we quickly found that many were not in fact ETDs. Many turned out to be only a single chapter from an ETD, rather than the entire document. Therefore, we distributed the corpus of 6,000 documents among team members for manual inspection. The manual inspection ruled out nearly half, leaving us with about 3,300 documents that were found to be true ETDs. Finally, some of the LaTeX files we retrieved could not be compiled using our software. Those that could not be compiled into PDF were discarded, leaving us with 1,986 ETDs. Further processing and checking led to our final dataset of 1,459 ETDsFootnote 14 identified in arXiv.
LaTeX augmentations Our chapter segmentation pipeline (CSP) (see Fig. 5) uses source LaTeX files to create two copies of the original document. One is a copy of the original PDF, while the other is a modified version of the PDF with chapter headings altered by changing the LaTeX

command. We compare the original PDF with the modified PDF to ensure that our LaTeX modification did not cause inappropriate side effects.
Figure 6 shows an in-depth algorithm flow of the CSP. For more information, see the related thesis [50].

CSP algorithm flow
A final JSON deliverable is created only if all chapters are found in the order in which they were collected from the modified PDF.
Validation Manual validation of the synthetically generated data was performed in two separate procedures. For the first procedure, we inspect the page numbers accuracy generated by the chapter segmentation pipeline. We curated a list of relevant criteria and inspected outlier ETDs.
-
1.
A high number of chapters: Above 17 chapters.
-
2.
A low number of chapters: Between 2 and 5 chapters.
-
3.
Short documents: Less than 37 pages in length.
-
4.
Long documents: Above 254 pages in length.
-
5.
Last chapter is unusually long: Above 26 pages in length.
-
6.
A high number of chapters when compared to document length.
-
7.
A low number of chapters but long documents.
-
8.
A high number of chapters for short documents.
For each criterion, ten outlier ETDs were selected at random. A total of 80 ETDs were inspected. Each entry in the JSON file of the chapter boundary was compared to the original PDF. No problems were found at this stage.
In our second procedure, we inspect the capture accuracy for the chapter labels. For this, we randomly sampled a set of 35 ETDs for which the CSP successfully generated a JSON file with chapter boundary details. We manually labeled the chapter boundaries for each of those 35 ETDs, recording the results in JSON files. Table 4 displays the results of the comparison of the two sets of JSON files. The chapter segmentation pipeline shows perfect capture accuracy for chapter titles, but misses front-matter and end-matter material.
3.4 ETDText
To support downstream text mining tasks, such as entity extraction, summarization, and citation parsing, we created the ETDText dataset. In general, there are two types of PDF documents. Born-digital PDFs are generated directly from digital source files, such as compiling LaTeX files or converting from Microsoft Word documents. Scanned PDFs (aka non-born-digital) PDFs are generated by scanning physical copies. Due to these differences, we used different ways to extract text.
Text Extraction from Born-Digital ETDs To extract text from born-digital PDFs, we compared two standard libraries, PDFPlumber [66] and SymbolScraper [63]. PDFPlumber is a Python library for extracting detailed information about each text character, rectangle, and line. SymbolScraper was developed to extract all symbols and characters and their positions from PDF documents. The comparison dataset was built by selecting 100 born-digital ETDs from the works we harvested from U.S. university repositories. We then extracted text from PDF files.
It is challenging to automatically compare the quality of the text by directly comparing the extraction results with the original text. Therefore, we used other metrics to infer text quality. We compared the number of characters and tokens. We also inspected a sample of citation strings curated from extracted text. We chose citation strings because their quality can affect the citation parsing results, and they usually appear in blocks, making them easier to be identified and aligned.
The NLTK toolkit word_tokenize() method was used to tokenize text based on whitespace to count tokens. To calculate the number of characters, we removed all whitespace from the text, converted them into a list of characters, and then calculated the length. The distribution of the differences, as shown in Fig. 7 and Fig. 8, resembles a Gaussian distribution with a negative mean value, indicating that on average, SymbolScraper tends to extract fewer tokens than PDFPlumber while SymbolScraper tends to extract more characters than PDFPlumber. We also manually inspected 6762 citation strings extracted using these two software packages and found that SymbolScraper fails to identify white spaces between two words for 19 citation strings, incorrectly causing consecutive words to be concatenated into a single long string. For three citation strings, it also failed to extract the entire string. Based on the comparison, we chose PDFPlumber to extract text from all ETD PDFs.
ETDText preserves all text that could possibly be extracted from the original PDF. To reduce the noisy text extracted from the figures and tables, we created another version of ETDText, called ETDTextR, by removing the figures and tables before extracting the text. In Sect. 4.4, we demonstrate that the language model trained on ETDTextR exhibited a better perplexity score than the one trained on ETDText. The text files were also stored in our repository. Currently, ETDText and ETDTextR each contain 339,485 text files.

A comparison of extracted tokens between PDFPlumber and SymbolScraper

A comparison of extracted characters between PDFPlumber and SymbolScraper
Text Extraction from Scanned ETDs Text from scanned documents is often extracted using an OCR engine such as Tesseract [68]. However, OCR engines usually do not separate text and non-textual elements such as figures and tables, which may contain textual content. Therefore, directly applying OCR engines on scanned documents often result in noisy text strings from figures and tables, which are undesirable in many tasks, such as document classification and summarization.

An overview of the text extraction pipeline
An intuitive approach to extract clean text from scanned documents is to mask other non-textual or partially textual elements such as figures and tables, which would otherwise lead to undesirable noise in the extracted text. We developed a text extraction pipeline for scanned documents that performs OCR-based text extraction on pages with masked figures and tables.
In Table 5, we show examples of page images before and after masking. The original image consists of elements such as figures and tables, which often contain some text in the form of legends, annotations, or table values. We use a figure and table extraction module to first mask these elements and generate masked page images. Next, these images are fed to an OCR engine to obtain text from individual pages. This process can further be extended to incorporate other elements that are not purely textual or might be undesirable in the full text of the document, such as equations, page numbers, or headings.
4 Applications
In the following sections, we describe a few downstream applications. We begin by demonstrating how we use our ScanBank dataset to evaluate and compare various deep learning modes for figure and table extraction. Next, we explain how identifying figures and tables facilitates extracting clean text from scanned ETDs by masking other non-textual or partially textual elements. Then we describe how extracting clean text allows us to build better language models for ETDs, which are used for information retrieval, text classification, and summarization.
4.1 Metadata extraction
In this section, we describe how ETD500 is applied to ETD metadata extraction. Human-labeled categories can be used for page-level segmentation, which will be done in future work.
Existing frameworks such as GROBID [47] were designed to extract, parse, and restructure scientific papers. Our experiments indicate that GROBID did not extract metadata from scanned ETDs. This is because the layout of ETDs is very different from conference proceedings and journal papers. We observed that for most ETDs, the cover page contains many metadata fields. Therefore, we developed a method to extract metadata that took an ETD cover page as input and outputted a JSON file containing metadata fields and their values. Here, the cover page is usually the page that contains a line “submitted in partial fulfillment of the requirements for the degree of” or its variants.
We divided the ETD500 dataset (Sect. 3.1) into a training set and a test set, consisting of 350 and 150 ETDs, respectively. We implemented the conditional random field (CRF) model, which has been commonly used for sequence labeling. The training data were constructed as follows. For sequence labeling, we tokenized each metadata field and tagged each token that is within a target metadata field using the BOI tagging schema. For example, if a token is within a university name, we tagged it as B-university and I-university. Tokens that were not part of any metadata field were tagged as outside (O). We extracted both text and visual features. We selected ten text-based features, e.g., whether all characters in the tokens are uppercase, lowercase, or numeric; and if the first character is uppercase for a token that is not at the beginning or end of the document. Visual features represent the corner coordinates of the bounding box (bbox) of a text span. We extracted all the x and y coordinates and selected three visual features. For example, we selected x1 as features that represent the distance from the left margin to the bottom right corner of bbox. We described both features in our previous study [12]. We trained the model by combining text and visual features and achieved 81.3–96% F1-measures on the test set for seven metadata fields [12].
4.2 Figure and table extraction
In the experiments reported below, we use our dataset to evaluate machine learning models for figure extraction from scanned ETDs. In each experiment, we split the ScanBank dataset into two equal halves after randomly shuffling it. The first half will be used as the validation set to fine-tune or choose the best model during training. The second half will be used as the test set to evaluate the models.
Evaluating the pre-trained DeepFigures model using ScanBank: Siegel et al. [64] released their source code and model weights used for training DeepFigures. In this experiment, we evaluate its performance on our proposed ScanBank dataset consisting of scanned ETDs. We ran inference for DeepFigures (using the trained model weights released in [64]) on the ScanBank validation and test splits.
The DeepFigures model outputs a set of bounding boxes for each figure it detects in the page image. We filter out the bounding boxes whose confidence scores are less than 0.5. We match the predicted bounding boxes with the true bounding boxes to minimize the total Euclidean distance between the centers of the paired bounding boxes, which is an instance of the linear assignment problem described in detail in [64]. Next, we consider a predicted box as correct if its intersection over union (IOU) with its matched true box is greater than or equal to 0.8 (true positive), incorrect if less than 0.8 (false positive) [64]. When a ground truth is present in the image and the model fails to detect it, we consider it a false negative. Using these metrics, we calculate the precision, recall, and F1 scores. The choices of these thresholds are made to be consistent with the choices made in DeepFigures [64].
The “Validation” and “Testing” datasets are of scanned ETDs. The performance of DeepFigures with scanned ETDs is considerably lower than its performance on the CS-Large and PubMed datasets, indicating that it is not suitable to accurately extract figures and tables from scanned ETDs.
Evaluating the YOLOv5 model trained with ScanBank: In prior work [34] we use ScanBank to evaluate the DeepFigures model to extract figures from scanned ETDs. The best F1 score we obtained was less than 0.588. In this experiment, our aim is to achieve better performance by training the YOLOv5 model with ScanBank.
YOLO is a popular deep learning framework designed to detect multiple objects in an input image in a single inference pass. It is also well known for its low space- and time-complexity during inference, which makes it an ideal alternative for deployment on devices where low resource consumption is vital. The initial version of YOLO (YOLOv1) was proposed by Redmon et al. in 2016 [56]. This was the first work that, instead of repurposing classifiers as object detectors, framed object detection as a regression problem. YOLOv1 detects multiple bounding boxes in a single forward pass, so it can be trained end-to-end directly for detection. Many subsequent versions of YOLO were proposed by various authors in the following years. In 2020, the fifth version of YOLO (YOLOv5) was proposed [77], which achieved the best detection performance among the versions. It has four different network sizes (small, medium, large, and extra-large), which allows users to make trade-offs between the time and space complexity. We adopt the extra-large version of YOLOv5 containing about 89 million trainable parameters.
Our proposed approach is based on YOLOv5 [77], which offers better usability with superior performance on the MS COCO benchmark [43] compared to YOLOv4. The backbone network (for object detection) of YOLOv5 implements BottleneckCSP [79]. YOLOv5 chooses PANet [80] for feature aggregation and adds an SPP [26] block after BottleneckCSP to increase the receptive field and separate the most important features from the backbone [6]. In general, the models in the YOLO family have better performance and are more compact than models of similar or larger size.
We train on the ScanBank dataset with batch size of 8 and use eight-fold cross-validation to report its performance.
Before passing the input images to the model, YOLOv5 uses three methods to augment the data: scaling, color space adjustment, and mosaic augmentation. Mosaic augmentation was a novel augmentation technique when YOLOv5 was developed, which works by combining four images into four tiles with random ratios [69].
The YOLOv5 model predicts bounding boxes as deviations from a list of anchor boxes. Using K-means and a genetic algorithm, an initial set of anchor bounding boxes is learned from the training set. These anchor boxes are then used as references for learning the deviation to get the predicted bounding boxes [69].
Cross Stage Partial (CSP) networks [79] used in YOLOv5 have significantly lower number of trainable parameters and require fewer flops since they address the problem of duplicate gradients from larger convolutional networks [69] resulting in a faster inference time for YOLOv5.
Detailed results of these experiments are given in [34].
4.3 Document structure parsing
In the experiment reported in the following, we use our ChapterParse dataset to train and evaluate various deep learning models to automatically parse ETDs by chapter.
For the segmentation task, we wanted to compare the performance of using single input models (image or text) with combined input of image and text. For this, we designed three deep learning models that share similar model architectures but use different inputs. This allowed us to compare their performance. Figure 10 shows the architecture of the model using the combined input of image and text. Single-input models follow a similar design, but do not use the linear combination layer.

Segmentation deep learning architecture (combined input)
Each page is considered a frame in a sequence. Using Python packages pdf2image [4] and PyMUPDF [1], page images and text are extracted. Images are converted into features using pre-trained VGG16 [65], and in separate experiments the text is converted into GloVe [52] and fastText [7] embeddings.
The combined input model was tested on the manually labeled dataset discussed above. Table 6 shows a performance comparison of the two embeddings on manually labeled ETDs from arXiv.
Using GloVe, the model shows slightly better performance at identifying chapter starts. The model using fastText does better with the front-matter and end-matter.
4.4 Language models
An important task for natural language processing and understanding is language modeling. It is often used in tasks where the output requires text generation [30]. Language modeling has applications in information retrieval [70], text classification [28], and summarization [19]. Language models use various statistical methods to determine the probability that a next word will occur in a sentence [5]. The model uses various probabilistic approaches to model the language in sentences.
There are various ways to create language models. Attention-based transformers introduced in [78] described a new way to handle sequence-to-sequence problems. Recurrent neural network (RNN)-based encoder–decoders are typically very time-consuming when dealing with long sequences, as they work on each element of a sequence, one at a time. Transformer-based encoder-decoder architectures rely on the attention mechanism to draw global dependencies between the input and the output [78]. Attention-based transformers use the self-attention mechanism to determine the importance of words in a sentence.
Language models like BERT [18], SciBERT [3], and RoBERTa [45] use transformer-based mechanisms. BERT [18] is a transformer-based encoder architecture that has been trained on English Wikipedia articles and the BookCorpus,Footnote 15 a large collection of free novels written by unpublished authors. SciBERT [3] is another pre-trained language model that has been trained using a corpus of 1.14 million computer science and biomedical papers from Semantic Scholar. Language models need to be trained on the target dataset to capture the uniqueness of the text and to be exposed to its vocabulary.
Since existing pretrained language models are often trained on sentences from news articles, book or movie reviews, or other general-domain text corpora, they are inadequate for modeling the language of ETDs. Even pretrained models built specifically for scientific language (e.g., SciBERT [3]) fail to capture the immense subject-matter diversity and vocabulary of the multidisciplinary ETD corpus. However, these pre-trained models may be fine-tuned with additional training data to incorporate new vocabulary and thus create a custom language model for ETDs.
We discuss the importance of extracting clean text in Sect. 3.4. Here, we demonstrate how noisy text negatively affects the intrinsic quality of a language model. We start by fine-tuning BERT with text from ETDs. We create two language models: (LM1) with the text from an entire ETD and (LM2) with the noisy front-matter removed (e.g., title page, tables of contents, list of figures, and abbreviations) by simply skipping the first 450 lines of the ETD.
Table 7 reports the perplexity scores for the two models—lower is better. Both LM1 and LM2 were fine-tuned using the same BERT-based model with the same ETDs. The only difference is that the front matter was removed from LM2. The difference in the perplexity score is remarkable. This simple experiment demonstrates the importance of document layout analysis, chapter segmentation, and figure and table extraction when building language models.
5 Future work
5.1 Data cleaning and enrichment
To support building existing and future benchmark datasets for ETD mining, we have collected a corpus consisting of about 500K ETDs crawled from library repositories at U.S. universities. ETDs in this corpus cover multiple domains and years ranging from 1875 to 2021 [76]. The dataset contains raw metadata, imported directly from university library OAI-PMH portals, and PDF files. A preliminary evaluation of the dataset discovered that the raw metadata contains incomplete fields and/or inconsistent values, such as missing publication year, advisor name, and program names different from what is shown in the PDF. Complete and accurate metadata are crucial for data analysis, data linking, and machine learning model training. Therefore, it is necessary to clean ETD metadata to improve its quality. Additionally, new metadata and data can be derived from ETDs and save preprocessing time for future analytical and learning tasks.
Metadata Cleansing and Canonicalization In a preliminary analysis, we found that approximately 14% of ETDs we collected do not have publication year information in the library provided metadata. About 25% of ETDs do not have advisor information, and about 50% do not have department information. By combining text and visual information of samples in the ETD500 dataset, we developed a model that automatically extracts seven key ETD metadata information from cover pages of ETDs [12]. Metadata extracted by this model can potentially be used for providing values of missing fields.
We also observed that certain fields of metadata may contain multiple values that can be mapped to the same entities. For example, publication dates may have different metadata formats, such as “mm-dd-yy” or “yyyy-mm-dd.” Even within the same repository, metadata fields may have different strings. Common cases include abbreviations (e.g., “jhu” and “Johns Hopkins University”) and extra spaces (e.g., “Texas A &M University” and “Texas A & M University”). It is infeasible to use a single method to canonically organize all fields, so we design custom methods for different fields. For example, canonicalizing the “date” field can be performed by building a set of regular expressions that match known date formats and converting them into a standard format. The university field can be canonicalized by comparing a university name with a dictionary of all known university names and their abbreviations.Footnote 16
Therefore, one future work is to develop a pipeline that integrates AutoMeta, i.e., automatically extracts metadata from PDF files, and uses it to correct missing fields and metadata errors. The challenge is to fix errors and fill gaps, while not introducing errors. Developing a rollback mechanism is also necessary in case metadata fields are inappropriately altered. Crowdsourcing effort may be involved to evaluate the automatically extracted metadata and identify challenging cases that are error prone for automatic corrections.
Enriching Data We will enrich our current data by providing more data derived from PDFs, such as references, external links, and data usage. For references, existing citation parsers, such as ParsCit [17] and Neural-ParsCit [54], are trained on the CORA dataset [62], which contains only citation strings in Computer Science. We are working on a transformer-based model trained on 1 billion synthesized citation strings in multiple domains [75]. Parsing reference strings with allow us to enrich metadata by linking ETDs to millions of papers in public digital library corpus such as S2ORC [46]. For external links, we are interested in extracting URLs linking to open-access datasets and software (OADS). Mining accessible OADS can be important for assessment of computational reproducibility of scientific research. We have developed a supervised model to classify URLs into OADS-URLs and non-OADS-URLs [59]. The classifier achieved an F1=0.92 on a manually labeled dataset curated from ETDs and journal articles. In the future, we will apply this classifier on all ETDs and extract OADS-URLs. For data usage, we will enrich metadata by registering ETDs that are selected for different datasets and papers. For example, we will mark ETDs used in the ETD500, ScanBank, and ChapterParse datasets. This will allow future projects to access the enriched metadata and other derived data (see below).
5.2 Classifying and summarizing extracted document elements
ETDs typically have an abstract and other descriptive metadata, such as subject terms and keywords. This metadata describes the work as a whole. Building on our work aimed at segmenting ETDs into their constituent chapters, we employ machine learning techniques for classification and summarization to provide description at the chapter level. Chapter-level description serves to improve access and discoverability of individual chapters, helps users find the best entry point into the document, and facilitates the creation of intelligent digital library services. Previous work [31] evaluates chapter-level classification using traditional machine learning and deep learning. A limitation of this work is the lack of effective tools to accurately segment an ETD into chapters.
The summarization of ETDs presents unique challenges [29]. First, most state-of-the-art summarization models were trained on news corpora and other highly specialized datasets. The writing style of a news article is very different from the writing style of a scholarly document. ETDs have a variety of writing styles and formats. Thus, making sure that the model has been exposed to such specific, yet highly diverse, writing is imperative. Second, existing methods fail to capture the context of the entire document when summarizing. However, as discussed, context matters, as the document has a unifying theme. We want to create summaries of chapters that help provide a gist of the research in each of them while preserving the context of the whole document. We are working toward creating a transformer-based encoder-decoder architecture built using our ETD language model to help with chapter-level summarization that is capable of handling long sequences of text.
5.3 An integrated framework on ETD segmentation
The benchmark datasets that we present in this paper can help to build an integrated ETD segmentation framework, in which the input is a single ETD in PDF format, and the output is a set of files including a JSON file that contains all metadata, chapter-level text (including acknowledgments, etc.), section-level text, sub-section-level text (e.g., paragraphs) and references (see Table 1). The output should also include non-text document elements such as figures, tables, math equations (e.g., [49, 84]). The whole process can be divided into three steps. In the first step, the ETD pages can be classified into different types (Table 2) based on the textual and visual information. In the second step, the content of a page is parsed using a customized parser, depending on the page type and textual and non-textual content are extracted. For example, key metadata can be extracted from the front cover, and chapter text can be extracted from chapters. Reference strings are also parsed into individual fields. In the third step, an XML or JSON file is generated by integrating various types of content extracted from individual pages with citation marks that refer to figures, tables, and math equations, which are saved separately.
6 Conclusion
We have presented datasets for metadata extraction, layout analysis, and figure extraction from ETDs. We give examples of how we are using these datasets to compare and evaluate machine learning models for solving problems unique to ETDs. We propose that the effective integration of tools for extracting metadata and key document elements will lead to more intelligent digital library services.
Of course, this work is not without limitations. The two main limitations of our datasets are size and sampling. These datasets are relatively small, especially relative to the enormous numbers of publicly available ETDs. While they are sufficient for evaluating and testing many machine learning models, they may not be large enough to produce training examples for deep learning models without additional data. With regard to sampling, we selected from available sources. In creating some of our datasets, we sampled ETDs from MIT’s theses collection and from the arXiv.org pre-print repository. As such, those datasets are heavily biased toward STEM fields. We chose MIT’s theses collection because of its large percentage of scanned ETDs, and we chose arXiv because of the availability of LaTeX source code. It was impossible for us to produce all of the generated datasets by using the same sampling methods. This was because some models were trained by synthesizing data that required an ETD collection with special characteristics (e.g., authored with LaTeX). Ideally, we would have created a single dataset containing ETDs labeled such that they could be used for multiple tasks. We leave that to future work.
Notes
See https://tei-c.org/.
See http://handle.net/.
For brevity, we often use the term figure for a figure or a table.
See https://arxiv.org.
References
Artifex: PyMuPDF (2016). https://pymupdf.readthedocs.io/
Barthelmé, S., Trukenbrod, H., Engbert, R., et al.: Modelling fixation locations using spatial point processes. J. Vis. 13(12), 1 (2013). https://doi.org/10.1167/13.12.1
Beltagy, I., Lo, K., Cohan, A.: SciBERT: a pretrained language model for scientific text. In: Inui, K., Jiang, J., Ng, V. et al. (eds.) Proceedings of the 2019 Conference on Empirical Methods in Natural Language Processing and the 9th International Joint Conference on Natural Language Processing, EMNLP-IJCNLP 2019, Hong Kong, China, November 3–7, 2019 pp 3613–3618. Association for Computational Linguistics. https://doi.org/10.18653/v1/D19-1371
Belval, E.: pdf2image (2017). https://pypi.org/project/pdf2image/
Bengio, Y., Ducharme, R., Vincent, P.: A neural probabilistic language model. In: Leen, T.K., Dietterich, T.G., Tresp, V.: (eds.) Advances in Neural Information Processing Systems 13, Papers from Neural Information Processing Systems (NIPS) 2000, Denver, CO, USA, pp. 932–938. MIT Press (2000). https://proceedings.neurips.cc/paper/2000/hash/728f206c2a01bf572b5940d7d9a8fa4c-Abstract.html
Bochkovskiy, A., Wang, C., Liao, H.M.: YOLOv4: optimal speed and accuracy of object detection (2020). arXiv:2004.10934
Bojanowski, P., Grave, E., Joulin, A., et al.: Enriching word vectors with subword information (2016). https://doi.org/10.48550/arXiv.1607.04606
Chacon, I.A., Sosnovsky, S.A.: Expanding the web of knowledge: one textbook at a time. In: Atzenbeck, C., Rubart, J., Millard, D.E. (eds.) Proceedings of the 30th ACM Conference on Hypertext and Social Media, HT 2019, Hof, Germany, September 17–20, 2019, pp. 9–18. ACM (2019). https://doi.org/10.1145/3342220.3343671
Chacon, I.A., Sosnovsky, S.A.: Order out of chaos: construction of knowledge models from PDF textbooks. In: DocEng ’20: ACM Symposium on Document Engineering 2020, Virtual Event, CA, USA, September 29–October 1, 2020, pp. 8:1–8:10. ACM (2020). https://doi.org/10.1145/3395027.3419585
Chen, J., Ling, M., Li, R., et al.: VIS30K: a collection of figures and tables from IEEE visualization conference publications. IEEE Trans. Visual. Comput. Graph. 27(9), 3826–3833 (2021). https://doi.org/10.1109/TVCG.2021.3054916
Choudhury, M.H., Wu, J., Ingram, W. A., et al.: A heuristic baseline method for metadata extraction from scanned electronic theses and dissertations. In: Huang, R., Wu, D., Marchionini, G. et al. (eds.) JCDL ’20: Proceedings of the ACM/IEEE Joint Conference on Digital Libraries in 2020, Virtual Event, China, August 1–5, 2020, pp. 515–516. ACM (2020). https://doi.org/10.1145/3383583.3398590
Choudhury, M.H., Jayanetti, H.R., Wu, J., et al.: Automatic metadata extraction incorporating visual features from scanned electronic theses and dissertations. In: Downie, J.S., McKay, D., Suleman, H. et al. (eds.) ACM/IEEE Joint Conference on Digital Libraries, JCDL 2021, Champaign, IL, USA, September 27–30, 2021, pp. 230–233. IEEE (2021). https://doi.org/10.1109/JCDL52503.2021.00066
Choudhury, S.R., Tuarob, S., Mitra, P., et al.: A figure search engine architecture for a chemistry digital library. In: 13th ACM/IEEE-CS Joint Conference on Digital Libraries, JCDL ’13, Indianapolis, IN, USA, July 22–26, 2013, pp. 369–370 (2013). https://doi.org/10.1145/2467696.2467757
Clark, C.A., Divvala, S.K.: Looking beyond text: extracting figures, tables and captions from computer science papers. In: Scholarly Big Data: AI Perspectives, Challenges, and Ideas, Papers from the 2015 AAAI Workshop, Austin, Texas, USA, January 2015 (2015). http://aaai.org/ocs/index.php/WS/AAAIW15/paper/view/10092
Clark, C.A., Divvala, S.K.: PDFFigures 2.0: mining figures from research papers. In: Adam, N.R., Cassel L.B., Yesha Y. et al. (eds.) Proceedings of the 16th ACM/IEEE-CS on Joint Conference on Digital Libraries, JCDL 2016, Newark, NJ, USA, June 19–23, 2016, pp. 143–152. ACM (2016). https://doi.org/10.1145/2910896.2910904
Cornell: arXiv: a free distribution service and an open-access archive for 2,151,776 scholarly articles in the fields of physics, mathematics, computer science, quantitative biology, quantitative finance, statistics, electrical engineering and systems science, and economics (2022). https://arxiv.org/
Councill, I., Giles, C.L., Kan, M. Y.: ParsCit: an open-source CRF reference string parsing package. In: Proceedings of the Sixth International Conference on Language Resources and Evaluation (LREC’08), Marrakech, Morocco (2008). https://aclanthology.org/L08-1291/
Devlin, J., Chang, M., Lee, K., et al.: BERT: pre-training of deep bidirectional transformers for language understanding. In: Burstein, J., Doran, C., Solorio, T. (eds.) Proceedings of the 2019 Conference of the North American Chapter of the Association for Computational Linguistics: Human Language Technologies, NAACL-HLT 2019, Minneapolis, MN, USA, June 2–7, 2019, Volume 1 (Long and Short Papers), pp. 4171–4186. Association for Computational Linguistics(2019). https://doi.org/10.18653/v1/n19-1423
Dong, L., Yang, N., Wang, W., et al.: Unified language model pre-training for natural language understanding and generation. In: Wallach, H. M., Larochelle, H., Beygelzimer, A. et al. (eds.) Advances in Neural Information Processing Systems 32: Annual Conference on Neural Information Processing Systems 2019, NeurIPS 2019, December 8–14, 2019, Vancouver, BC, Canada, pp. 13,042–13,054 (2019). https://proceedings.neurips.cc/paper/2019/hash/c20bb2d9a50d5ac1f713f8b34d9aac5a-Abstract.html
Dutta, A., Zisserman, A.: The VIA annotation software for images, audio and video. In: Amsaleg, L., Huet, B., Larson, M.A. et al. (eds.) Proceedings of the 27th ACM International Conference on Multimedia, MM 2019, Nice, France, October 21–25, 2019, pp 2276–2279. ACM (2019). https://doi.org/10.1145/3343031.3350535
Dutta, A., Gupta, A., Zissermann, A.: VGG image annotator (VIA) Version: 2.0.9(2016). http://www.robots.ox.ac.uk/~vgg/software/via/
Fox, E.A.: How to make intelligent digital libraries. In: Ras, Z.W., Zemankova, M. (eds.) Methodologies for Intelligent Systems, 8th International Symposium, ISMIS ’94, Charlotte, North Carolina, USA, October 16–19, 1994, Proceedings, Lecture Notes in Computer Science, vol 869, pp. 27–38. Springer (1994). https://doi.org/10.1007/3-540-58495-1_3
Gong, M., Wei, X., Oyen, D., et al.: Recognizing figure labels in patents. In: Veyseh, A.P.B., Dernoncourt, F., Nguyen, T.H. et al. (eds.) Proceedings of the Workshop on Scientific Document Understanding co-located with 35th AAAI Conference on Artificial Inteligence, SDUAAAI 2021, Virtual Event, February 9, 2021, CEUR Workshop Proceedings, vol 2831. CEUR-WS.org (2021). http://ceur-ws.org/Vol-2831/paper11.pdf
Han, H., Giles, C.L., Manavoglu, E., et al.: Automatic document metadata extraction using support vector machines. In: ACM/IEEE 2003 Joint Conference on Digital Libraries (JCDL 2003), May 27–31 2003, Houston, Texas, USA, Proceedings, pp. 37–48. IEEE Computer Society (2003). https://doi.org/10.1109/JCDL.2003.1204842
Hansen, M., Pomp, A., Erki, K., et al.: Data-driven recognition and extraction of PDF document elements. Technologies (2019). https://doi.org/10.3390/technologies7030065
He, K., Zhang, X., Ren, S., et al.: Spatial pyramid pooling in deep convolutional networks for visual recognition. In: Fleet, D.J,, Pajdla, T., Schiele, B. et al. (eds.) Computer Vision - ECCV 2014 - 13th European Conference, Zurich, Switzerland, 6–12 September 2014, Proceedings, Part III, Lecture Notes in Computer Science, vol 8691, pp. 346–361. Springer (2014). https://doi.org/10.1007/978-3-319-10578-9_23
He, K., Zhang, X., Ren, S., et al.: Deep residual learning for image recognition (2015). https://doi.org/10.48550/arXiv.1512.03385
Howard, J., Ruder, S.: Universal language model fine-tuning for text classification. In: Gurevych, I., Miyao, Y. (eds.) Proceedings of the 56th Annual Meeting of the Association for Computational Linguistics, ACL 2018, Melbourne, Australia, July 15–20, 2018. Volume 1: Long Papers, pp. 328–339. Association for Computational Linguistics (2018). https://doi.org/10.18653/v1/P18-1031
Ingram, W.A., Banerjee, B., Fox, E.A.: Summarizing ETDs with deep learning. Cadernos BAD (Cadernos de Biblioteconomia, Arquivística e Documentação) 1, 46–52 (2020). https://doi.org/10.48798/cadernosbad.2014
Jelinek, F.: Markov Source Modeling of Text Generation, pp. 569–591. Springer, Dordrecht (1985). https://doi.org/10.1007/978-94-009-5113-6_28
Jude, P. M.: Increasing accessibility of electronic theses and dissertations (ETDs) Through Chapter-level Classification. Thesis, Virginia Tech (2020). http://hdl.handle.net/10919/99294
Kahu, S., Ingram, W.A., Fox, E.A., et al.: SampannaKahu/ScanBank: v0.2 (2021a). https://doi.org/10.5281/zenodo.4663540
Kahu, S., Ingram, W.A., Fox, E.A., et al.: The ScanBank Dataset (2021b). https://doi.org/10.5281/zenodo.4663578
Kahu, S.Y., Ingram, W.A., Fox, E.A., et al.: ScanBank: a benchmark dataset for figure extraction from scanned electronic theses and dissertations. In: Downie, J.S., McKay, D., Suleman, H. et al. (eds.) ACM/IEEE Joint Conference on Digital Libraries, JCDL 2021, Champaign, IL, USA, September 27–30, 2021, pp. 180–191. IEEE (2021c). https://doi.org/10.1109/JCDL52503.2021.00030
Kern, R., Jack, K., Hristakeva, M., et al.: TeamBeam—meta-data extraction from scientific literature. D. Lib. Mag. (2012). https://doi.org/10.1045/july2012-kern
Khabsa, M., Giles, C.L.: The number of scholarly documents on the public web. PLOS ONE 9(5), 1–6 (2014). https://doi.org/10.1371/journal.pone.0093949
Koudas, N., Li, R., Xarchakos, I.: Video monitoring queries. In: 36th IEEE International Conference on Data Engineering, ICDE 2020, Dallas, TX, USA, April 20–24, 2020. IEEE, pp. 1285–1296 (2020). https://doi.org/10.1109/ICDE48307.2020.00115
Kunze, J.A., Baker, T.: The Dublin Core metadata element set (2007). https://doi.org/10.17487/RFC5013
Laroca, R., Severo, E., Zanlorensi, L.A., et al.: A robust real-time automatic license plate recognition based on the YOLO detector. In: 2018 International Joint Conference on Neural Networks, IJCNN 2018, Rio de Janeiro, Brazil, July 8–13, 2018, pp. 1–10. IEEE (2018). https://doi.org/10.1109/IJCNN.2018.8489629
Lee, B.C.G., Mears, J., Jakeway, E., et al.: The newspaper navigator dataset: extracting and analyzing visual content from 16 million historic newspaper pages in chronicling America (2020). https://doi.org/10.48550/arXiv.2005.01583
Li, M., Cui, L., Huang, S., et al.: TableBank: table benchmark for image-based table detection and recognition. In: Calzolari, N., Béchet, F., Blache, P. et al. (eds.) Proceedings of The 12th Language Resources and Evaluation Conference, LREC 2020, Marseille, France, May 11–16, 2020, pp. 1918–1925. European Language Resources Association (2020a). https://aclanthology.org/2020.lrec-1.236/
Li, M., Xu, Y., Cui, L., et al.: DocBank: a benchmark dataset for document layout analysis. In: Scott, D., Bel, N., Zong, C. (eds.) Proceedings of the 28th International Conference on Computational Linguistics, COLING 2020, Barcelona, Spain (Online), December 8–13, 2020, pp. 949–960. International Committee on Computational Linguistics (2020b). https://doi.org/10.18653/v1/2020.coling-main.82
Lin, T., Maire, M., Belongie, S.J., et al.: Microsoft COCO: common objects in context. In: Fleet, D.J,, Pajdla, T., Schiele, B. et al. (eds.) Computer Vision - ECCV 2014 - 13th European Conference, Zurich, Switzerland, September 6–12, 2014, Proceedings, Part V, Lecture Notes in Computer Science, vol. 8693, pp. 740–755. Springer (2014). https://doi.org/10.1007/978-3-319-10602-1_48
Ling, M., Chen, J., Möller, T., et al.: Document domain randomization for deep learning document layout extraction (2021). https://doi.org/10.48550/arXiv.2105.14931
Liu, Y., Ott, M., Goyal, N., et al.: RoBERTa: a robustly optimized BERT pretraining approach (2019). https://doi.org/10.48550/arXiv.1907.11692
Lo, K., Wang, L.L., Neumann, M., et al.: S2ORC: the semantic scholar open research corpus. In: Proceedings of the 58th Annual Meeting of the Association for Computational Linguistics, pp. 4969–4983. Association for Computational Linguistics, Online (2020). https://doi.org/10.18653/v1/2020.acl-main.447
Lopez, P.: GROBID: combining automatic bibliographic data recognition and term extraction for scholarship publications. In: Agosti, M., Borbinha, J., Kapidakis, S. et al. (eds.) Research and Advanced Technology for Digital Libraries, 13th European Conference, ECDL 2009, Corfu, Greece, September 27–October 2, 2009. Proceedings, Lecture Notes in Computer Science, vol 5714, pp. 473–474. Springer (2009). https://doi.org/10.1007/978-3-642-04346-8_62
Lynch, C.A., Parastatidis, S., Jacobs, N., et al.: The OAI-ORE effort: progress, challenges, synergies. In: Rasmussen, E.M., Larson, R.R., Toms, E.G. et al. (eds.) ACM/IEEE Joint Conference on Digital Libraries, JCDL 2007, Vancouver, BC, Canada, June 18–23, 2007. Proceedings, p. 80. ACM (2007).https://doi.org/10.1145/1255175.1255190
Mali, P., Kukkadapu, P., Mahdavi, M., et al.: ScanSSD: scanning single shot detector for mathematical formulas in PDF document images (2020). https://doi.org/10.48550/arXiv.2003.08005
Manzoor, J.A.: Segmenting electronic theses and dissertations by chapters. MS thesis, Virginia Tech, Computer Science, defended September 23, 2022 (2022). http://hdl.handle.net/10919/113246
Nasar, Z., Jaffry, S.W., Malik, M.K.: Information extraction from scientific articles: a survey. Scientometrics 117(3), 1931–1990 (2018). https://doi.org/10.1007/s11192-018-2921-5
Pennington, J., Socher, R., Manning, C.D.: GloVe: Global vectors for word representation. In: EMNLP, pp. 1532–1543 (2014). https://nlp.stanford.edu/projects/glove/
Perez, L., Wang, J: The effectiveness of data augmentation in image classification using deep learning (2017). arXiv:1712.04621
Prasad, A., Kaur, M., Kan, M.Y.: Neural ParsCit: a deep learning-based reference string parser. Int. J. Digit. Libr. 19(4), 323–337 (2018). https://doi.org/10.1007/s00799-018-0242-1
Rausch, J., Martinez, O., Bissig, F., et al.: DocParser: Hierarchical document structure parsing from renderings. In: Thirty-Fifth AAAI Conference on Artificial Intelligence, AAAI 2021, Thirty-Third Conference on Innovative Applications of Artificial Intelligence, IAAI 2021, The Eleventh Symposium on Educational Advances in Artificial Intelligence, EAAI 2021, Virtual Event, February 2–9, 2021, pp. 4328–4338. AAAI Press (2021). https://doi.org/10.1609/aaai.v35i5.16558
Redmon, J., Divvala, S.K., Girshick, R.B., et al.: You only look once: Unified, real-time object detection. In: 2016 IEEE Conference on Computer Vision and Pattern Recognition, CVPR 2016, Las Vegas, NV, USA, June 27–30, 2016, pp. 779–788. IEEE Computer Society (2016). https://doi.org/10.1109/CVPR.2016.91
Ren, Z., He, X., Zheng, H., et al.: Spatio-temporal patterns of urban forest basal area under China’s rapid urban expansion and greening: Implications for urban green infrastructure management. Forests (2018). https://doi.org/10.3390/f9050272
Saier, T., Färber, M.: unarXive: a large scholarly data set with publications’ full-text, annotated in-text citations, and links to metadata. Scientometrics 125(3), 3085–3108 (2020). https://doi.org/10.1007/s11192-020-03382-z
Salsabil, L., Wu, J., Choudhury, M.H., et al.: A Study of Computational Reproducibility using URLs Linking to Open Access Datasets and Software. In: Laforest, F., Troncy, R., Simperl, E. et al. (eds.) Companion of The Web Conference 2022, Virtual Event / Lyon, France, April 25–29, 2022, pp. 784–788. ACM (2022). https://doi.org/10.1145/3487553.3524658
Sermanet, P., Eigen, D., Zhang, X., et al.: OverFeat: integrated recognition, localization and detection using convolutional networks. In: Bengio, Y., LeCun, Y. (eds.) 2nd International Conference on Learning Representations, ICLR 2014, Banff, AB, Canada, April 14–16, 2014. Conference Track Proceedings (2014). https://doi.org/10.48550/arXiv.1312.6229
Seymore, K., Mccallum, A., Rosenfeld, R.: Learning hidden Markov model structure for information extraction. In: AAAI ’99 Workshop on Machine Learning for Information Extraction (1999a). https://www.aaai.org/Papers/Workshops/1999/WS-99-11/WS99-11-007.pdf
Seymore, K., Mccallum, A., Rosenfeld, R.: Learning hidden markov model structure for information extraction. In: AAAI ’99 Workshop on Machine Learning for Information Extraction (1999b)
Shah, A.K., Dey, A., Zanibbi, R.: A Math Formula Extraction and Evaluation Framework for PDF Documents. In: Document Analysis and Recognition—ICDAR2021: 16th International Conference, Lausanne, Switzerland, September 5–10, 2021, pp. 19–34, Proceedings, Part II. Springer-Verlag, Berlin, Heidelberg, (2021) https://doi.org/10.1007/978-3-030-86331-9_2
Siegel, N., Lourie, N., Power, R., et al: Extracting scientific figures with distantly supervised neural networks. In: Chen, J., Gonçalves, M.A., Allen, J.M. et al. (eds.) Proceedings of the 18th ACM/IEEE on Joint Conference on Digital Libraries, JCDL 2018, Fort Worth, TX, USA, June 3–7, 2018, pp. 223–232. ACM (2018).https://doi.org/10.1145/3197026.3197040
Simonyan, K., Zisserman, A.: Very deep convolutional networks for large-scale image recognition (2014). https://doi.org/10.48550/ARXIV.1409.1556
Singer-Vine, J., Jain, S.: PDFPlumber (2022). https://github.com/jsvine/pdfplumber
Smith, M., Barton, M., Branschofsky, M., et al.: DSpace: an open source dynamic digital repository. D-Lib Mag. (2003). https://doi.org/10.1045/january2003-smith
Smith, R.: An Overview of the Tesseract OCR Engine. In: 9th International Conference on Document Analysis and Recognition (ICDAR 2007), September 23–26, 2007, Curitiba, Paraná, Brazil, pp. 629–633. IEEE Computer Society (2007). https://doi.org/10.1109/ICDAR.2007.4376991
Solawetz, J.: YOLOv5 New Version—Improvements And Evaluation (2020). https://blog.roboflow.com/yolov5-improvements-and-evaluation/
Song, F., Croft, W.B.: A general language model for information retrieval. In: Proceedings of the 1999 ACM CIKM International Conference on Information and Knowledge Management, Kansas City, Missouri, USA, November 2–6, 1999, pp. 316–321. ACM (1999). https://doi.org/10.1145/319950.320022
Taira, R.K., Soderland, S.G.: A statistical natural language processor for medical reports. In: Proceedings AMIA Symposium, pp. 970–974 (1999). https://pubmed.ncbi.nlm.nih.gov/10566505
Tanner, M.A.: Tools for statistical inference: observed data and data augmentation methods, vol 67. Springer Science & Business Media (2012). https://doi.org/10.1007/978-1-4684-0510-1
Tkaczyk, D., Szostek, P., Bolikowski, L.: GROTOAP2 - the methodology of creating a large ground truth dataset of scientific articles. D. Lib. Mag. (2014). https://doi.org/10.1045/november14-tkaczyk
Tkaczyk, D., Szostek, P., Fedoryszak, M., et al.: CERMINE: automatic extraction of structured metadata from scientific literature. Int. J. Document Anal. Recognit. (IJDAR) 18(4), 317–335 (2015). https://doi.org/10.1007/s10032-015-0249-8
Uddin, M.S.: TransParsCit: a transformer-based citation parser trained on large-scale synthesized data. Master of Science Thesis, Old Dominion University (2022). https://doi.org/10.25777/qrv9-m891
Uddin, S., Banerjee, B., Wu, J., et al.: Building A large collection of multi-domain electronic theses and dissertations. In: Chen, Y., Ludwig, H., Tu, Y. et al. (eds.) 2021 IEEE International Conference on Big Data (Big Data), Orlando, FL, USA, December 15–18, 2021, pp. 6043–6045. IEEE (2021). https://doi.org/10.1109/BigData52589.2021.9672058
Ultralytics YOLOv5 (2020). https://github.com/ultralytics/yolov5
Vaswani, A., Shazeer, N., Parmar, N., et al.: Attention is all you need. In: Guyon, I., von Luxburg, U., Bengio, S. et al. (eds.) Advances in Neural Information Processing Systems 30: Annual Conference on Neural Information Processing Systems 2017, December 4–9, 2017, Long Beach, CA, USA, pp. 5998–6008 (2017). https://proceedings.neurips.cc/paper/2017/hash/3f5ee243547dee91fbd053c1c4a845aa-Abstract.html
Wang, C., Liao, H.M., Wu, Y., et al.: CSPNet: a new backbone that can enhance learning capability of CNN. In: 2020 IEEE/CVF Conference on Computer Vision and Pattern Recognition, CVPR Workshops 2020, Seattle, WA, USA, June 14–19 2020 IEEE, pp. 1571–1580 (2020). https://doi.org/10.1109/CVPRW50498.2020.00203
Wang, K., Liew, J.H., Zou, Y., et al.: PANet: Few-shot image semantic segmentation with prototype alignment. In: 2019 IEEE/CVF International Conference on Computer Vision, ICCV 2019, Seoul, Korea (South), October 27–November 2, 2019, pp. 9196–9205. IEEE (2019). https://doi.org/10.1109/ICCV.2019.00929
Weibel, S.L., Koch, T.: Dublin Core Metadata Initiative: Mission, current activities, and future directions. D. Lib. Mag. (2000). https://doi.org/10.1045/december2000-weibel
Wu, J., Sefid, A., Ge, A.C., et al.: A supervised learning approach to entity matching between scholarly big datasets. In: Corcho Ó, Janowicz, K., Rizzo, G. et al. (eds.) Proceedings of the Knowledge Capture Conference, K-CAP 2017, Austin, TX, USA, December 4–6, 2017, pp. 41:1–41:4. ACM (2017). https://doi.org/10.1145/3148011.3154470
Xu, Y., Li, M., Cui, L., et al.: LayoutLM: Pre-training of text and layout for document image understanding. In: Gupta, R., Liu, Y., Tang, J. et al. (eds.) KDD ’20: The 26th ACM SIGKDD Conference on Knowledge Discovery and Data Mining, Virtual Event, CA, USA, August 23–27, 2020, pp. 1192–1200. ACM (2020). https://doi.org/10.1145/3394486.3403172
Zanibbi, R., Blostein, D.: Recognition and retrieval of mathematical expressions. Int. J. Document Anal. Recognit. 15(4), 331–357 (2012). https://doi.org/10.1007/s10032-011-0174-4
Zhong, X., Tang, J., Jimeno-Yepes, A.: PubLayNet: largest dataset ever for document layout analysis (2019). https://doi.org/10.48550/arXiv.1908.07836
Acknowledgements
This project was made possible in part by the Institute of Museum and Library Services [LG-37-19-0078-19]. We are grateful for the technical support from John Pratt (ODU) and financial support from Amazon Web Services.
Author information
Authors and Affiliations
Corresponding author
Additional information
Publisher's Note
Springer Nature remains neutral with regard to jurisdictional claims in published maps and institutional affiliations.
Rights and permissions
Open Access This article is licensed under a Creative Commons Attribution 4.0 International License, which permits use, sharing, adaptation, distribution and reproduction in any medium or format, as long as you give appropriate credit to the original author(s) and the source, provide a link to the Creative Commons licence, and indicate if changes were made. The images or other third party material in this article are included in the article’s Creative Commons licence, unless indicated otherwise in a credit line to the material. If material is not included in the article’s Creative Commons licence and your intended use is not permitted by statutory regulation or exceeds the permitted use, you will need to obtain permission directly from the copyright holder. To view a copy of this licence, visit http://creativecommons.org/licenses/by/4.0/.
About this article

Cite this article
Ingram, W.A., Wu, J., Kahu, S.Y. et al. Building datasets to support information extraction and structure parsing from electronic theses and dissertations. Int J Digit Libr (2024). https://doi.org/10.1007/s00799-024-00395-4
Received:
Revised:
Accepted:
Published:
DOI: https://doi.org/10.1007/s00799-024-00395-4