
Abstract
Data analytics are moving beyond the limits of a single platform. In this paper, we present the cost-based optimizer of Rheem, an open-source cross-platform system that copes with these new requirements. The optimizer allocates the subtasks of data analytic tasks to the most suitable platforms. Our main contributions are: (i) a mechanism based on graph transformations to explore alternative execution strategies; (ii) a novel graph-based approach to determine efficient data movement plans among subtasks and platforms; and (iii) an efficient plan enumeration algorithm, based on a novel enumeration algebra. We extensively evaluate our optimizer under diverse real tasks. We show that our optimizer can perform tasks more than one order of magnitude faster when using multiple platforms than when using a single platform.
1 Introduction
Modern data analytics are characterized by (i) increasing query/taskFootnote 1 complexity, (ii) heterogeneity of data sources, and (iii) a proliferation of data processing platforms (platforms, for short). Examples of such analytics include: (i) North York hospital that needs to process 50 diverse datasets that run on a dozen different platforms [34]; (ii) Airline companies that need to analyze large datasets of different data formats, produced by different departments, and residing on multiple data sources, so as to produce global reports for decision makers [51]; (iii) Oil and gas companies that need to process large amounts of diverse data spanning various platforms [10, 32]; (iv) Data warehouse applications that require data to be moved from a MapReduce-like system into a DBMS for further analysis [24, 59]; (v) Business intelligence applications that typically require an analytic pipeline composed of different platforms [61]; and (vi) Machine learning systems that use multiple platforms to improve performance significantly [15, 41].
Cross-platform data processing As a result, today’s data analytics often need to perform cross-platform data processing, i.e., running their tasks on more than one platform. Research and industry communities have identified this need [5, 62] and have proposed systems to support different aspects of cross-platform data processing [4, 7, 13, 25, 27, 30]. We have identified four situations in which an application requires support for cross-platform data processing [4, 40]:
- (1):
-
Platform independence: Applications run an entire task on a single platform but may require switching platforms for different input datasets or tasks usually with the goal of achieving better performance.
- (2):
-
Opportunistic cross-platform: Applications might benefit performance-wise from using multiple platforms to run one single task.
- (3):
-
Mandatory cross-platform: Applications may require multiple platforms because the platform where the input data resides, e.g., PostgreSQL, cannot perform the incoming task, e.g., a machine learning task. Thus, data should be moved from the platform in which it resides to another platform.
- (4):
-
Polystore: Applications may require multiple platforms because the input data is stored on multiple data stores, e.g., in a data lake setting.
Current practice The current practice to cope with cross-platform requirements is either to build specialized systems that inherently combine two or more platforms, such as HadoopDB [2], or to write ad-hoc programs to glue different specialized platforms together [7, 8, 13, 26, 48]. The first approach results in being tied to specific platforms, which can either become outdated or outperformed by newer ones. Re-implementing such specialized systems to incorporate newer systems is very often prohibitively time-consuming. Although the second approach is not coupled with specific platforms, it is expensive, error-prone, and requires expertise on different platforms to achieve high efficiency.
Need for a systematic solution Thus, there is a need for a systematic solution that decouples applications from the underlying platforms and enables efficient cross-platform data processing, transparently from applications and users. The ultimate goal would be to replicate the success of DBMSs for cross-platform applications: Users formulate platform-agnostic data analytic tasks, and an intermediate system decides on which platforms to execute each (sub)task with the goal of minimizing cost (e.g., runtime or monetary cost). Recent research works have taken first steps toward that direction [25, 30, 61, 63]. Nonetheless, they all lack important aspects. For instance, none of these works considers different alternatives for data movement and as a result they may hinder cross-platform opportunities. Recently, commercial engines, such as DB2 [22], have extended their systems to support different platforms, but none provides a systematic solution: Users still have to specify the platform to use.
Cost-based cross-platform optimization The key component for a systematic solution is a cross-platform optimizer, which is the focus of this paper. Concretely, we consider the problem of finding an execution plan able to run across multiple platforms that minimizes the execution cost of a given task. A very first solution would be a rule-based optimizer: e.g., execute a task on a centralized/distributed platform when the input data is small/large. However, this approach is neither practical nor effective. First, setting rules at the task level implicitly assumes that all the operations in a task have the same computational complexity and input cardinality. Such assumptions do not hold in practice, though. Second, the cost of a task on any given platform depends on many input parameters, which hampers a rule-based optimizer’s effectiveness as it oversimplifies the problem. Third, as new platforms and applications emerge, maintaining a rule-based optimizer becomes very cumbersome. We thus pursue a cost-based approach instead.
Challenges Devising a cost-based optimizer for cross-platform settings is challenging for many reasons: (i) Platforms vastly differ in their supported operations; (ii) the optimizer must consider the cost of moving data across platforms; (iii) the optimization search space is exponential with the number of atomic operations in a task; (iv) cross-platform settings are characterized by high uncertainty, i.e., data distributions are typically unknown, and cost functions are hard to calibrate; and (v) the optimizer must be extensible to accommodate new platforms and emerging application requirements.
Contributions We delve into the cross-platform optimizer of Rheem [3, 4, 47], our open-source cross-platform system [55]. While we present the system design of Rheem in [4] and briefly discuss the data movement aspect in [43], in this paper, we describe in detail how our cost-based cross-platform optimizer tackles all of the above research challenges.Footnote 2 The idea is to split a single task into multiple atomic operators and to find the most suitable platform for each operator (or set of operators) so that its total cost is minimized. After a Rheem background (Sect. 2) and an overview of our optimizer (Sect. 3), we present our contributions:
- (1):
-
We propose a graph-based plan inflation mechanism that is a very compact representation of the entire plan search space, and we provide a cost model purely based on UDFs (Sect. 4).
- (2):
-
We model data movement across platforms as a new graph problem, which we prove to be NP-hard, and propose an efficient algorithm to solve it (Sect. 5).
- (3):
-
We devise a new algebra and a new lossless pruning technique to enumerate executable cross-platform plans for a given task in a highly efficient manner (Sect. 6).
- (4):
-
We explain how we exploit our optimization pipeline for performing progressive optimization to deal with poor cardinality estimates (Sect. 7).
- (5):
-
We discuss our optimizer’s design that allows us to seamlessly support new platforms and emerging applications requirements (Sect. 8).
- (6):
-
We extensively evaluate our optimizer under diverse tasks using real-world datasets and show that it allows tasks to run more than one order of magnitude faster by using multiple platforms instead of a single platform (Sect. 9).
Finally, we discuss related work (Sect. 10) and conclude this paper with a summary (Sect. 11).
2 Rheem background
Before delving into the details, let us briefly outline Rheem, our open-source cross-platform system, so as to establish our optimizer’s context. Rheem decouples applications from platforms with the goal of enabling cross-platform data processing [4, 5]. Although decoupling data processing was the driving motive when designing Rheem, we also adopted a three-layer optimization approach envisioned in [5]. One can see this three-layer optimization as a separation of concerns for query optimization. Overall, as Rheem applications have good knowledge of the tasks’ logic and the data they operate on, they are in charge of any logical and physical optimizations, such as operator reordering (the application optimization layer). Rheem receives from applications an optimized procedural Rheem plan and produces an execution plan, which specifies the platforms to use so that the execution cost is minimized (the core optimization layer). Then, the selected platforms run the plan by performing further platform-specific optimizations, such as setting the data buffer sizes (the platform optimization layer). Rheem is at the core optimization layer.

A Rheem plan that represents the SGD algorithm of data extracted from a database (left side) and its execution plan with additional execution operators for data movement when using three different processing platforms (right side)
Rheem is composed of two main components (among others): the cross-platform optimizer and the executor. The cross-platform optimizer gets as input a Rheem plan and produces an execution plan by specifying the platform to use for each operator in the Rheem plan. In turn, the executor orchestrates and monitors the execution of the generated execution plan on the selected platforms. For more details about Rheem ’s data model and architecture, we would like to refer the interested reader to [4, 55]. In this paper, we focus on the cross-platform optimizer. Below, we explain what Rheem and execution plans are, i.e., the input and output of the cross-platform optimizer.
Rheem plan As stated above, the input to our optimizer is a procedural Rheem plan, which is essentially a directed data flow graph. The vertices are Rheem operators, and the edges represent the data flow among the operators, such as in Spark or Flink. Rheem operators are platform-agnostic and define a particular kind of data transformation over their input, e.g., a \(\mathsf {Reduce}\) operator aggregates all input data into a single output. Rheem supports a wide variety of transformation and relational operators, but it is extensible to adding other types of operators. A complete list of the currently supported operators can be found in Rheem ’s documentation [55]. Only \(\mathsf {Loop}\) operators accept feedback edges, thus enabling iterative data flows. A Rheem plan without any loop operator is essentially a DAG. Conceptually, the data is flowing from source operators through the graph and is manipulated in the operators until it reaches a sink operator. As of now, Rheem supports neither nested loops nor control-flow operators.
Example 1
Figure 1a shows a Rheem plan for stochastic gradient descent (SGD) when the initial data is stored in a database.Footnote 3 Data points are read via a \(\mathsf {TableSource}\) and filtered via a \(\mathsf {Filter}\) operator. Then, they are (i) stored into a file for visualization using a \(\mathsf {CollectionSink}\) and (ii) parsed using a \(\mathsf {Map}\), while the initial weights are read via a \(\mathsf {CollectionSource}\). The main operations of SGD (i.e., sampling, computing the gradients of the sampled data point(s) and updating the weights) are repeated until convergence (i.e., the termination condition of \(\mathsf {RepeatLoop}\)). The resulting weights are output in a collection. For a tangible picture of the context in which our optimizer works, we point the interested reader to the examples of our source code.Footnote 4
Execution plan Similar to a Rheem plan, an execution plan is a data flow graph with two differences. First, the vertices are platform-specific execution operators. Second, the execution plan may comprise additional execution operators for data movement across platforms, e.g., a \(\mathsf {Collect}\) operator. Conceptually, given a Rheem plan, an execution plan indicates the platform the executor must enact each Rheem operator.

The end-to-end cross-platform optimization pipeline
Example 2
Figure 1b shows the execution plan for the SGD Rheem plan when Postgres, Spark, and JavaStreams are the only available platforms. This plan exploits Postgres to extract the desired data points, Spark’s high parallelism for the large input dataset and at the same time benefits from the low latency of JavaStreams for the small collection of centroids. Also note the three additional execution operators for data movement (\(\mathsf {Results2Stream}\), \(\mathsf {Broadcast}\)) and to make data reusable (\(\mathsf {Cache}\)). As we show in Sect. 9, such hybrid execution plans often achieve higher performance than plans with only a single platform: e.g., few seconds in contrast to 5 min.
3 Overview
We now give an overview of our cross-platform cost-based optimizer. Unlike traditional relational database optimizers, the only goal of our cross-platform optimizer is to select one or more platforms to execute a given Rheem plan in the most efficient manner. It does not aim at finding good operator orderings, which take place at the application layer [5]. The main idea behind our optimizer is to split a single task into multiple atomic operators and to find the most suitable platform for each operator (or set of operators) so that the total cost is minimized. For this, it comes with (i) an “upfront” optimization process, which optimizes the entire Rheem plan before execution, and (ii) a set of techniques to re-optimize a plan on the fly to handle uncertainty in cross-platform settings.
Figure 2 depicts the workflow of our optimizer. At first, given a Rheem plan, the optimizer passes the plan through a plan enrichment phase (Sect. 4). In this phase, the optimizer first inflates the input plan by applying a set of mappings. These mappings list how each of the platform-agnostic Rheem operators can be implemented on the different platforms with execution operators. The result is an inflated Rheem plan that can be traversed through alternative routes. That is, the nodes of the resulting inflated plan are Rheem operators with all its execution alternatives. The optimizer then annotates the inflated plan with estimates for both data cardinalities and the costs of executing each execution operator. Next, the optimizer takes a graph-based approach to determine how data can be moved most efficiently among different platforms and annotates the inflated plan accordingly (Sect. 5). It then uses all these annotations to determine the optimal execution plan via an enumeration algorithm. This enumeration algorithm is centered around an enumeration algebra and a highly effective, yet lossless pruning technique (Sect. 6). Finally, as data cardinality estimates might be imprecise,Footnote 5 the optimizer inserts checkpoints into the execution plan for on-the-fly re-optimization if required (Sect. 7). Eventually, the resulting execution plan can be enacted by the executor of Rheem.
We detail each of the above phases in the following (Sects. 4–7). Additionally, we discuss the flexible design of our optimizer, which allows for extensibility: Adding a new platform to Rheem does not require any change to the optimizer codebase (Sect. 8).
4 Plan enrichment
Given a Rheem plan, the optimizer has to do some preparatory work before it can start exploring alternative execution plans. We refer to this phase as plan enrichment. Concretely, our optimizer (i) determines all eligible platform-specific execution operators for each Rheem operator (Sect. 4.1); and (ii) estimates their execution costs (Sect. 4.2).
4.1 Plan inflation
While Rheem operators declare certain data processing operations, they do not provide an implementation and are thus not executable. Therefore, our optimizer inflates the Rheem plan with all corresponding execution operators, each providing an actual implementation on a specific platform. Mapping dictionaries is a basic approach to determine corresponding execution operators, such as in [25, 38]. This approach would allow for 1-to-1 operator mappings between Rheem and execution operators. However, different data processing platforms work with different abstractions: While databases employ relational operators and Hadoop-like systems build upon Map and Reduce, special purpose systems (e.g., graph processing systems) rather provide specialized operators (e.g., for the PageRank algorithm). Due to this diversity, 1-to-1 mappings are often insufficient and a flexible operator mapping technique is called for supporting more complex mappings.
4.1.1 Graph-based operator mappings
We thus define operator mappings in terms of graph mappings. In simple terms, an operator mapping maps a matched subgraph to a substitute subgraph. We formally define an operator mapping as follows.
Definition 1
(Operator mapping) An operator mapping \(p \rightarrow s\) consists of a graph pattern p and a substitution function s. Assume that p matches the subgraph G of a given Rheem plan. Then, the operator mapping designates the substitute subgraph \(G' := s(G)\) for G via substitution function s.
Usually, the matched subgraph G is a constellation of Rheem operators (i.e., a group of operators following a certain pattern) and the substitute subgraph \(G'\) is a corresponding constellation of execution operators. However, we also have mappings from execution to execution operators; and mappings from Rheem to Rheem operators. The latter allows us to consider platforms that do not natively support certain execution operators. We illustrate this in the following example.

Rheem plan enrichment: On the top, there are different types of mappings for the \(\mathsf {ReduceBy}\) operator, while on the bottom, the \(\mathsf {ReduceBy}\) Rheem operator gets inflated using these mappings
Example 3
(Mappings) In Fig. 3a, we illustrate an 1-to-1 mapping from the \(\mathsf {ReduceBy}\) Rheem operator to the \(\mathsf {ReduceBy}\) Spark execution operator, an 1-to-n mapping from the \(\mathsf {ReduceBy}\) Rheem operator maps to a constellation of \(\mathsf {GroupBy}\) and \(\mathsf {Map}\) Rheem operators which in turn are mapped to JavaStreams execution operators via an m-to-n mapping. Such mappings are crucial for considering JavaStreams as a possible platform for the \(\mathsf {ReduceBy}\) Rheem operator, even if there is no \(\mathsf {ReduceBy}\) execution operator in JavaStreams.
In contrast to 1-to-1 mapping approaches, our graph-based approach provides a more powerful means to derive execution operators from Rheem operators. Our approach also allows us to break down complex operators (e.g., \(\mathsf {PageRank}\)) and map it to platforms that do not support it natively. Mappings are provided by developers when adding a new Rheem or execution operator. Adding a new platform thus does not require any change to our optimizer.
4.1.2 Operator inflation
It is worth noting that applying operator mappings to simply replace matched subgraphs G by one of their substitute subgraphs \(G'\) would cause two insufficiencies. First, this strategy would always create only a single execution plan, thereby precluding any cost-based optimization. Second, the resulting execution plan would be dependent on the order in which the mappings are applied. This is because once a mapping is applied, other relevant mappings might become inapplicable. We overcome both insufficiencies by introducing inflated operators in Rheem plans. An inflated operator replaces a matched subgraph and comprises that matched subgraph and all the substitute graphs. This new strategy allows us to apply operator mappings in any order and to account for alternative operator mappings. Ultimately, an inflated operator expresses alternative subplans inside Rheem plans. Thus, our graph-based mappings do not determine the platform to use for each Rheem operator. Instead, it lists all the alternatives for the optimizer to choose from. This is in contrast to Musketeer [30] and Myria [63], which use their rewrite rules to obtain the platform each operator should run on.
Example 4
(Operator inflation) Consider again the k-means example. Figure 3b depicts the inflation of the \(\mathsf {ReduceBy}\) operator. Concretely, the Rheem \(\mathsf {ReduceBy}\) operator is replaced by an inflated operator that hosts both the original and two substitute subgraphs.
As a result, an inflated Rheem plan defines all possible combinations of execution operators of the original Rheem plan, but, in contrast to [57], without explicitly materializing them. Thus, an inflated Rheem plan is a highly compact representation of all execution plans.
4.2 Operators cost estimation
Once a Rheem plan is inflated, the optimizer estimates and annotates costs to each alternative execution operator (see the right side of Fig. 3b). It does so by traversing the plan in a bottom-up fashion. Note that cardinality and cost estimation are extremely challenging problems—even in highly cohesive systems, such as relational databases, which have detailed knowledge on execution operator internals and data statistics [45]. As Rheem has little control on the underlying platforms, the optimizer uses a modular and fully UDF-based cost model. This is similar to [37], which used wrapper-based selectivity and statistics estimators. Rheem also represents cost estimates as intervals with a confidence value, which allows it to perform on-the-fly re-optimization. We discuss how Rheem does such re-optimizations later on in Sect. 7.

Operator cost estimation process: The cost of an execution operator depends on the cost of the resources it consumes, which in turn depend on both the utilization and the cost of each unit. The resource utilization depends on the input cardinality
4.2.1 Cost estimation
Inspired by Garlic [37], we propose a simple, yet powerful UDF-based approach that decouples the cost formulas to enable developers to intervene at any level of the cost estimation process. Furthermore, this approach also allows both the developers to define their own objective criteria for optimizing Rheem plans and the optimizer to be portable across different deployments.
Figure 4 illustrates this cost estimation process, where the boxes represent all the UDFs in the process. The total cost estimate for an execution operator o depends on the cost of the resources it consumes (CPU, memory, disk, and network), defined as: \(\textit{cost}_o = t_o^{\textit{CPU}} + t_o^{\textit{mem}} + t_o^{\textit{disk}} + t_o^{\textit{net}}\). The cost of each resource \(t_o^r\) is the product of (i) its utilization \(r_o\) and (ii) the unit costs \(u_r\) (e.g., how much one CPU cycle costs). The latter depends on hardware characteristics (such as number of nodes and CPU cores), which are encoded in a configuration file for each platform.
Our optimizer estimates the resource utilization with a cost function \(r_o\) that depends on the input cardinality \(c_{in}\) of its corresponding Rheem operator. For instance, the cost function to estimate the CPU cycles required by the \(\mathsf {SparkFilter}\) operator is \(\textit{CPU}_{\textit{SF}} := c_{in}(\mathsf {Filter}) \times \alpha + \beta \), where parameter \(\alpha \) denotes the number of required CPU cycles for each input data quantum and parameter \(\beta \) describes some fixed overhead for the operator start-up and scheduling.
For iterative tasks, the cost of the loop operator depends on the number of iterations. If the task itself does not specify the exact number of iterations, a user can still give hints to the optimizer and provide a rough estimate. If this information is omitted, Rheem uses default values and relies on re-optimization (Sect. 7). Note that discussing different techniques to estimate the number of iterations of an ML algorithm, such as [41], is beyond the scope of this paper.
4.2.2 Cost learner
Obtaining the right values for all these parameters in the cost model, such as the \(\alpha , \beta \) values, is very time-consuming if it is done manually via profiling. Furthermore, profiling operators in isolation is unrealistic in cross-platform settings as many platforms optimize execution across multiple operators, e.g., by pipelining. Indeed, we found cost functions derived from isolated benchmarking to be insufficiently accurate.
We thus take a different approach. Rheem provides an offline cost learner module that uses historical execution logs from plans covering all Rheem operators to learn these parameters. We model the cost as a regression problem. The estimated execution time is \(t' = \sum _{i}{} \textit{cost}_i(\mathbf{x}, c_i)\) where \(\mathbf{x}\) is a vector with all the parameters that we need to learn, and \(c_i\) is the input cardinalities. Let t be the real execution time, we then seek \(\mathbf{x}\) that minimizes the difference between t and \(t'\): \(\mathbf{x}_\text {min}={{\,\mathrm{arg\,min}\,}}_\mathbf{x}\ \textit{loss}(t, t' )\). We consider a relative loss function defined as: \(\textit{loss}(t, t')= \left( \frac{|t - t'| + s}{t + s}\right) ^2\), where s is a regularizer inspired by additive smoothing that tempers the loss for small t.
We then use a genetic algorithm [50] to find \(\mathbf{x}_\text {min}\). In contrast to other optimization algorithms, genetic algorithms impose only few restrictions on the loss function to be minimized. Thus, our cost learner can deal with arbitrary cost functions and one can calibrate the cost functions with only little additional effort.
4.2.3 Cardinality estimation
Apart from the parameters, which are automatically learned, and the hardware specifications, the cost model requires as input the result sizes of each operator. Even though some underlying platforms may have their own statistics to compute result sizes, our optimizer does not use such statistics because they are rarely (or never) exposed to the applications.
Our optimizer estimates the output cardinality of each Rheem operator by first computing the output cardinalities of the source operators via sampling and then traverses the inflated plan in a bottom-up fashion. For this, each Rheem operator is associated with a cardinality estimator function, which considers its properties (e.g., selectivity and number of iterations) and input cardinalities. For example, the \(\mathsf {Filter}\) operator uses \(c_{out}\)(\(\mathsf {Filter}\))\( := c_{in}\)(\(\mathsf {Filter}\))\( \times \sigma _f\), where \(\sigma _f\) is the selectivity of the user’s \(\mathsf {Filter}\) operator. The cardinality estimator functions are defined once by the developer (or system administrator) when adding a new Rheem operator.
Users and applications (the ones issuing input queries) need to provide the selectivity of their UDF, which is independent of the input dataset. Recall that to address the uncertainty inherent to the selectivity estimation the optimizer expresses the cardinality estimates in an interval with a confidence value. Basically, this confidence value gives the likelihood that the interval indeed contains the actual cost value. For the selectivities, the optimizer relies on basic statistics, such as the number of output tuples and distinct values. These statistics are provided by the application/developer or obtained by runtime profiling, similar to [33, 56]. If not available, the optimizer uses default values for the selectivities, similarly to [28, 37], and relies on re-optimization for correcting the execution plan if necessary. We intentionally do not consider devising a sophisticated cardinality estimation mechanism as this is an orthogonal problem [58]. This also allows us to study the effectiveness of our optimizer without interference from cardinality estimation.
5 Data movement
Selecting optimal platforms for an execution plan might require to move and transform data across platforms. This leads to an inherent trade-off between choosing the optimal execution operators and minimizing data movement and transformation costs. Additionally, in contrast to distributed and federated databases, a cross-platform setting typically has completely different data formats, and hence, data transformation costs must be considered. These make planning and assessing communication in cross-platform settings a challenging problem. First, there might be several alternative data movement strategies, e.g., from RDD to a file or to a Java object. A simple strategy of transferring data via a file, such as in [30, 63], may miss many opportunities for cross-platform data processing. Second, the costs of each strategy must be assessed so that our optimizer can explore the trade-off between selecting optimal execution operators and minimizing data movement costs. Third, data movement might involve several intermediate steps to connect two operators of different platforms, as also stated in [61].
We thus represent the space of possible communication steps as a graph (Sect. 5.1). This graph representation allows us to model the problem of finding the most efficient communication path among execution operators as a new graph problem (Sect. 5.2). We then devise a novel algorithm to efficiently solve this graph problem (Sect. 5.3). A short version of our data movement strategy can also be found in [43].
5.1 Channel conversion graph
The channel conversion graph (CCG for short) is a graph whose vertices are data structures (e.g., an RDD in Spark) and whose edges express conversions from one data structure to another. Before formally defining the CCG, let us first explain how we model data structures (communication channels) and data transformation (conversion operators).
Communication channel Data can flow among operators via communication channels (or simply channels), which form the vertices in the CCG. A channel can be, for example, an internal data structure or a stream within a platform, or simply a file. The yellow boxes in Fig. 5 depict the standard channels considered by our optimizer for JavaStreams, Postgres, Spark, and Flink. Channels can be reusable, i.e., they can be consumed multiple times, or non-reusable, i.e., once they are consumed they cannot be used anymore. For instance, a file is reusable, while a data stream is usually not.
Conversion operator When moving data from one platform to another, it might also become necessary to convert a channel from one type to another, e.g., convert an SQL query result to a data stream. Such conversions are handled by conversion operators, which form the edges in the CCG. Conversion operators are in fact regular execution operators. For example, Rheem provides the \(\mathsf {SqlToStream}\) execution operator, which transforms the result set of an SQL query to a Java data stream channel. Rheem also uses conversion operators to deal with semantic integration issues, such as transforming data from one format to another (e.g., from CSV to TSV). The benefit of using conversion operators for both data transfer and transformation is twofold: (i) There is less overhead in the execution pipeline, and (ii) as they are execution operators, the conversion costs are straightforward to compute (see Sect. 4.2).
Channel conversion graph We now formally define the channel conversion graph below.
Definition 2
(Channel conversion graph) A CCG is a directed graph \(G:=(C, E, \lambda )\), where the set of vertices C is the channels, E comprises the directed edges indicating that the source channel can be converted to the target channel, and \(\lambda :E\rightarrow O\) is a labeling function that attaches the appropriate conversion operator \(o\in O\) to each edge \(e\in E\).
Rheem provides the CCG with generic channels, e.g., CSV files, together with the channels of the supported platforms, e.g., RDDs. Still developers can easily extend the CCG if needed as we will see in Sect. 8.
Example 5
Figure 5 shows an excerpt of Rheem ’s default CCG. The yellow boxes (nodes in the graph) are the channels, while all edges are attached with conversion operators.Footnote 6
5.2 Minimum conversion tree problem
CCGs allow us to model the problem of planning data movement as a graph problem. This approach is very flexible: If there is any way to connect execution operators via a sequence of conversion operators, we will discover it. Unlike other approaches, e.g., [25, 30], developers do not need to provide conversion operators for all possible source and target channels. CCGs thus make it much easier for developers to add new platforms to Rheem and make them interoperable with the other platforms. Let us further motivate the utility of CCGs for data movement with a concrete example.
Example 6
Assume the CCG of Fig. 5. Consider now the \(\mathsf {Filter}\) operator in our running example (see Fig. 1), whose output goes to the \(\mathsf {CollectionSink}\) and \(\mathsf {Map}\) operators. The goal is to move data from a \(\mathsf {PostgresFilter}\) execution operator (root) to a \(\mathsf {JavaSink}\) (target\(_1\)) and a \(\mathsf {SparkMap}\) (target\(_2\)) execution operator. While the root produces a \(\mathsf {Relation}\) as output channel, \(target_1\) and \(target_2\) accept only a Java \(\mathsf {Collection}\) and a (cached) \(\mathsf {RDD}\), respectively, as input channels. Multiple conversions are needed to serve the two target operators.

A channel conversion graph along with root and target operators from different platforms. The MCT problem is to find the most efficient paths in the graph to connect the output of the root with the input of the targets
The CCG also enables the optimizer to use multiple intermediate steps to connect two operators. For example, for transferring data from Postgres to Flink or Spark in Fig. 5, there are two intermediate channels involved. We model such complex scenarios of finding the most efficient communication path from a root producer to multiple target consumers as the minimum conversion tree (MCT) problem.
Minimum Conversion Tree Problem Given a root channel \(c_r\), n target channel sets \(C_{t_i}\) (\(0 < i \le n\)), and the CCG \(G = (C, E, \lambda )\), find a subgraph \(G'\) such that:
- (1):
-
\(G'\) is a directed tree with root \(c_r\) and contains at least one channel \(c_{t_i}\in C_{t_i}\) for each target channel set \(C_{t_i}\);
- (2):
-
any non-reusable channel in \(G'\), must have a single successor, i.e.,a conversion or a consumer operator;
- (3):
-
there is no other subgraph \(G''\) that satisfies the above two conditions and has a smaller cost (i.e., the sum of costs of all its edges) than \(G'\). The cost of an edge e is the estimated cost for the associated conversion operator \(\lambda (e)\).
Example 7
Assume, in Fig. 5, the root channel is \(c_r := \mathsf {Relation} \) and the target channel sets are \(C_{t_1} := \{\mathsf {Collection} \}\) (for target\(_1\)) and \(C_{t_2} := \{\mathsf {RDD}, \mathsf {CachedRDD} \}\) (for target\(_2\)). The minimum conversion tree for this scenario could be: The \(\mathsf {Relation}\) root channel is converted to a Java \(\mathsf {Stream}\), then to a Java \(\mathsf {Collection}\), which is used to satisfy \(C_{t_1}\) and to be converted to an \(\mathsf {RDD}\) (thereby satisfying \(C_{t_2}\)). Note that this is possible only because \(\mathsf {Collection}\) is reusable.
Although our MCT problem seems related to other well-studied graph problems, such as the minimum spanning tree and single-source multiple-destinations shortest paths, it differs from them for two main reasons. First, MCTs have a fixed root and need not span the whole CCG. Second, MCT seeks to minimize the costs of the conversion tree as a whole rather than its individual paths from the root to the target channels. Our MCT problem resembles more to the Group Steiner Tree (GST) problem [54]: There, n sets of vertices should be connected by a minimal tree. However, GST is typically considered on undirected graphs and with no notion of non-reusable channels. Furthermore, GST solvers are often designed for specific types of graphs, such as planar graphs or trees. These disparities preclude the adaption of existing GST solvers to the MCT problem. Yet, the GST problem allows us to show the NP-hardness of the MCT problem.
Theorem 1
The MCT problem is NP-hard.
Proof
See “Appendix A.” \(\square \)
5.3 Finding minimum conversion trees
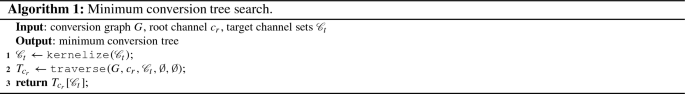
Because the MCT problem differs from existing graph problems, we devise a new algorithm to solve it (Algorithm 1). Given a CCG G, a root channel \(c_r\), and n target channel sets \({\mathscr {C}}_t := \{C_{t_1}, C_{t_2}, ..., C_{t_n}\}\), the algorithm proceeds in two principal steps. First, it simplifies the problem by modifying the input parameters (kernelization). Then, it exhaustively traverses the graph (channel conversion graph exploration) to find the MCT. We discuss these two steps in the following.
5.3.1 Kernelization
In the frequent case that several target consumers, e.g., target\(_i\) and target\(_j\), accept the same channels, \(C_{t_i}=C_{t_j}\), with at most one non-reusable channel and at least one reusable channel, we can merge them into a single set by discarding the non-reusable channel: \(C_{t_{i,j}}=\left\{ c~\mid c~\in ~C_{t_i} \wedge c \text { is reusable}\right\} \). Doing so decreases the number of target channel sets and thus reduces the maximum degree (fanout) of the MCT, which is a major complexity driver of the MCT problem. In fact, in the case of only a single target channel set the MCT problem becomes a single-source single-destination shortest path problem. We can thus solve it with, e.g., Dijkstra’s algorithm.
Example 8
(Merging target channel sets) In Fig. 5, \(\mathsf {target} _2\) accepts the channels \(C_{t_2}=\{\mathsf {RDD}, \mathsf {CachedRDD} \}\). Assuming that \(\mathsf {target} _1\) is a SparkReduce operator instead, which accepts the same set of channels as \(\mathsf {target} _2\), we could then merge their input channels into \(C_{t_{1,2}}=\{\mathsf {CachedRDD} \}\).
Lemma 1
A solution for a kernelized MCT problem also solves the original MCT problem.
Proof
See “Appendix A.” \(\square \)
5.3.2 Channel conversion graph exploration
After kernelizing the original MCT problem, Algorithm 1 proceeds to explore the CCG, thereby building the MCT from “its leaves to the root”: Intuitively, it recursively searches—starting from the root channel \(c_r\)—across the CCG for communication channels that satisfy the target channel sets \({\mathscr {C}}_t\); It then backtracks the search paths, thereby incrementally building up the MCT. In summary, the graph traversal of CCG is composed of three main parts: (i) It visits a new channel, checks if it belongs to any target channel set, and potentially creates a partial singleton conversion tree; (ii) then, it traverses forward, thereby creating partial MCTs from the currently visited channel to any subset of target channel sets; and (iii) it merges the partial MCTs from the steps (i) and (ii) and returns the merged MCTs. The algorithm terminates when the partial MCTs form the final MCT.
We give more details about the traversal part of our algorithm in “Appendix B.”
5.3.3 Correctness and complexity
Theorem 2
Given a channel conversion graph, Algorithm 1 finds the minimum conversion tree if it exists.
Proof
See “Appendix A.” \(\square \)
Our algorithm solves the MCT problem exactly by exhaustively exploring the CCG graph. This comes at the cost of exponential complexity: There are \((n - 1)!\) ways to traverse a full CCG of n channels, and we might need to maintain \(2^k\) partial trees in the intermediate steps, where k is the number of target channel sets. However, in practical situations, our algorithm finishes in the order of milliseconds, as the CCG comprises only tens of channels and is very sparse. Also, the number of target channel sets k is mostly only 1 or 2 and can often be diminished by kernelization. More importantly, our algorithm avoids performance penalties from inferior data movement plans. However, if it ever runs into performance problems, one may consider making it approximate inspired from existing algorithms for GST [20, 29]. Yet, we show that our algorithm gracefully scales to a reasonable number of platforms (see Sect. 9.5).
6 Plan enumeration
The goal of our optimizer is to find the optimal execution plan, i.e., the plan with the smallest estimated cost. That is, for each inflated operator in an inflated plan, it needs to select one of its alternative execution operators such that the overall execution cost is minimized. Finding the optimal plan, however, is challenging because of the exponential size of the search space. A plan with n operators, each having k execution operators, will lead to \(k^n\) possible execution plans. This number quickly becomes intractable for growing n. For instance, a cross-community PageRank plan, which consists of \(n=27\) operators, each with \(k=5\), yields \(7.45\times 10^{18}\) possible execution plans. One could apply a greedy pruning technique to reduce this search space. However, greedy techniques cannot guarantee to find the optimal execution plan, which may hurt performance due to data movement and start-up costs.
We thus take a principled approach to solve this problem: We define an algebra to formalize the enumeration (Sect. 6.1) and propose a lossless pruning technique (Sect. 6.2). We then exploit this algebra and pruning technique to devise an efficient plan enumeration algorithm (Sect. 6.3).
6.1 Plan enumeration algebra
Inspired by the relational algebra, we define the plan enumeration search space along with traversal operations algebraically. This approach enables us to: (i) define the enumeration problem in a simple, elegant manner; (ii) concisely formalize our enumeration algorithm; and (iii) explore design alternatives. Below, we describe the data structures and operations of our algebra.
6.1.1 Data structures
Our enumeration algebra needs only one principal data structure, the enumeration \(E=(S, SP)\), which comprises a set of execution subplans SP for a given scope S. The scope is the set of inflated operators that the enumeration has unfolded in the current step. Each subplan contains execution operators for each inflated operator in S, including execution operators for data movement. One can imagine an enumeration as a relational table whose column names correspond to the inflated operators contained in the scope and whose rows correspond to the possible execution subplans.
Example 9
(Enumeration) Figure 6 depicts an enumeration for the subplan consisting of 3 operators shown in Fig. 3. The enumeration contains three columns, one for each inflated operator, and two subplans, one in each row.

A plan enumeration example of a subplan consisting of 3 operators: It contains three columns, one for each inflated operator, and two subplans, one in each row
Notice that if the scope contains all the inflated operators of a Rheem plan (complete enumeration), then the corresponding subplans form complete execution plans. This admits the following problem formalization.
Plan Enumeration Problem Let \(E = (S, \textit{SP})\) be the complete enumeration of a Rheem plan. The goal is to efficiently find SP such that \(\exists \textit{sp}_k \in \textit{SP}\), \(\textit{cost}(\textit{sp}_k) \le \textit{cost}(\textit{sp}_i)\) \(\forall \textit{sp}_i \in \textit{SP}\), where \(\textit{cost}(\textit{sp}_i)\) includes of execution, data movement, and platform initialization costs.
6.1.2 Algebra operations
We use two main operations, Join (\(\bowtie \)) and Prune (\(\sigma \)), to expand an enumeration with the neighboring operators of its subplans. In few words, Join connects two small enumerations to form a larger one, while Prune scraps inferior subplans from an enumeration for efficiency reasons. Below, we formally define each of these two operations.
(1) Join is analogous to a natural join in the relational algebra. It creates a new enumeration whose scope is the union of the scopes of the two input enumerations and whose subplans are all the merged subplan combinations. We formally define this operation as follows.
Definition 3
(Join) Given two disjoint enumerations \(E_1=(S_1, \textit{SP}_1)\) and \(E_2=(S_2, \textit{SP}_2)\) (i.e., \(S_1 \cap S_2 = \emptyset \)), we define a join \(E_1 \bowtie E_2 = (S, \textit{SP})\) where \(S := S_1 \cup S_2\) and \(\textit{SP} := \{\texttt {connect}(sp_1, sp_2)\mid sp_1 \in \textit{SP}_1 \text { can be connected to } sp_2 \in SP_2 \}\). The connect function connects \(sp_1\) and \(sp_2\) by adding conversion operators between operators of the two subplans.
Example 10
(Merging subplans) The enumeration in Fig. 6 could be created by joining an enumeration with scope \( S_1 = \{\mathsf {Map} {(``assign'')}, \mathsf {ReduceBy(``sum \& count'')} \}\) with an enumeration with scope \(S_2 = \{\mathsf {Map} {(``average'')}\}\). In particular, the connect function adds conversion operators to link the two \(\mathsf {Maps}\) in Subplan 1.
(2) Prune is akin to the relational selection operator. As we stated earlier, an exhaustive enumeration of all subplans is infeasible. This operation thus removes subplans from an enumeration according to some pruning rule, e.g., retaining only the top-k plans with the smallest costs. We formally define Prune as follows.
Definition 4
(Prune) Given an enumeration \(E=(S, \textit{SP})\), a pruned enumeration is an enumeration \(\sigma _\pi (E) := (S, \textit{SP}')\), where \(\textit{SP}':= \{ sp \in \textit{SP} \mid sp\text { satisfies } \pi \}\) and \(\pi \) is a configurable pruning criterion.
6.1.3 Applying the algebra
We can now draft a basic enumeration algorithm based on the Join operation only. For each inflated operator o, we create a singleton enumeration \(E~=~(\{o\},~SP_o)\), where \(SP_o\) are the executable subplans provided by o. We then join these singleton enumerations one after another to obtain an exhaustive enumeration for the complete Rheem plan. This basic algorithm not only lacks an instance of the Prune operation, but also an order for the joins. We present our choices for both in the remainder of this section.
6.2 Lossless pruning
To deal with the exponential size of the search space, we devise a novel pruning technique that is lossless: It will not prune a subplan that is part of the optimal execution plan. Our pruning technique builds upon the notion of boundary operators. These are those inflated operators of an enumeration with scope S that are adjacent to some inflated operator outside of S. In the enumeration in Fig. 6, \(\mathsf {Map(``assign'')}\) and \(\mathsf {Map(``average'')}\) are the boundary operators: They are adjacent to \(\mathsf {RepeatLoop}\) and \(\mathsf {Map(``parse'')}\), which are not part of the enumeration (see Fig. 1). The idea behind our pruning technique is that if there are two execution subplans for the same enumeration with the same boundary execution operators, it keeps the one with the lowest total estimated cost. Rheem uses the geometric mean of the lower and upper bound of the cost interval as the total estimated cost. Note that Rheem ignores the confidence value at this stage and use it only for on-the-fly re-optimization. We formally define our pruning technique below.
Definition 5
(Lossless pruning) Let \(E=(S, SP)\) be an enumeration and \(S_b \subseteq S\) be the set of its boundary operators. The lossless pruning removes all \(sp\in SP\) for which there is another \(sp' \in SP\) that (i) contains the same execution operators for all \(S_b\) as sp, and (ii) has a lower estimate cost than sp.
Example 11
(Lossless pruning) For the enumeration in Fig. 6, the lossless pruning discards either Subplan 1 or 2 (whichever has the higher cost), because both subplans contain the same boundary execution operators (\(\mathsf {JavaMap(``assign'')}\) and \(\mathsf {SparkMap(``average'')}\)).
Note that this pruning technique allows us to not prune optimal subplans.
Lemma 2
The lossless pruning does not prune a subplan that is contained in the optimal plan with respect to the cost model.
Proof
See “Appendix A.” \(\square \)
6.3 Enumeration algorithm
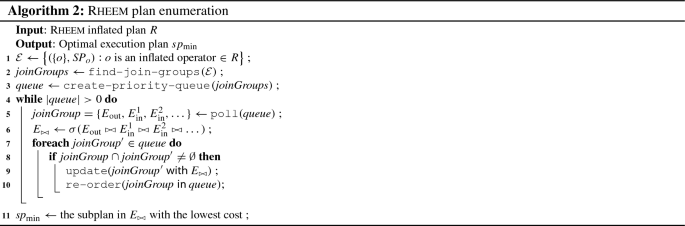
Using the previously described enumeration algebra and the lossless pruning strategy, we now construct our plan enumeration algorithm. Intuitively, the algorithm starts from singleton enumerations (i.e., an enumeration of a single operator) and repeatedly joins and prunes enumerations until it obtains the optimal execution plan. A good order in joining enumeration is crucial for maximizing the pruning effectiveness. Algorithm 2 shows the pseudocode.
Given an inflated Rheem plan as input, it first creates a singleton enumeration for each inflated operator (Line 1). It then identifies join groups (Line 2). A join group indicates a set of plan enumerations to be joined. Initially, it creates a join group for each inflated operator’s output, so that each join group contains (i) the enumeration for the operator with that output, \(E_\text {out}\), and (ii) the enumerations for all inflated operators that consume that output as input, \(E_\text {in}^i\). For instance in the inflated plan of Fig. 1, the enumerations for \(\mathsf {Map(``assign'')}\) and \( \mathsf {ReduceBy(``sum \& count'')}\) form an initial join group. While the join order is not relevant to the correctness of the enumeration algorithm, joining only adjacent enumerations is beneficial to performance: It maximizes the number of non-boundary operators in the resulting enumeration, which in turn makes our lossless pruning most effective (see Definition 5, Criterion (i)). To further enhance the pruning effect, we order the join groups ascending by the number of boundary operators and add them in a priority queue (Line 3). Then, we greedily poll the join groups from the queue, perform the corresponding join, and prune the join result (Lines 4–6). After joining a set of enumerations \(E_\text {out}\) and \(E_\text {in}^i\), we first check if these enumerations are members of other join groups (Line 8). If that is the case, we replace them with their join result \(E_{\bowtie }\) and update the priority in the queue (Line 9–10). This is necessary for reordering the rest join groups with the new number of boundary operators they contain. Eventually, the last join result is a full enumeration for the complete Rheem plan. Its lowest cost subplan is the optimal execution plan (Line 11).
Our algorithm has been inspired by classical database optimizers [58] with the difference that the problem we are solving is not operator reordering. For this reason, we do not opt for a top-down or bottom-up approach but rather exploit the entire search space simultaneously. Moreover, our lossless pruning is related to the concept of interesting sites [42] in distributed relational query optimization, especially to the interesting properties [58]. We can easily extend our prune operator to account for properties other than boundary operators. For example, we already do consider platform start-up costs in our cost model (see the plan enumeration problem statement in Sect. 6.1). As a result, we avoid pruning subplans with start-up costs that might be redeemed over the whole plan.
Correctness Our algorithm always finds the optimal execution plan. The reason behind this is its pruning technique, which never discards a subplan that is contained in the optimal plan (Lemma 2). We formally state this property in the following theorem.
Theorem 3
Algorithm 2 determines the optimal execution plan with respect to the cost estimates.
Proof
As Algorithm 2 applies a lossless pruning technique (as per Lemma 2) to an otherwise exhaustive plan enumeration, it detects the optimal execution plan. \(\square \)
7 Dealing with uncertainty
It is well known that poor cardinalities can harm the optimizer [45]. A cross-platform setting is even more susceptible to imprecise data cardinalities due to its high uncertainty, e.g., the semantics of UDFs are usually unknown. Although the design of our optimizer allows applications and developers to supplement valuable optimization information, such as UDF selectivities, users might not always be willing or be able to specify them. In this case, default values are used which may lead to suboptimal plans. To mitigate the effects of bad cardinality estimates, we reuse our entire optimization pipeline to perform progressive query optimization [49]. The key principle is to monitor actual cardinalities of an execution plan and re-optimize the plan on the fly whenever the observed cardinalities greatly mismatch the estimated ones. Progressive query optimization in cross-platform settings is challenging because: (i) we have only limited control over the underlying platforms, which makes plan instrumentation and halting executions difficult, and (ii) re-optimizing an ongoing execution plan must efficiently consider the results already produced.
We leverage Rheem ’s interval-based cost estimates and and confidence values to tackle the above challenges. The optimizer inserts optimization checkpoints into execution plans when it optimizes an incoming Rheem plan for the first time. An optimization checkpoint is basically a request for re-optimization before proceeding beyond it. It inserts these checkpoints between two execution operators whenever (i) cardinality estimates are uncertain (i.e., having a wide interval or low confidence) and (ii) the data is at rest (e.g., a Java collection or a file). Before execution, the optimizer asks the execution drivers of the involved platforms to collect the actual cardinalities of their intermediate data structures. The execution plan is then executed until the optimization checkpoints. Every time an optimization checkpoint is reached, the Rheem monitor checks if the actual cardinalities considerably mismatch the estimated ones. If so, the optimizer re-optimizes (as explained in previous sections) the remaining plan with the updated cardinalities and already executed operators. Once this is done, the involved execution drivers simply resume the execution with the re-optimized plan. This yields a progressive optimization that uses the existing optimization pipeline as well as the latest statistics. Notice that Rheem can switch between execution and progressive optimization any number of times at a negligible cost.
8 Extensibility
Cross-platform environments are characterized by continuous changes as new platforms arise or existing ones get updated. A cross-platform optimizer needs to take such changes into consideration in order to be effective. However, such changes may overwhelm the system administrator that needs to maintain the system. For this reason, we have designed our optimizer to be highly extensible to accommodate new platforms or updates to existing ones with very little effort. Rheem users can add new operators, including data movement operators, and plug-in new platform drivers without modifying the existing source code of our optimizer.
Our optimizer requires three main elements to work: (i) cardinality estimates for each Rheem operator as well as the CPU and memory load of each execution operator, (ii) mappings from Rheem to execution operators, and (iii) the channel conversion graph. System administrators can easily specify these elements when supplying new operators or integrating new platforms.
First, our UDF-based cost model is an essential part of the optimizer’s extensibility. Adding a new Rheem operator requires users to simply extend the abstract \(\mathsf {Operator}\) class in Rheem. It is recommended that the user implements a method of this class for specifying the expected output cardinality of the operator. If not implemented, Rheem uses a default implementation whose value can be adjusted during the progressive optimization (see Sect. 7). Moreover, when adding a new execution operator, users have to implement the \(\mathsf {ExecutionOperator}\) interface. It is recommended that users provide a specific method to specify the load that this operator incurs in terms of CPU and memory. In case a user cannot manually specify the cost functions, our offline cost learner (see Sect. 4.2) allows to learn them from previously executed tasks.
Second, our flexible mappings make our optimizer easily extensible. Once a user creates a new execution (or Rheem) operator, she usually needs to create a mapping from its corresponding Rheem operator to the new execution operator (or vice versa). Users can do this by implementing the \(\mathsf {Mapping}\) interface. This new \(\mathsf {Mapping}\) implementation specifies a graph pattern that matches a Rheem operator (or subplan) as well as defines a transformation function that creates a replacement operator (or subplan) for the matched operator.
Finally, when plugging a new platform, new communication channels and conversion operators may be required in the channel conversion graph. Users can create a channel by extending the abstract \(\mathsf {Channel}\) class. Adding a conversion operator is like adding an execution operator, i.e., an operator that transforms data from one format to another (e.g., from RDD to file).
All these elements are given as input to the optimizer, and thus, system administrators do not need to add or modify any line of code of our optimizer.
9 Experiments
Our optimizer is part of Rheem, an open-source cross-platform system.Footnote 7 For the sake of simplicity, we henceforth refer to our optimizer simply as Rheem. We have carried out several experiments to evaluate the effectiveness and efficiency of our optimizer. As our work is the first to provide a complete cross-platform optimization framework, we compared it vis-a-vis individual platforms and common practices. For a system-level comparison, refer to [4]. Note that we did not compare our optimizer with a rule-based optimization approach for two main reasons. First, defining simple rules based on the input dataset size, such as in SystemML [15], does not always work: There are non-obvious cases where even if the input is small (e.g., 30 MB), it is better to use a big data platform, such as Spark, as we will see in the following. Thus, rules need to be more complex and descriptive. Second, defining complex rules requires a lot of expertise and results in a huge rule base. For example, Myria requires hundreds of rules for only three platforms [63]. This is not only time-consuming, but it is not easily extensible and maintainable when new platforms are added.
We evaluate our optimizer by answering the following four main questions. Can our optimizer enable Rheem to: choose the best platform for a given task? (Sect. 9.2); spot hidden opportunities for cross-platform processing that improve performance? (Sect. 9.3); and effectively re-optimize an execution plan on the fly? (Sect. 9.4). Last but not least, we also evaluate the scalability (Sect. 9.5) and design choices (Sect. 9.6) of our optimizer.
9.1 General setup
Hardware We ran all our experiments on a cluster of 10 machines: each with one 2 GHz Quad Core Xeon processor, 32 GB main memory, 500 GB SATA hard disks, a 1 Gigabit network card, and runs 64-bit platform Linux Ubuntu 14.04.05.
Processing and storage platforms We considered the following platforms: Java’s Streams (JavaStreams), PostgreSQL 9.6.2 (PSQL), Spark 2.4.0 (Spark), Flink 1.7.1 (Flink), GraphX 1.6.0 (GraphX), Giraph 1.2.0 (Giraph), a self-written Java graph library (JGraph), and HDFS 2.6.5 to store files. We used all these with their default settings and set the RAM of each platform to 20 GB. We disabled the progressive optimization feature of our optimizer in order to first better study its upfront optimization techniques. In Sect. 9.4, we study the effect of progressive optimization.

Platform independence: Rheem avoids all worst cases and chooses the best platform for most tasks
Tasks and datasets We considered a broad range of data analytics tasks from different areas, namely text mining (TM), relational analytics (RA), machine learning (ML), and graph mining (GM). Details on the datasets and tasks are shown in Table 1. These tasks and datasets individually highlight different features of our optimizer and together demonstrate its general applicability. To challenge Rheem and allow it to choose among most of the available platforms, most tasks’ input datasets are stored on HDFS (except when specified otherwise). We also considered a polystore case where data is dispersed among different stores (PolyJoin); however, such cases are easier to handle as the search space becomes smaller, and we thus omit them from further evaluation.
Cost model To learn the parameters required for the operator’s cost functions, we first generated a number of execution logs using a set of 10 training tasks (Grep, InvertedIndex, SetDifference, SetIntersection, TPC-H Q1 and Q2, PageRank, SVM, Knn, and InclusionDependency) with synthetic datasets of varying sizes. We then used a genetic algorithm. Last, as estimating UDFs’ selectivity is out of the scope of this paper, we assume accurate selectivities for the first sets of experiments studying the upfront optimization. This gives us a better view on how Rheem can perform without being affected by wrong cardinalities estimates. In Sect. 7, we study the progressive optimization and use estimated selectivities computed as discussed in Sect. 4.2.3.
Repeatability All the numbers we report are the average of three runs on the datasets of Table 1. To ensure repeatability, we will provide the code of all our experimental tasks, SQL queries, datasets, and a detailed guideline on how to reproduce our experiments.Footnote 8
9.2 Single-platform optimization
Applications might require to switch platforms according to the input datasets and/or tasks in order to achieve better performance. We call such a use case platform independence [40]. We, thus, start our experiments by evaluating how well Rheem selects a single platform to execute a task.
Experiment setup For Rheem, we forced our optimizer to use a single platform throughout a task and checked if it chose the one with the best runtime. We ran all the tasks of Table 1 with increasing dataset sizes. Note that we did not run PolyJoin because it requires using several platforms. For the real-world datasets, we took samples from the initial datasets of increasing size. We also increased the input datasets up to 1TB for most tasks in order to further stress the optimizer. Note that, due to their complexity, we do not report the 1TB numbers for Word2NVec and SimWords: None of the platforms managed to finish in a reasonable time. The iterations for CrocoPR, K-means, and SGD are 10, 100, and 1000, respectively.
Experiment results Figure 7 shows the execution times for all our tasks and for increasing dataset sizes. The stars denote the platform selected by our optimizer. First of all, let us stress that the results show significant differences in the runtimes of the different platforms: even between Spark and Flink, which are big data platform competitors. For example, Flink can be up to 2.4\({\times }\) faster than Spark and Spark can be up to 2\(\times \) faster than Flink. Thus, it is crucial to prevent tasks from falling into such non-obvious worst cases.

Opportunistic: Rheem improves performance by combining multiple data processing platforms
The results, in Fig. 7, show that our optimizer indeed makes robust platform choices whenever runtimes differ substantially. This effectiveness of the optimizer for choosing the right platform transparently prevents applications from using suboptimal platforms. For instance, it prevents running: (i) Word2NVec on Spark for 5% and 100% of its input dataset. Spark performs worse than Flink because it employs only two compute nodes (one for each input data partition), while Flink uses all of them;Footnote 9 (ii) SimWords on Java for 1% of its input dataset (\(\sim 30\) MB); as SimWords performs many CPU-intensive vector operations, using JavaStreams (i.e., a single compute node) simply slows down the entire process; (iii) WordCount on Flink for 800% of its input dataset (i.e., 24 GB) and 1TB, where, in contrast to Spark, Flink suffers from a slower data reduce mechanism;Footnote 10 (iv) Aggregate on Flink for scale factors higher than 200, because it tends to write often to disk when dealing with large groups (formed by the \(\mathsf {GroupBy}\) operator); and (v) CrocoPR on JGraph for more than 10% of its input dataset as it simply cannot efficiently process large datasets as well as on Spark and Flink for 1TB whose performance is deteriorated by the number of created objects. Thus, our optimizer is capable of discovering non-obvious cases: For example, for the Word2NVec and SimWords a simple rule-based optimizer based on input cardinalities would choose JavaStreams for the small input of 30 MB (i.e., \(1\%\) of the dataset). However, JavaStreams is 7\(\times \) to 12\(\times \) slower than Spark and Flink in these two cases.
We also observe that Rheem generally chooses the right platform even for the difficult cases where the execution times are quite similar on different platforms. For example, it always selects the right platform for Aggregate and Join even if the execution times for Spark and Flink are quite similar in most of the cases. Only in few of these difficult cases, the optimizer fails to choose the best platform, e.g., Word2NVec and SimWords for 0.1% of input data: The accuracy of our optimizer is sensitive to uncertainty factors, such as cost and cardinality estimates. Still, all these results allow us to conclude that our optimizer chooses the best platform for almost all tasks and it prevents tasks from falling into worst execution cases.

9.3 Multi-platform optimization
We now study the efficiency of our optimizer when using multiple platforms for a single task. We evaluate if our optimizer: (i) allows Rheem to spot hidden opportunities for the use of multiple platforms to improve performance (the opportunistic experiment); (ii) performs well in a data lake setting (the polystore experiment); and (iii) efficiently complements the functionalities of one platform with another to perform a given task (the complementary-platforms experiment).
Opportunistic experiment We re-enable Rheem to use any platform combination. We used the same tasks and datasets with three differences: We ran (i) Kmeans on 10x its entire dataset for a varying number of centroids, (ii) SGD on its entire dataset for increasing batch sizes, and (iii) CrocoPR on 10% of its input dataset for a varying number of iterations.
Figure 8 shows the results. Overall, we find that in the worst case, Rheem matches the performance of any single platform execution, but in several cases considerably improves over single-platform executions. Table 2 illustrates the platform choices that our optimizer made as well as the cross-platform data transfer per iteration for all our tasks. We observe Rheem to be up to 20\(\times \) faster than Spark, up to 15\(\times \) faster than Flink, up to 22\(\times \) faster than JavaStreams, up to 2\(\times \) faster than Giraph. There are several reasons for having this large improvement. For SGD, Rheem decided to handle the model parameters, which is typically tiny (\(\sim 0.1\) KB for our input dataset), with JavaStreams, while it processed the data points (typically a large dataset) with Spark. For CrocoPR, surprisingly our optimizer uses a combination of Flink, JGraph, and JavaStreams, even if Giraph is the fastest baseline platform (for 10 iterations). This is because after the preparation phase of this task, the input dataset for the \(\mathsf {PageRank}\) operation on JGraph is \(\sim 544\) MB only. For WordCount, Rheem surprisingly detected that moving the result data (\(\sim 82\) MB) from Spark to JavaStreams and afterward shipping it to the driver application is slightly faster than using Spark only. This is because when moving data to JavaStreams Rheem uses the action \(\mathsf {Rdd.collect()}\), which is more efficient than the \(\mathsf {Rdd.toLocalIterator()}\) operation that Spark offers to move data to the driver. For Aggregate, our optimizer selects Flink and Spark, which allows it to run this task slightly faster than the fastest baseline platform. Our optimizer achieves this improvement by (i) exploiting the fast stream data processing mechanism native in Flink for the projection and selection operations, and (ii) avoiding the slow data reduce mechanism of Flink by using Spark for the \(\mathsf {ReduceBy}\) operation. In contrast to all previous tasks, Rheem can afford to transfer \(\sim 23\)% of the input data because it uses two big data platforms for processing this task. All these are surprising results perse. They show not only that Rheem outperforms state-of-the-art platforms, but also that it can spot hidden opportunities to improve performance and to be much more robust.

JoinX: Rheem outperforms Postgres by executing the join and aggregation in Spark even if both relations are stored in Postgres
To further stress the importance of finding hidden cross-platform execution opportunities, we ran a subtask (JoinX) of PolyJoin. This task gets the account balance ratio between a supplier and all customers in the same nation and calculates the average ratio per nation. For this, it joins the relations SUPPLIER and CUSTOMER (which are stored on Postgres) on the attribute nationkey and aggregates the join results on the same attribute. For this additional experiment, we compare Rheem with the execution of JoinX on Postgres, which is the obvious platform to run this kind of queries. The results are displayed in Fig. 9. Remarkably, we observe that Rheem significantly outperforms Postgres, even though the input data is stored there. In fact, Rheem is 2.5\(\times \) faster than Postgres for a scale factor of 10. This is because it simply pushes down the projection operation into Postgres and then moves the data into Spark to perform the join and aggregation operations, thereby leveraging the Spark parallelism. We thus do confirm that our optimizer both indeed identifies hidden opportunities to improve performance and performs more robustly by using multiple platforms.

Rheem outperforms single platforms even if 8 out of 40 workers are stragglers
Finally, we demonstrate how our optimizer is agnostic to any heterogeneity of the underlying cluster. To illustrate this, we emulated 2 struggle nodes (i.e., 8 workers) by running background applications so that these machines are slowed down. We also modified the cost model to take into account straggler nodes. Figure 10 shows the results for one task of each type. We observe that Spark, Flink, and Giraph are affected by the straggler nodes which slightly decrease their performance.
However, even in such a case Rheem manages to choose the best platform(s) as such information can be incorporated in it UDF-based cost model.

Polystore experiment We now consider the PolyJoin task, which takes the CUSTOMER, LINEITEM, NATION, ORDERS, REGION, and SUPPLIER TPC-H tables as input. We assumed the large LINEITEM and ORDERS tables are stored on HDFS, the medium-size tables CUSTOMER, REGION, and SUPPLIER on Postgres, and the small NATION table on a local file system (LFS). In this scenario, the common practice is either to move the data into a relational database in order to enact the queries inside the database [24, 59] or move the data entirely to HDFS and use Spark. We consider these two cases as the baselines. We measure the data migration time and the task execution time as the total runtime for these baselines. Rheem processes the input datasets directly on the data stores where they reside and moves data if necessary. For a fair comparison in this experiment, we set the parallel query and effective IO concurrency features of Postgres to 4.
Figure 11a shows the results for this experiment. The results are unanimous: Rheem is significantly faster, up to 5\(\times \), than moving data into Postgres and run the query there. In particular, we observed that even if we discard data migration times, Rheem performs quite similarly to Postgres. This is because Rheem can parallelize most part of the task execution by using Spark. We also observe that our optimizer has negligible overhead over the case when the developer writes ad-hoc scripts to move the data to HDFS for running the task on Spark. In particular, Rheem is 3\(\times \) faster than Spark for scale factor 1, because it moves less data from Postgres to Spark. As soon as the Postgres tables get larger, reading them from HDFS rather than directly from Postgres is more beneficial because of its parallel reads. This shows the substantial benefits of our optimizer not only in terms of performance but also in terms of ease of use: Users do not write ad-hoc scripts to integrate different platforms.


a Polystore experiment: Datasets are stored in heterogeneous sources. b Complementary-platforms experiment: Complementing platforms is indeed beneficial and Rheem achieves this automatically
Complementary-platforms experiment To evaluate this feature, we consider the CrocoPR and Kmeans tasks. In contrast to previous experiments, we assume both input datasets (\(\mathsf {DBpedia}\) and \(\mathsf {USCensus1990}\)) to be on Postgres. As the implementation of these tasks on Postgres would be very impractical and of utterly inferior performance, it is important to move the computation to a different processing platform. In these experiments, we consider the ideal case as baseline, i.e., the case where data is already on a platform being able to perform the task. As ideal case, we assume that the data is on HDFS and that Rheem uses either JavaStreams or Spark to run the tasks.
Figure 11b shows the results. We observe that Rheem achieves similar performance with the ideal case in almost all scenarios. This is a remarkable result, as it needs to move data out of Postgres to a different processing platform, in contrast to the ideal case. These results clearly show that our optimizer frees users from the burden of complementing the functionalities of diverse platforms, without sacrificing performance.

9.4 Progressive optimization
We proceed to evaluate the utility of progressive optimization feature of our optimizer in the presence of incorrect estimates.
Experiment setup We enabled the progressive optimization (PO) feature of our optimizer. We considered the Join task for this experiment. We extended the Join task with a low-selective selection predicate on the names of the suppliers and customers. To simulate the usual cases where users cannot provide accurate selectivity estimates, we provide a high selectivity hint to Rheem for this filter operator.

Progressive optimization in Rheem improves performance
Experiment results Figure 12 shows the results for this experiment. We clearly observe the benefits of our progressive optimizer. In more detail, our optimizer first generates an execution plan using Spark and JavaStreams. It uses JavaStreams for all the operators after the \(\mathsf {Filter}\) because it sees that \(\mathsf {Filter}\) has a very high selectivity. However, Rheem figures out that \(\mathsf {Filter}\) has in fact a low selectivity. Thus, it runs the re-optimization process and changes on the fly all JavaStreams operators to Spark operators. This allows it to speed up performance by almost 4 times. Last but not least, we observed during our experiment that the PO feature of Rheem has a negligible overhead (less than 2%) over using platforms natively.

9.5 Optimizer scalability
We continue our experimental study by evaluating the scalability of our optimizer to determine whether it operates efficiently on large Rheem plans and for a large numbers of platforms.
Experiment setup We start by evaluating our optimizer’s scalability in terms of the number of supported platforms and then proceed to evaluate it in terms of the number of operators in a Rheem plan. For the former, we considered hypothetical platforms with full Rheem operator coverage and three communication channels each. For the latter, we generated Rheem plans with two basic topologies that we found to be at the core of many data analytic tasks: pipeline and tree.

Optimization scalability: a Our optimizer performs well for a practical number of platforms and even better by augmenting a simple top-k pruning strategy. b It can scale to very large plans
Experiment results Figure 13a shows the optimization time of our optimizer for Kmeans when increasing the number of supported platforms. The results for the other tasks are similar. As expected, the time increases along with the number of platforms. This is because (i) the CCG gets larger, challenging our MCT algorithm, and (ii) our lossless pruning has to retain more alternative subplans. Still, we observe that our optimizer (the no top-k series in Fig. 13a) performs well for a practical number of platforms: It takes less than 10 s when having 5 different platforms. Yet, one could leverage our algebraic formulation of the plan enumeration problem to easily augment our optimizer with a simple top-k pruning strategy, which simply retains the k best subplans when applied to an enumeration. To do so, we just have to specify an additional rule for the Prune operator (see Sect. 6.1) to obtain a pruning strategy that combines the lossless pruning with a top-k one. While the former keeps intermediate subplans diverse, the latter removes the worst plans. Doing so allows our optimizer to gracefully scale with the number platforms, e.g., for \(k=8\), it takes less than 10 s for 10 different platforms (the top-8 series in Fig. 13a). Figure 13b shows the results regarding the scalability of our optimizer in terms of number of operators in a task. We observe that our optimizer scales to very large plans for both topologies. In practice, we do not expect to find situations where we have more than five platforms and plans with more than hundred operators. In fact, in our workload the tasks contain an average of 15 operators. All these numbers show the high scalability of our optimizer.

9.6 Optimizer internals
We finally conducted several experiments to further evaluate the efficiency of our optimizer. We study five different aspects of our optimizer: (i) how well our pruning technique reduces the search space; (ii) how important the order is, in which our enumeration algorithm processes join groups; (iii) how effective our channel conversion graph (CCG) is; (iv) how accurate our cost model is; and (v) where the time is spent in the entire optimization process.

Efficiency and effectiveness of pruning strategies
Lossless pruning experiment We proceed to compare our lossless pruning strategy (Sect. 6) with several alternatives, namely no pruning at all and just top-k pruning. In contrast to Sect. 9.5 where we used the top-k pruning to augment our lossless pruning, we now consider it independently. Figure 14 shows the efficiency results of all pruning strategies (on the left) as well as their effectiveness (on the right), i.e., the estimated execution times of their optimized plans. Note that we did not use the actual plan execution times to assess the effectiveness of our enumeration strategy in order to eliminate the influence of the calibration of the cost functions. As a first observation, we see that pruning is crucial overall: An exhaustive enumeration was not possible for SimWords and CrocoPR because of the large number of possible execution operators that these plans have. We also found that the top-1 strategy, which merely selects the best alternative for each inflated operator, is pruning too aggressively and fails in 3 out of 7 times to detect the optimal execution plan. While the numbers now seem to suggest that the remaining lossless and top-10 pruning strategies are of the same value, there is a subtle difference: The lossless strategy guarantees to find the optimal plan (w.r.t. the cost estimates) and is, thus, superior.

Effect of join groups ordering and CCG. a Join ordering is very crucial for the tree topology. b Our CCG approach allows for more than one order of magnitude runtime improvement over a simple file-based approach
Join groups ordering experiment We start by analyzing the importance of the join groups order (see Sect. 6.3) by comparing it with a random order. Figure 15a shows that ordering the join groups is indeed crucial for the tree topology. This is not the case for the pipeline topology, where the process of ordering the join groups does not seem to exert any measurable influence on the optimization time.
For large, complex Rheem plans, a combination of the lossless pruning followed by a top-k pruning might be a valuable pruning strategy. While the former keeps intermediate subplans diverse, the latter removes the worst plans. This flexibility is a consequence of our algebraic approach to the plan enumeration problem.
CCG experiment Next, we evaluate the effectiveness of our channel conversion graph (CCG) approach for data movement. For this experiment, we compare our CCG approach with an HDFS-based data movement approach, i.e., only through writing to an HDFS file. Figure 15b shows the results in terms of runtime. We observe that for k-means, Rheem can be more than one order of magnitude faster when using CCG compared to using only HDFS files for data movement. For SGD and CrocoPR, it is always more than one order of magnitude faster. This shows the importance of well-planned data movement.

a Our cost model is sufficient for choosing a near-optimal plan. b The average optimization time amounts to around a second, which is several orders of magnitude smaller than the actual runtime of the tasks
Cost model experiment We now validate the accuracy of our cost model. Note that similarly to traditional cost-based optimizers in databases, our cost model aims at enabling the optimizer to choose a good plan while avoiding worst cases. That is, it does not aim at precisely estimating the running time of each plan.
Thus, we evaluate the accuracy of our cost model by determining which plan of the search space our optimizer chooses. The ideal case would be to exhaustively run all possible execution plans and validate that our optimizer chooses the best plan or one close to it. However, running all plans is infeasible as that would take already several weeks for the small WordCount task with only 6 operators. For this reason, in Fig. 16a we plot for SGD and WordCount the following: (i) the real execution time of the first three plans with the minimum estimated runtime; and (ii) the minimum, maximum, and average of the real execution times of 100 randomly chosen plans.
We make the following observations: First, the first plan has the minimum real execution time compared to all other plans (including the second and third plans). Second, the first three plans have a better runtime not only compared to the average real execution time of the randomly chosen plans, but also compared to the minimum execution time of the randomly chosen plans. Based on these observations, we conclude that our cost model is sufficient for our optimizer to choose a near-optimal plan.
Breakdown experiment Last, we analyze where the time is spent throughout the entire optimization process. Figure 16b shows the breakdown of our optimizer’s runtime in its several phases for several tasks. At first, we note that the average optimization time amounts to slightly more than a second, which is several orders of magnitude smaller than the time savings from the previous experiments. The lion’s share of the runtime is the source inspection, which obtains cardinality estimates for the source operators of a Rheem plan (e.g., for inspecting an input file). This could be improved, e.g., by a metadata repository or caches. In contrast, the enumeration and MCT discovery finished in the order of tens of milliseconds, even though they are of exponential complexity. The pruning technique is the key that keeps the enumeration time low, while MCT works satisfactorily for a moderate number of underlying platforms that we used in our experiments.
10 Related work
In the past years, the research and industry communities have proposed many data processing platforms [6, 9, 23, 53, 64]. In contrast to all these works, we do not provide a new processing platform but an optimizer to automatically choose among and combine all these different platforms.
Cross-platform task processing has been in the spotlight very recently. Some works have proposed different solutions to decouple data processing pipelines from the underlying platforms [1, 25, 27, 30, 46, 61, 63]. Although their goals are similar, all these works differ substantially from our optimizer, as most of them do not consider data movement costs, which is crucial in cross-platform settings. Note that some complementary works [31, 52] focus on improving data movement among different platforms, but they do not provide a cross-platform optimizer. Moreover, each of these systems additionally differs from our optimizer in various ways. Musketeer’s main goal is to decouple query languages from execution platforms [30]. Its main focus lies on converting queries via a fixed intermediate representation and thus mostly targets platform independence. BigDAWG [27] comes with no optimizer and requires users to specify where to run cross-platform queries via its Scope and Cast commands. Myria [63] provides a rule-based optimizer which is hard to maintain as the number of underlying platforms increases. In [25], the authors present a cross-platform system intended for optimizing complex pipelines. It allows only for simple one-to-one operator mappings and does not consider optimization at the atomic operator granularity. The authors in [61] focus on ETL workloads making it hard to extend their proposed solution with new operators and other analytic tasks. DBMS+ [46] is limited by the expressiveness of its declarative language, and hence, it is neither adaptive nor extensible. Furthermore, it is unclear how DBMS+ abstracts underlying platforms seamlessly. Other complementary works, such as [31, 52], focus on improving data movement among different platforms, but they do not provide a cross-platform optimizer. Apache Calcite [13] decouples the optimization process from the underlying processing making it suitable for integrating several platforms. However, no cross-platform optimization is provided. Tensorflow [1] follows a similar idea, but for cross-device execution of machine learning tasks, and thus, it is orthogonal to Rheem. Finally, WWHow! envisions a cross-platform optimizer but for data storage [36].
Query optimization has been the focus of a great amount of the literature [35]. However, most of these works focus on relational-style query optimization, such as operator reordering and selectivity estimation, and cannot be directly applied to our system. More closely to our work is the optimization for federated DBMSs. A key aspect in federated DBMSs, as well as in distributed machine learning systems, is adaptive query processing and re-optimization [11, 12, 14, 49]. More specifically, the Rio optimizer [12] is closely related to our optimizer as it uses the notion of uncertainty for cardinality estimates and proposes a proactive re-optimization strategy. The authors in [49] propose a progressive query optimization technique for relational databases. Nevertheless, the solutions of such works are tailored for relational algebra and assume tight control over the execution engine, which is not applicable to our case. Finally, there is work on UDF-based data flow optimization, such as [33, 56], but they all are complementary to our optimizer. One could leverage them to better incorporate UDFs in our cost models.
MapReduce-based integration systems, such as [24, 44], mainly aim at integrating Hadoop with RDBMS and cannot be easily extended to deal with more diverse data analytic tasks and different processing platforms. There are also works that automatically decide whether to run a MapReduce job locally or in a cluster, such as FlumeJava [18]. Although such an automatic choice is crucial for some tasks, it does not generalize to data flows with other platforms.
Federated databases have been studied since almost the beginnings of the database field itself [60]. Garlic [17], TSIMMIS [19], and InterBase [16] are just three examples. However, all these works significantly differ from ours in that they consider a single data model and push query processing to where the data is.
11 Conclusion
We presented a cross-platform optimizer that automatically allocates a task to a combination of data processing platforms in order to minimize its execution cost. In particular, we proposed (i) novel strategies to map platform-agnostic tasks to concrete execution strategies; (ii) a new graph-based approach to plan data movement among platforms; (iii) an algebraic formalization and novel solution to select the optimal execution strategy; and (iv) how to handle the uncertainty found in cross-platform settings. Our extensive evaluation showed that our optimizer allows tasks to run up to more than one order of magnitude faster than on any single platform. We acknowledge that this is only a first step toward real cross-platform optimization. As future work, we may consider to extend our optimizer to handle different types of systems, such as machine learning systems or RDF stores. Future work might also take into account memory restrictions of the platforms. Last but not least, we recently started evaluating different optimization techniques in Rheem for data and ML debugging [21] and plan to extent our cost-based optimizer to support these cases.
Notes
Hereafter, we use the term task without loss of generality.
Note that, we have recently equipped Rheem with an ML-based cross-platform optimizer [39].
Please note that a colored printout of this paper is recommended for a better interpretation of the figures.
Note that devising a sophisticated cardinality estimation technique is out of the scope of this paper.
For clarity, we do not depict all conversion operators.
One might think of re-partitioning the data for Spark, but this is a task- and data-specific optimization, which is not the goal of Rheem.
Flink uses a sorting-based aggregation, which—in this case—appears to be inferior to Spark’s hash-based aggregation.
References
Abadi, M., et al.: TensorFlow: a system for large-scale machine learning. In: USENIX Symposium on Operating Systems Design and Implementation (OSDI), pp. 265–283 (2016)
Abouzeid, A., Bajda-Pawlikowski, K., Abadi, D.J., Rasin, A., Silberschatz, A.: HadoopDB: an architectural hybrid of mapreduce and dbms technologies for analytical workloads. PVLDB 2(1), 922–933 (2009)
Agrawal, D., Ba, L., Berti-Equille, L., Chawla, S., Elmagarmid, A., Hammady, H., Idris, Y., Kaoudi, Z., Khayyat, Z., Kruse, S., Ouzzani, M., Papotti, P., Quiané-Ruiz, J.A., Tang, N., Zaki, M.J.: Rheem: enabling multi-platform task execution. In: SIGMOD, pp. 2069–2072 (2016)
Agrawal, D., Chawla, S., Contreras-Rojas, B., Elmagarmid, A.K., Idris, Y., Kaoudi, Z., Kruse, S., Lucas, J., Mansour, E., Ouzzani, M., Papotti, P., Quiané-Ruiz, J., Tang, N., Thirumuruganathan, S., Troudi, A.: RHEEM: enabling cross-platform data processing: may the big data be with you!. PVLDB 11(11), 1414–1427 (2018)
Agrawal, D., Chawla, S., Elmagarmid, A., Kaoudi, Z., Ouzzani, M., Papotti, P., Quiané-Ruiz, J.A., Tang, N., Zaki, M.J.: Road to freedom in big data analytics. In: EDBT, pp. 479–484 (2016)
Alexandrov, A., et al.: The stratosphere platform for big data analytics. VLDB J. 23(6), 939–964 (2014)
Apache Beam. (2019). https://beam.apache.org. Accessed 2 May 2019
Apache Drill (2019). https://drill.apache.org. Accessed 2 May 2019
Apache Spark: Lightning-fast cluster computing (2019). http://spark.apache.org. Accessed 2 May 2019
Baaziz, A., Quoniam, L.: How to use big data technologies to optimize operations in upstream petroleum industry. Int. J. Innov. (IJI) 1(1), 19–25 (2013)
Babu, S., Bizarro, P.: Adaptive query processing in the looking glass. In: CIDR (2005)
Babu, S., Bizarro, P., DeWitt, D.J.: Proactive re-optimization with Rio. In: SIGMOD, pp. 936–938 (2005)
Begoli, E., Camacho-Rodríguez, J., Hyde, J., Mior, M.J., Lemire, D.: Apache calcite: a foundational framework for optimized query processing over heterogeneous data sources. In: SIGMOD, pp. 221–230 (2018)
Boehm, M., Burdick, D.R., Evfimievski, A.V., Reinwald, B., Reiss, F.R., Sen, P., Tatikonda, S., Tian, Y.: SystemML’s optimizer: plan generation for large-scale machine learning programs. IEEE Data Eng. Bull. 37(3), 52–62 (2014)
Boehm, M., Dusenberry, M., Eriksson, D., Evfimievski, A.V., Manshadi, F.M., Pansare, N., Reinwald, B., Reiss, F., Sen, P., Surve, A., Tatikonda, S.: SystemML: declarative machine learning on spark. PVLDB 9(13), 1425–1436 (2016)
Bukhres, O.A., Chen, J., Du, W., Elmagarmid, A.K., Pezzoli, R.: Interbase: an execution environment for heterogeneous software systems. IEEE Comput. 26(8), 57–69 (1993). https://doi.org/10.1109/2.223544
Carey, M.J., Haas, L.M., Schwarz, P.M., Arya, M., Cody, W.F., Fagin, R., Flickner, M., Luniewski, A., Niblack, W., Petkovic, D., Thomas, J., Williams, J.H., Wimmers, E.L.: Towards heterogeneous multimedia information systems: the garlic approach. In: Proceedings of the International Workshop on Research Issues in Data Engineering—Distributed Object Management (RIDE-DOM), pp. 124–131 (1995)
Chambers, C., Raniwala, A., Perry, F., Adams, S., Henry, R.R., Bradshaw, R., Weizenbaum, N.: FlumeJava: easy, efficient data-parallel pipelines. In: Proceedings of the ACM SIGPLAN Conference on Programming Language Design and Implementation (PLDI), pp. 363–375 (2010)
Chawathe, S.S., Garcia-Molina, H., Hammer, J., Ireland, K., Papakonstantinou, Y., Ullman, J.D., Widom, J.: The TSIMMIS project: integration of heterogeneous information sources. In: Information Processing Society of Japan (IPSJ), pp. 7–18 (1994)
Chekuri, C., Even, G., Kortsarz, G.: A greedy approximation algorithm for the group Steiner problem. Discret. Appl. Math. 154(1), 15–34 (2000)
Contreras-Rojas, B., Quiané-Ruiz, J., Kaoudi, Z., Thirumuruganathan, S.: TagSniff: simplified big data debugging for dataflow jobs. In: SoCC, pp. 453–464 (2019)
DB2 hybrid data management. https://www.ibm.com/analytics/data-management (2019)
Dean, J., Ghemawat, S.: MapReduce: simplified data processing on large clusters. Commun. ACM 51(1), 107–113 (2008)
DeWitt, D.J., Halverson, A., Nehme, R.V., Shankar, S., Aguilar-Saborit, J., Avanes, A., Flasza, M., Gramling, J.: Split query processing in polybase. In: SIGMOD, pp. 1255–1266 (2013)
Doka, K., Papailiou, N., Giannakouris, V., Tsoumakos, D., Koziris, N.: Mix ’n’ match multi-engine analytics. In: IEEE BigData, pp. 194–203 (2016)
Duggan, J., Elmore, A.J., Stonebraker, M., Balazinska, M., Howe, B., Kepner, J., Madden, S., Maier, D., Mattson, T., Zdonik, S.B.: The BigDAWG polystore system. SIGMOD Record 44(2), 11–16 (2015). https://doi.org/10.1145/2814710.2814713
Elmore, A., Duggan, J., Stonebraker, M., Balazinska, M., Cetintemel, U., Gadepally, V., Heer, J., Howe, B., Kepner, J., Kraska, T., et al.: A demonstration of the BigDAWG polystore system. PVLDB 8(12), 1908–1911 (2015)
Ewen, S., Kache, H., Markl, V., Raman, V.: Progressive query optimization for federated queries. In: EDBT, pp. 847–864 (2006)
Garg, N., Konjevod, G., Ravi, R.: A polylogarithmic approximation algorithm for the group Steiner tree problem. J. Algorithms 37(1), 66–84 (2000)
Gog, I., Schwarzkopf, M., Crooks, N., Grosvenor, M.P., Clement, A., Hand, S.: Musketeer: all for one, one for all in data processing systems. In: EuroSys, pp. 1–16 (2015)
Haynes, B., Cheung, A., Balazinska, M.: PipeGen: data pipe generator for hybrid analytics. In: SoCC, pp. 470–483 (2016)
Hems, A., Soofi, A., Perez, E.: How innovative oil and gas companies are using big data to outmaneuver the competition. Microsoft white paper (2014). http://download.microsoft.com/documents/en-us/Drilling_for_New_Business_Value_April2014_Web.pdf. Accessed 2 May 2019
Hueske, F., Peters, M., Sax, M.J., Rheinländer, A., Bergmann, R., Krettek, A., Tzoumas, K.: Opening the black boxes in data flow optimization. PVLDB 5(11), 1256–1267 (2012)
Data-driven healthcare organizations use big data analytics for big gains. IBM Software white paper (2019)
Ioannidis, Y.E.: Query optimization. ACM Comput. Surv. 28(1), 121–123 (1996)
Jindal, A., Quiané-Ruiz, J., Dittrich, J.: WWHow! Freeing data storage from cages. In: CIDR (2013)
Josifovski, V., Schwarz, P.M., Haas, L.M., Lin, E.T.: Garlic: a new flavor of federated query processing for DB2. In: SIGMOD, pp. 524–532 (2002)
Jovanovic, P., Simitsis, A., Wilkinson, K.: Engine independence for logical analytic flows. In: ICDE, pp. 1060–1071 (2014)
Kaoudi, Z., Quiané-Ruiz, J., Contreras-Rojas, B., Padro-Meza, R., Troudi, A., Chawla, S.: ML-based cross-platform query optimization. In: ICDE (2020)
Kaoudi, Z., Quiané-Ruiz, J.A.: Cross-platform data processing: use cases and challenges. In: ICDE (tutorial) (2018)
Kaoudi, Z., Quiane-Ruiz, J.A., Thirumuruganathan, S., Chawla, S., Agrawal, D.: A cost-based optimizer for gradient descent optimization. In: SIGMOD (2017)
Kossmann, D., Stocker, K.: Iterative dynamic programming: a new class of query optimization algorithms. TODS 25(1), 43–82 (2000). https://doi.org/10.1145/352958.352982
Kruse, S., Kaoudi, Z., Quiané-Ruiz, J.A., Chawla, S., Naumann, F., Contreras-Rojas, B.: Optimizing cross-platform data movement. In: ICDE, pp. 1642–1645 (2019)
LeFevre, J., Sankaranarayanan, J., Hacigümüs, H., Tatemura, J., Polyzotis, N., Carey, M.J.: MISO: Souping up big data query processing with a multistore system. In: SIGMOD, pp. 1591–1602 (2014)
Leis, V., et al.: How good are query optimizers, really? PVLDB 9(3), 204–215 (2015)
Lim, H., Han, Y., Babu, S.: How to fit when no one size fits. In: CIDR (2013)
Lucas, J., Idris, Y., Contreras-Rojas, B., Quiané-Ruiz, J., Chawla, S.: RheemStudio: Cross-platform data analytics made easy. In: ICDE, pp. 1573–1576 (2018)
Luigi project (2019). https://github.com/spotify/luigi. Accessed 2 May 2019
Markl, V., Raman, V., Simmen, D., Lohman, G., Pirahesh, H., Cilimdzic, M.: Robust query processing through progressive optimization. In: SIGMOD, pp. 659–670 (2004)
Mitchell, M.: An Introduction to Genetic Algorithms. MIT Press, Cambridge (1998)
Noyes, K.: For the airline industry, big data is cleared for take-off. http://fortune.com/2014/06/19/big-data-airline-industry. Accessed 2 May 2019
Palkar, S., Thomas, J.J., Shanbhag, A., Schwarzkopt, M., Amarasinghe, S.P., Zaharia, M.: A common runtime for high performance data analysis. In: CIDR (2017)
PostgreSQL (2019). http://www.postgresql.org. Accessed 2 May 2019
Reich, G., Widmayer, P.: Beyond Steiner’s problem: a VLSI oriented generalization. In: Proceedings of the International Workshop on Graph-Theoretic Concepts in Computer Science (WG), pp. 196–210 (1989)
Rheem project (2020). https://rheem-ecosystem.github.io/. Accessed 10 May 2020
Rheinländer, A., Heise, A., Hueske, F., Leser, U., Naumann, F.: SOFA: an extensible logical optimizer for UDF-heavy data flows. Inf. Syst. 52, 96–125 (2015)
Roy, P., Seshadri, S., Sudarshan, S., Bhobe, S.: Efficient and extensible algorithms for multi query optimization. In: SIGMOD, pp. 249–260 (2000)
Selinger, P.G., Astrahan, M.M., Chamberlin, D.D., Lorie, R.A., Price, T.G.: Access path selection in a relational database management system. In: SIGMOD, pp. 23–34 (1979)
Shankar, S., Choi, A., Dijcks, J.P.: Integrating hadoop data with oracle parallel processing. Oracle white paper (2010). http://www.oracle.com/technetwork/database/bi-datawarehousing/twp-integrating-hadoop-data-with-or-130063.pdf. Accessed 2 May 2019
Sheth, A.P., Larson, J.A.: Federated database systems for managing distributed, heterogeneous, and autonomous databases. ACM Comput. Surv. 22(3), 183–236 (1990)
Simitsis, A., Wilkinson, K., Castellanos, M., Dayal, U.: Optimizing analytic data flows for multiple execution engines. In: SIGMOD, pp. 829–840 (2012)
Stonebraker, M.: The case for polystores. ACM SIGMOD Blog. http://wp.sigmod.org/?p=1629. Accessed 2 May 2019
Wang, J., et al.: The Myria big data management and analytics system and cloud services. In: CIDR (2017)
Yang, F., Li, J., Cheng, J.: Husky: Towards a more efficient and expressive distributed computing framework. PVLDB 9(5), 420–431 (2016)
Acknowledgements
Open Access funding provided by Projekt DEAL.
Author information
Authors and Affiliations
Corresponding author
Additional information
Publisher's Note
Springer Nature remains neutral with regard to jurisdictional claims in published maps and institutional affiliations.
Appendices
A Proofs
We present the proofs of the theorems and lemmas presented in Sects. 5 and 6.2.
Theorem 1
The MCT problem is NP-hard.
Proof
The NP-hard problem of GST [54] can be reduced in polynomial time to an MCT problem. Recall a GST instance consists of a weighted graph G with positive edge weights, a root vertex r, and k subsets (groups) of vertices from G. The goal of GST is to find a tree \(G'\) on G that connects r with at least one vertex of each group. We convert an instance of GST to MCT as follows. We provide as input to MCT (i) a channel conversion graph that has exactly the same vertices and edges with G, (ii) the vertex r as root channel, (iii) the k groups as target channel sets, and (iv) the edge weights of the graph as conversion operator costs. This conversion can trivially be done in polynomial time. \(\square \)
Lemma 1
A solution for a kernelized MCT problem also solves the original MCT problem.
Proof
Assume an original MCT problem \(M_o\) with target channel sets \(C_{t_1}\), ..., \(C_{t_k}\) and a kernelized MCT problem \(M_k\) for which those \(C_{t_i}\) have been merged to a single target channel set \(C^{t*}\).
Now let \(t_k\) be an MCT for \(M_k\). Obviously, \(t_k\) is also a conversion tree for \(M_o\), but it remains to show that it is also minimum. For that purpose, we assume that \(t_k\) was not minimum for \(M_o\); in consequence, there has to be some other MCT \(t_o\) for \(M_o\). If \(t_o\) satisfies all target channel sets of \(M_o\) (i.e., the \(C_{t_i}\)) via the same communication channel c, then \(t_o\) would also be an MCT for \(M_k\), which contradicts our assumption. Specifically, c must be a reusable channel, as it satisfies multiple target channel sets. In contrast, if \(t_o\) satisfies the target channel sets of \(M_o\) with different channels, then there has to be at least one reusable channel \(c'\) among them because we kernelize only such target channel sets that have at most one non-reusable channel. As \(c'\) alone can already satisfy all target channel sets of \(M_o\), it follows that \(t_o\) produces more target channels than necessary and is therefore not minimal, which contradicts our assumption. \(\square \)
Theorem 2
Given a channel conversion graph, Algorithm 1 finds the minimum conversion tree if it exists.
Proof
As per Lemma 1, the kernelization does not change the solution of an MCT problem, so we proceed to prove the correctness of the graph traversal algorithm—by induction. Let h be the height of the MCT. If \(h=1\), the conversion tree, which is composed of only a root (cf. Algorithm 1, Line 8), is always minimal as any conversion operator incurs nonnegative costs. Assume an MCT of height h. We prove that our algorithm can output a tree of height \(h+1\) that is also minimal. When merging PCTs two facts hold: (i) any subtree in the MCT must be an MCT (with its own root); otherwise, this subtree has a cheaper alternative and the overall conversion tree cannot be minimal; and (ii) we consider all valid combination of PCTs in the merging phase and hence will not miss out the most efficient combination. Thus, given an MCT with height h, the tree with height \(h+1\) will also be minimal. \(\square \)
Lemma 2
The lossless pruning does not prune a subplan that is contained in the optimal plan with respect to the cost model.
Proof
We prove this lemma by contradiction. Consider an enumeration \(E = (S, \textit{SP})\) and two execution subplans \(\textit{sp}, \textit{sp}'\in \textit{SP}\). Let us assume that both subplans share the same boundary operators and use the same platforms, but \(\textit{sp}'\) has a lower cost than \(\textit{sp}\), so that our pruning removes \(\textit{sp}\). Now assume that the subplan \(\textit{sp}\) is contained in the optimal plan p. If we exchange \(\textit{sp}\) with \(\textit{sp}'\), we obtain a new plan \(p'\). This plan is valid because \(\textit{sp}\) and \(\textit{sp}'\) have the same boundary operators, so that any data movement operations between \(\textit{sp}\) with any adjacent operators in p are also valid for \(\textit{sp}'\). Furthermore, \(p'\) is more efficient than p because the costs for \(\textit{sp}'\) are lower than for \(\textit{sp}\) and besides those subplans, p and \(p'\) have the exact same operators and costs. This contradicts the assumption that p is optimal. \(\square \)
B Data movement algorithm details
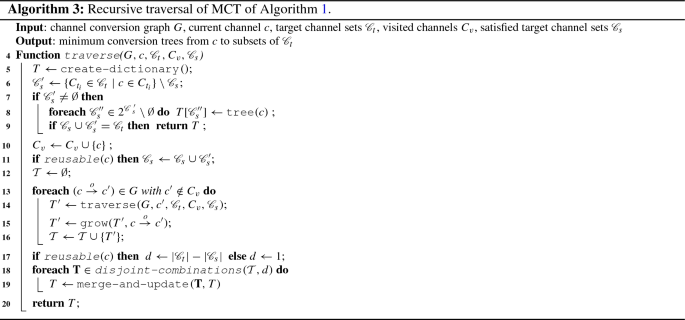
We now explain in further detail the traverse function of Algorithm 1. Its pseudocode is shown in Algorithm 3. The objective of each recursion step is to build up a dictionary T (Line 5) that associates subsets of the target channel sets, i.e., \({\mathscr {C}}_s \subseteq {\mathscr {C}}_t\), with partial conversion trees (PCTs) from the currently visited channel to those target channels \({\mathscr {C}}_s\). While backtracking from the recursion, these PCTs can then be merged successively until they form the final MCT. Essentially, the algorithm uses an exhaustive approach to build all PCTs and in the end merge them to construct the MCT with the least cost. We use the following example to further explain Algorithm 3.
Example 12
Assume we are solving the MCT problem in Fig. 5, i.e., \(c_r := \textsf {Relation}\), \(C_{t_1} := \{\mathsf {Collection} \}\), and \(C_{t_2} := \{ \mathsf {RDD}, \mathsf {CachedRDD} \}\). Also, assume that we have already made one recursion step from the Relation to the Stream channel. That is, in our current invocation of traverse, we visit \(c := \textsf {Stream}\), on our current path we have visited only \(C_v = \{ \textsf {Relation} \}\) and did not reach any target channel sets, i.e., \({\mathscr {C}}_s := \emptyset \).
Visit channel (Lines 6–9) The traverse function starts by collecting all so far unsatisfied target channel sets \({\mathscr {C}}'_s\) that are satisfied by the currently visited channel c (Line 6). If there is any such target channel set (Line 7), we create a PCT for any combinations of those target channel sets in \({\mathscr {C}}'_s\) (Line 8). At this point, these PCTs consist only of c as root node, but they will be “grown” during backtracking from the recursion. If we have even satisfied all target channel sets on our current traversal path, we can immediately start backtracking (Line 9). For Example 12, \(c = \textsf {Relation}\) does not satisfy any target channel set, i.e., we get \({\mathscr {C}}'_s = \emptyset \) and we need to continue.
Forward traversal (Lines 10–16) In the second phase, the traverse function does the forward traversal. For that purpose, it marks the currently visited channel c as visited; and if c is reusable and satisfies some target channel sets \({\mathscr {C}}'_s\), it marks those sets also as satisfied (Lines 10–11). This is important to let the recursion eventually terminate. Next, the algorithm traverses forward by following all CCG edges starting at c and leading to an unvisited channel (Lines 13–14).
Example 13
Continuing from Example 12 where \(c := \textsf {Stream}\), we next visit \(\mathsf {CSVFile}\) and \(\mathsf {Collection}\). Each recursive call yields another dictionary \(T'\) of PCTs. For instance, when invoking \(\texttt {traverse}\) on \(\mathsf {CSVFile}\), we get \(T'[C_{t_1}] = \mathsf {CSVFile} \) (a PCT consisting only of \(\mathsf {CSVFile}\) as root). At this point, we add the followed edge to this PCT to “grow” it (Line 16) and obtain the PCT \(\mathsf {Stream} \rightarrow \mathsf {CSVFile} \). We store all those “grown” PCTs in \({\mathcal {T}}\).
Merge PCTs (Lines 17–20) As a matter of fact, none of the PCTs in \({\mathcal {T}}\) might have reached all target channel sets. For instance, the above-mentioned PCT \(\mathsf {Collection} \rightarrow \mathsf {DataSet} \) is the only one to satisfy \(C_{t_1}\), but it does not satisfy \(C_{t_2}\). Thus, the third and final phase of the traverse function merges certain PCTs in \({\mathcal {T}}\). Specifically, the \(\texttt {disjoint-combinations}\) function (Line 18) enumerates all combinations of PCTs in \({\mathcal {T}}\) that (i) originate from different recursive calls of traverse; (ii) do not overlap in their satisfied target channel sets; and (iii) consist of 1 to d different PCTs. While the former two criteria ensure that we enumerate all combinations of PCTs that may be merged, the third criterion helps us to avoid enumerating futile combinations: When the current channel c is not reusable, it must not have multiple consuming conversion operators, so d is set to 1 (Line 17). In any other case, any PCT must not have a degree larger than the number of not satisfied target channels sets; otherwise, the enumerated PCTs would overlap in their satisfied target channel sets. Note that kernelization lowers the value of d, which reduces the number of target channel sets.
Example 14
Assume we are in the step where we visit \(c = \mathsf {Collection} \). Then, we have 4 outgoing conversion edges from \(\mathsf {Collection} \) but only 1 non-satisfied target channel set, namely \(C_{t_2}\). As a result, we can avoid merging PCTs from all four edges simultaneously, as the resulting PCT could not be minimal.
Eventually, the merge-and-update function combines the PCTs into a new PCT, and if there is no PCT in T already that reaches the same target channel sets and has lower costs, the new PCT is added to T (Line 19).
Example 15
Among others, we merge the PCTs \(\mathsf {Collection} \rightarrow \mathsf {DataSet} \) and \(\mathsf {Collection} \rightarrow \mathsf {RDD} \) in our running example. When we backtrack (Line 20), the resulting PCT will be “grown” by the edge \(\mathsf {Stream} \rightarrow \mathsf {Collection} \) and form the eventual MCT.
Rights and permissions
Open Access This article is licensed under a Creative Commons Attribution 4.0 International License, which permits use, sharing, adaptation, distribution and reproduction in any medium or format, as long as you give appropriate credit to the original author(s) and the source, provide a link to the Creative Commons licence, and indicate if changes were made. The images or other third party material in this article are included in the article’s Creative Commons licence, unless indicated otherwise in a credit line to the material. If material is not included in the article’s Creative Commons licence and your intended use is not permitted by statutory regulation or exceeds the permitted use, you will need to obtain permission directly from the copyright holder. To view a copy of this licence, visit http://creativecommons.org/licenses/by/4.0/.
About this article

Cite this article
Kruse, S., Kaoudi, Z., Contreras-Rojas, B. et al. RHEEMix in the data jungle: a cost-based optimizer for cross-platform systems. The VLDB Journal 29, 1287–1310 (2020). https://doi.org/10.1007/s00778-020-00612-x
Received:
Revised:
Accepted:
Published:
Issue Date:
DOI: https://doi.org/10.1007/s00778-020-00612-x