
Abstract
Purpose
The goal of this study was to refine clinical MRS to optimize performance and then determine whether MRS-derived biomarkers reliably identify painful discs, quantify degeneration severity, and forecast surgical outcomes for chronic low back pain (CLBP) patients.
Methods
We performed an observational diagnostic development and accuracy study. Six hundred and twenty-three (623) discs in 139 patients were scanned using MRS, with 275 discs also receiving provocative discography (PD). MRS data were used to quantify spectral features related to disc structure (collagen and proteoglycan) and acidity (lactate, alanine, propionate). Ratios of acidity to structure were used to calculate pain potential. MRS-SCOREs were compared to PD and Pfirrmann grade. Clinical utility was judged by evaluating surgical success for 75 of the subjects who underwent lumbar surgery.
Results
Two hundred and six (206) discs had both a successful MRS and independent pain diagnosis. When comparing to PD, MRS had a total accuracy of 85%, sensitivity of 82%, and specificity of 88%. These increased to 93%, 91%, and 93% respectively, in non-herniated discs. The MRS structure measures differed significantly between Pfirrmann grades, except grade I versus grade II. When all MRS positive discs were treated, surgical success was 97% versus 57% when the treated level was MRS negative, or 54% when the non-treated adjacent level was MRS positive.
Conclusion
MRS correlates with PD and may support improved surgical outcomes for CLBP patients. Noninvasive MRS is a potentially valuable approach to clarifying pain mechanisms and designing CLBP therapies that are customized to the patient.
Graphical abstract
These slides can be retrieved under Electronic Supplementary Material.

Introduction
There is a pressing need for better diagnostic tools for chronic low back pain (CLBP) patients [1]. CLBP is one of the world’s leading debilitating conditions and is the most common, non-cancer reason for opioid prescription in the USA [2,3,4]. CLBP rates are also rising, particularly for those over age 65 [5]. A team of international experts recently concluded that there is no accepted clinical standard for discogenic pain, and consequently, clinicians are often unable to identify a nociceptive cause [6,7,8].
CLBP diagnostic regimens vary, but usually include medical history, physical examination, imaging, and diagnostic injections. “Discogenic” CLBP (DLBP) diagnosis often results from a process of elimination to rule out other pathology, as well as MRI evidence of at least one degenerated disc as a potential etiology of pain. Provocative discography (PD) became the standard in many regions for DLBP diagnosis, being the second-most used test in DLBP patients behind conventional MRI [9, 10]. More recent low-pressure PD techniques appear more reliable, but still remain invasive, painful, subjective, risky, costly, and widely controversial amidst increasing concerns about significant risks [11]. Consequently, PD usage is declining.
Rationale for choosing between non-surgical and surgical care for DLBP patients is not well defined. While the benefit of surgery for “mechanical” CLBP (such as instability and radicular pain) is supported by a body of outcome literature, the appropriate intervention for DLBP is less clear. Reported success of surgical care for DLBP ranges from 41 to 57% [12] with 5–16% early complication and reoperation rates [13].
The high variability in DLBP management clearly reflects the absence of an evidence-based process to diagnosis and care [14]. As such, there is a significant need for a safe and widely adoptable test and classification system for painful discs that is objectively quantitative, level-specific, correlates with clinical symptoms, and anticipates treatment outcomes. Unfortunately, a reliable and widely accepted diagnostic tool that helps clinicians localize painful discs in DLBP patients is not available [1].
Because discs are avascular, disc cells function in a nutritionally limited environment. Disc cells utilize glycolysis to consume glucose and product lactate. Accumulation of lactic acid lowers disc pH, accelerates degeneration, and was first linked to back pain over 50 years ago [15]. Acid sensing ion channels (ASICs) are stimulated by ischemia and have been associated with chest pain arising from myocardial infarction and bone pain secondary to cancer [16, 17]. ASICs are expressed by disc cells, and their expression increases with degeneration, suggesting a role for these receptors in DLBP [18]. This notion supported by recent data showing neuronal activity of dorsal root ganglion neurons is enhanced by low pH [19]. Despite the physiological significance of disc lactate as a metabolic biomarker, it has not been routinely measurable in the clinic setting.
Magnetic resonance spectroscopy (MRS) is used extensively to characterize in vivo metabolic features within tissue in several clinical contexts. Using ex vivo MRS, Keshari and colleagues demonstrated that certain disc chemicals, specifically lactate (LA) and proteoglycan (PG), provide spectroscopically quantifiable biomarkers for discogenic pain [20]. Recent advances in MRS protocols that augment standard MRI exams have now enabled in vivo biomarker quantification within patients. The goal of this study was to refine MRS protocols to optimize performance and then determine whether MRS-derived biomarkers can reliably identify painful discs, quantify disc degeneration severity, and forecast surgical outcomes.
Methods
Lumbar disc MRS study design
A multicenter, observational, MRS clinical development, and accuracy study was conducted under IRB approval and patient informed consent. The enrolled subjects received MRI imaging and PD as part of their standard care for CLBP. Custom scanner settings and acquisition protocols were developed and confirmed for reliability using commercial Siemens 3T Verio, 3T Skyra, and 1.5T Aera scanner models and SYNGO® SVS spectroscopy pulse sequence. The software protocols and diagnostic algorithm were first optimized using the PD results as training data. Next, the clinical utility of the finalized protocol/algorithm was validated by correlating preoperative MRS results to longitudinal surgical outcomes. Since the outcomes data were not included in either algorithm development or training, and the MRS data were not included into patient treatment decisions or clinical outcomes assessments, the surgical outcomes correlation provided a non-biased assessment of MRS algorithm clinical utility.
We report here the post-processed MRS results using the Siemens 3T Verio acquisitions at a single center (The Orthopedic Center of St Louis, November 2011 to June 2018). These data from DLBP patients were used to determine: (a) voxel prescription geometry criteria for optimal performance; (b) the technical success rate for achieving sufficient spectral quality for chemical quantification; and (c) correlations between MRS-based results to (1) diagnostic controls for painful (P) and non-painful (NP) discs, (2) diagnostic controls for relative degenerative disc disease progression between disc levels, and (3) surgical treatment outcomes.
DLBP patient and lumbar disc population
Patient inclusion/exclusion criteria (Table 1) focused enrollment on patients receiving PD for suspected intra-discal pain versus other potential extra-discal pain sources not quantified by the MRS approach. One-hundred and thirty-nine DLBP patients were enrolled and examined by MRS, with 15 noted deviations from the inclusion/exclusion criteria: spondylolisthesis and/or spondylolysis (n = 9), scoliosis (n = 1), post-fusion (n = 1), leg pain > back pain (n = 4) (Table 2). These 15 deviation patients were included in the PD/MRS algorithm training portion of the study, but were excluded when we correlated MRS to clinical outcomes. This is because patients who strictly met the inclusion/exclusion criteria represent the future intended use population.
Disc levels were selected for MRS by physician preference, typically including discs receiving PD plus other levels (≥ 3 MRS levels recommended per patient). A total n = 623 discs (4.5 discs/patient average) were evaluated via MRS, with n = 275 (44.1%) discs receiving PD. PD was performed using physician preferred techniques, with positive discogram (PD+) results requiring low-pressure provocation (< 50 psi), ≥ grade III annular tear, and a negative control disc (PD−) [21]. PD was performed after the MRS exam, except for two cases where PD was performed at least 6 weeks prior to MRS. The NP group included the discogram negative (PD−) discs. The P group included the PD+ discs, plus other non-PD discs (DX+; n = 24) that were physician-diagnosed as painful based on other clinical criteria (e.g., patient-reported symptoms, physical exam and neurologic deficits, X-ray, MRI, myelogram, diagnostic injections) in patients receiving PD at other levels.
The spectral data were evaluated to determine voxel geometry ranges for optimal signal quality and correlations to diagnostic controls. For example, oversized voxels can overlap adjacent vertebra to create lipid artifact, while small voxels in small discs can have insufficient signal-to-noise ratio (SNR) or also overlap vertebrae. Once optimal voxel criteria were determined (described below), discs with voxels outside these ranges were excluded from P/NP/MRS correlations. Remaining disc spectra that failed spectral quality success criteria were then also excluded from the diagnostic evaluations.
Lumbar disc MRS exam protocol
The custom MRS protocol included a Point-RESolved Spectroscopy (PRESS) sequence and Chemical Selective Suppression (CHESS) for water suppression. Shortened T1-weighted and T2-weighted imaging of sagittal, coronal, and axial planes enabled the scanner operator to prescribe the single voxel (SVS) to encompass the disc nucleus and exclude the vertebral body (Fig. 1). Shimming was performed to optimize water signal before initiating the MRS acquisition series of 160–192 frames using 16 step phase cycle (1500 ms TR, 32 ms TE). This typically required 7 min per disc, plus 15-min MR imaging, for 45–60 min total scanner time for 3–5 discs. The protocol also included additional MR operator techniques to avoid the potential for lipid artifact from bone marrow of adjacent vertebra that can occasionally occur, for example, due to patient motion during the exam.

3-plane voxel prescription in center slices of 3-plane T2-weighted images for L4L5 disc (left: mid-sagittal, center: coronal; right: axial). Optimum voxel prescription includes ≥ 1 cc volume and ≤ 4 mm height
The MRS data were collected as part of a secondary MRI session after routine clinical MRI was already performed as indicated by standard of care. MRS was not utilized in the surgical decision-making process.
Custom MRS data post-processing: spectral quality, quantitation, classification
Disc MRS data post-processing was performed using an investigational NOCISCAN-LS™ software post-processor (Nocimed, Inc.; Redwood City, CA). This signal processing optimized SNR and other spectral quality aspects via the following steps: optimal channel selection; phase error correction; frame editing; frequency shift error correction; apodization; coherent averaging; baseline correction; and artifact correction or filtering. For example, the frame editing uniquely addresses the inter-frame variability of signal quality by excluding frames with relative low quality and retaining only relatively higher quality frames (e.g., as determined by the relative power of the primary water peak in the spectral data). This allows for coherent averaging of only the spectra with the highest SNR, without eroding those peak averages by including lower power acquired data.
Spectral feature quantification including peak value, SNR, and area-under-the-curve (AUC) was performed for:
-
Carbohydrate/collagen (CA) and PG regions as structural integrity markers expected to decrease with disc degeneration, and
-
Alanine (AL), LA, and propionate (PA) regions as acidic pain markers (e.g., from hypoxia, inflammation, and/or Propionibacterium acnes infection) expected to increase with discogenic pain (Fig. 2).
Fig. 2 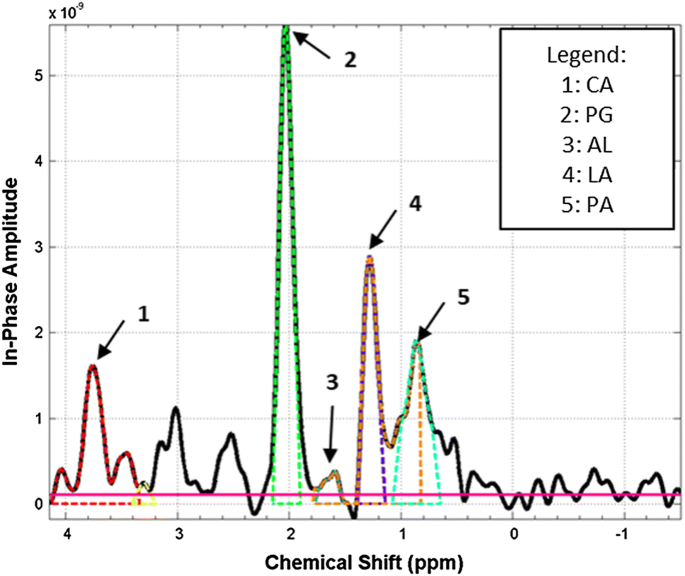
Post-processed absorption spectrum (y-axis) versus chemical shift (x-axis) for L4L5 disc SVS acquisition, indicating peak regions associated with degenerative pain biomarkers quantified by further post-processing

AL and LA regions were combined (LAAL) as one biomarker given adjacent spectral locations. PA was added to LAAL as another combined biomarker, with maximum peak (ALPAm) and the total summed expression (ALPAs) used in the evaluation. In total, six ratios for each disc were calculated with the pain markers in the numerators, and the CA and PG structural integrity markers in the denominators, using an average of peak and AUC ratio calculations after normalizing them to respective saturation thresholds. These averaged ratio values were then differentially weighted and summed to generate a total MRS-SCORE for each disc (0–10 scale), which were then normalized relative to the highest total MRS-SCORE in the patient to generate Normalized MRS-SCOREs (0–1 scale; Fig. 3). The saturation threshold and weighting factors (Table 3) were empirically developed for optimal correlations with PD controls.

Patient example. Left: mid-sagittal T2-weighted MRI image of lumbar spine. Right: six calculated biomarker ratios after normalizing to maximum thresholds and applying differential weighting, and combined total and normalized MRS-SCOREs, for each disc tested
Averaged PG spectral measurements (peak, AUC, SNR) for each disc were normalized to the highest value in that patient to generate a relative “PG-SCORE” as an indicator of structural integrity (scale = 0–1).
Surgical outcomes
Eighty-four of the 139 CLBP study patients received lumbar spine surgery by a single surgeon (co-author, MG). All surgeries were performed at P disc levels (determined by PD plus other clinical criteria) independent of MRS-SCOREs. Eleven of 84 surgery patients that reached 6-month outcomes assessment were excluded from analysis (2 acquisition signal quality failures, and 9 for clinical enrollment criteria deviations: 5 spondylolisthesis, 1 scoliosis, 3 leg pain > back pain), leaving n = 73 patients (and n = 62 also reaching 12-months). Our study protocol included two validated instruments for patient-reported outcomes: Oswestry Disability Index (ODI; 0–100 scale) and Visual Analog Scale (VAS; 1–10 scale) for back pain. We chose a 15-point ODI improvement as an indicator of surgical success since it is the FDA benchmark, it is more stringent than the calculated minimum clinically important difference (12.5-points; [22]), and it is accepted throughout the spine research literature [23,24,25]. As a secondary success metric, we also used a 2-point improvement in VAS for back pain.
Data analysis
Statistical analyses for the MRS-SCORE correlations to P and NP data were performed using the R programming language (R Foundation for Statistical Computing, Vienna Austria). Correlative MRS algorithm development was performed on only those discs with P/NP data as presumed “true” calls. The ability to classify a disc as positive or negative was assessed using thresholds of both the Total and Normalized MRS-SCOREs for that disc. If both scores were below the threshold the, disc was classified negative (MRS−), while if either was above the threshold, the disc was classified positive (MRS+; Table 3; Fig. 4). Thresholds were set using tenfold cross-validation with a preset indeterminate rate of 17.5%, which established an intermediate “MRSmild” range. First, 10% of the data was held out, the thresholds that led to the highest accuracy were chosen on the remaining 90% of the data, and then the status of the held-out discs was predicted using these thresholds. This process was repeated 10 times, each time holding out a separate 10% of the data, which resulted in every disc being predicted in an unbiased manner. This process was repeated 100 times to avoid unusual splits of the data, and the results were averaged.

Patient example. Left: mid-sagittal T2-weighted MRI image of lumbar spine. Center: Total MRS-SCORE total values for disc levels tested. Right: associated post-processed spectra for disc levels tested
PG-SCORES were compared against MRI Pfirrmann grade using two-sample t tests. Pfirrmann grade V discs were not tested per voxel size limitations.
Association between MRS results and surgical success was evaluated using ODI improvement relative to correspondence between the treated level and the MRS classifications for the patient’s discs. “MRSmatch” patients were defined as those who had surgery only at discs that were MRS+ or MRSmild (in patients without an MRS+ disc). “MRSmiss” patients were those who were treated at only an MRS− disc or who had an MRS+ disc left untreated. We compared the proportions of MRSmatch and MRSmiss patients reporting a 15-point ODI improvement (“ODI Success”). Because patient allocation into these groups was based on an objective MRS algorithm derived from patient scans (the vast majority of which were conducted prior to receiving discography), there was no opportunity for assignment bias since the patients were enrolled at diagnostic baseline, prior to any actual surgical planning. These comparisons were also made between different surgical treatment types.
Results
An optimal voxel geometry range of ≥ 1 cc volume and ≤ 4 mm height was determined to most reliably achieve sufficient signal quality (SNR > 4.3) while also avoiding sources of spectral artifacts (e.g., poor shim, lipid contamination from adjacent end-plate overlap). Technical exclusion for not meeting these signal quality criteria resulted in n = 206 total discs used for MRS-SCORE correlations, and n = 172 total discs used for MRS± correlations to P and NP discs (after excluding MRSmild results, 16% of the data, as indeterminate for such correlations) (Fig. 5; Table 4). Of the n = 79 (26.4%) discs excluded for failing these criteria: n = 41 (13.7%) discs had “over-prescribed” voxels that could have been performed at smaller dimensions, while n = 38 (12.7%) discs had < 1 cc voxel volume in severely narrowed discs. Only n = 14 (6.3%) of optimally voxelated discs (≥ 1 cc voxel volume and ≤ 4 mm voxel height) were excluded for signal quality failures: poor shim; artifact believed related to transverse magnetization; and for lipid signature from suspected voxel end-plate overlap (e.g., from uncorrectable patient motion during the MRS exam, or voxel placement error).

Disc (left) and patient (right) sample flowcharts for the MRS algorithm development and clinical outcomes portions of the study, respectively. The 172 discs used in the MRS algorithm development were those that had a pain diagnosis, met both voxel and signal quality criteria, and were outside the 17.5% statistically indeterminate zone. Patients used in the surgical outcomes portion of the study met the clinical inclusion criteria and had MRS scans that met signal quality criteria
MRS-SCORE versus P/NP controls
The total and normalized MRS-SCOREs for the n = 98 P discs were significantly different from the n = 108 NP discs (p < 2 × 10⁻¹⁶). The paired distribution of these values (as used for MRS+/mild/-range determination) also demonstrated significantly more separation between the P and NP control groups than either value evaluated alone (Fig. 6). Both total and normalized MRS-SCOREs were also significantly different for the PD+ discs (i.e., without considering the DX+ discs) versus the PD− discs (p < 2 × 10⁻¹⁵).

Mean and standard deviation distributions of total (y-axis) and normalized (x-axis) MRS-SCOREs P and NP control discs, with overlay illustrating separation of combined application of the scores, and p values for each of the scores
The n = 172 discs classified as MRS± correlated to the P/NP results with 85% total accuracy, 82% sensitivity, and 88% specificity. The cross-validation analyses of MRS± versus P/NP discs demonstrated an average overall accuracy of 84% (range 82–85), with average 81% sensitivity (range 79–82) and 87% specificity (range 83–88). The cross-validation analyses for only the PD± discs (i.e., removing DX+) demonstrated: average overall accuracy of 83% (range 81–85), with average 80% sensitivity (range 76–81) and 86% specificity (range 83–88).
When only non-herniated discs were considered, the MRS± versus P/NP correlations demonstrated 93% total accuracy with 91% sensitivity and 93% specificity.
MRS-SCORE versus surgical treatment outcomes
The preoperative ODI and VAS scores were statistically equivalent for the MRSmatch and MRSmiss groups (58.2 ± 10.9 vs 54.1 ± 12.5 and 7.5 ± 1.5 vs 7.5 ± 1.4 respectively; p > 0.05; Fig. 7). At 6 months, the MRSmatch patients reported significantly better ODI (21.3 ± 15.1 vs 33.2 ± 16.0; p < 0.005) and VAS (1.7 ± 1.9 vs 3.2 ± 2.7; p < 0.05) scores. Similar trends were observed at 12-months, with the MRSmatch showing better improvement than MRSmiss patients in ODI (18.3 ± 17.5 vs 31.6 ± 19.3; p < 0.05) and VAS (1.7 ± 2.1 vs 3.9 ± 2.9; p < 0.05). Treatment success was very high at 94% (44/47) for MRSmatch patients. By contrast, treatment success was much lower at 55% (11/20) for MRSmiss patients (Table 5). When patients were treated at all MRS+ discs, treatment success improved to 97% (35/36); and the one failure missed the 15-point ODI threshold by only one point, but met the alternative VAS 2-point criteria for significant pain improvement. By contrast, outcomes were much poorer in patients with an untreated MRS+ disc (success 54%; 7/13), and patients treated at only MRS− discs (success 57%; 4/7). Patients treated at MRSmild discs had an 82% (9/11) success rate. Among the 62 patients reaching the 12-month follow-up, only 2 improved from failure to success, and only 3 reverted from success to failure, relative to their 6-month data.

Postoperative Oswestry Disability Index (ODI) and Visual Analog Scale (VAS) pain scores were significantly better when surgery was performed at all MRS+ discs (MRSmatch) versus when one or more MRS+ discs were not treated (MRSmiss). a Average Oswestry Disability Index (ODI), and b Visual Analog Scale (VAS) for patients at baseline, 6 months, and 12 months after surgical treatment. *statistically different at p < 0.05; **at p < 0.005
One-level versus 2-level surgeries had similar outcomes comparisons between patient subgroups (Table 6). One-level MRSmatch surgeries were 95% (35/37) successful, with 100% (26/26) success when treating only MRS+ discs. In contrast, 1-level MRSmiss surgeries (MRS− or MRS + adj) had only 59% (10/17) success. When the treated level was MRSmild, the success rate was 82% (9/11) and fell again between the high MRS+ and lower MRSmiss success rates. While only n = 19 patients received 2-level surgery, a similar trend still again showed a higher 90% (9/10) success rate for the 2-level MRSmatch surgeries versus only 33% (1/3) success for the limited few 2-level MRSmiss surgeries.
The PG-SCORES were statistically different (p < 0.05; Table 7) between Pfirrmann grades, with the exception of grade I versus grade II (p = 0.4), indicating that the PG-SCORE could serve as a quantitative measure of disc degeneration.
Discussion
Discogenic low back pain represents a significantly prevalent, and yet challenging diagnostic dilemma that has historically relied for confirmation upon poorly correlative imaging studies or invasive and costly procedural interventions. We questioned whether MRS-derived chemistry data reliably identify painful discs in DLBP patients. To answer this question, we first performed a cross-sectional diagnostic development study to define MRS exam parameters that optimize signal quality. Next, using these optimal parameters we developed an algorithm that captures spectral features of matrix integrity (PG and CA) plus acidity (AL, LA, and PA) that correlates with high accuracy to the reference standard PD. The resulting MRS application is noninvasive, objective, and quantifiable, and demonstrates high sensitivity and specificity for identifying discs corresponding with positive and negative discograms. This accuracy was highest for non-herniated discs without significant extra-discal pathologies as other potential non-discogenic pain sources.
The utility of this MRS diagnostic was evidenced by prospective clinical outcomes correlations, data that were not used to train the MRS diagnostic algorithm. Longitudinal data demonstrate that patients with surgery at MRS+ discs had a much higher success rate (≥ 93%) than when surgery was performed at levels with MRS− discs (50%). The even lower success rates (< 60%) for surgical patients with MRS+ discs that were left untreated also indicate value of the MRS-SCOREs for diagnosis and treatment planning. These data compare very favorably to meta-analyses summarizing randomized clinical trials of surgical care for DLBP, where typical surgical success rates range from 41 to 57% (which is commensurate with the results from MRSmiss surgeries that did not follow the MRS-SCORE guidance in our data) [12].
The first reports of IVD MRS showed significant degeneration-related changes in spectral features from human cadaveric spines [26]. In particular, area ratios of PG to choline and choline to CA discriminated discs of differing Thompson grade. These degeneration-related MRS changes were replicated via enzymatically induced degradation in bovine discs [27]. Subsequent ex vivo analyses of surgical samples revealed that spectral ratios of PG/CA and PG/LA were significantly different between discs judged clinically as painful versus non-painful [20]. The first examples of in vivo IVD MRS indicated that water/PG peak ratios were higher in CLBP patients versus control subjects, and that the water/PG peak area ratio was also elevated in PD+ discs as compared to PD− discs [28]. However, other metabolites that were shown important in prior ex vivo studies (e.g., LA, AL, PA) could not be quantified reliably via standard in vivo spectroscopy techniques in patients’ lumbar discs due to low SNR. To address this, we developed MRS protocols and post-processing software techniques that enhance quality of resulting spectra for more reliable feature quantitation (e.g., that were shown in other studies to improve SNR by up to 400% beyond that achievable using routine MRS approaches). This has allowed robust detection of spectral peaks that we determined, per the algorithms developed in this study, to contribute to the strong correlation with PD± reference data. These MRS protocol and software enhancements facilitated a 94% technical success rate for optimally voxelated discs (206/220; Fig. 5), which mainly reflects an anatomic limitation for excluding very small discs and by limiting the custom MRS application to voxels ≥ 1 cc (typically about a 4 mm minimum disc height limit), or 87% of all discs studied (261/299). These data suggest a widely adoptable approach with high technical success expected for the vast majority of de novo DLBP patients and discs.
We rely on provocative discogram as a reference to set thresholds for the MRS-based diagnostic algorithm as it is the only available test to establish directly whether or not a disc is a pain generator [1]. Yet, there are conflicting data regarding PD validity and its correlation with post-operative outcomes [29]. For example, false-positive responses may be due to concordant pain from pressure increases in an adjacent sensitive disc [30]. And, while some reports show greater symptom improvement when PD is used to guide surgery [31, 32], others do not [33]. In our study, the physician protocol generally specified low pressure (typically ≤ 50 psi above opening pressure), the inclusion of a negative control disc, and at least grade III annular tear criteria. This technique has been reported to improve clinical utility and decrease the false-positive rate to 6% [21]. Additionally, some discs in this study that did not receive PD were clinically diagnosed as painful, as would be standard in a medical practice where PD is not used as a diagnostic tool. Another PD concern is that some argue it is harmful, where PD contrast agents may kill disc cells [34], and accelerate degeneration over the long term [11]. While these PD safety concerns do not negatively reflect on the accuracy of the test as a diagnostic control, they were our primary motivation for developing the new diagnostic test, the clinical utility of which is strongly supported by our longitudinal correlation with clinical outcomes that we also report.
It is worth noting that this MRS test was developed to identify relative differences of pain-related chemicals between individual discs, specifically in individuals suffering from chronic discogenic low back pain. This is opposed to making a pain diagnosis at the level of the patient or distinguishing between patients. Consequently, we trained and evaluated the MRS-based algorithm using PD+/PD− data from a CLBP cohort as the intended use population, and without including non-CLBP or asymptomatic control volunteers. We have reported elsewhere that pain potential is related to both the presence of chemical irritants (such as those assessed by MRS) plus disc/vertebra damage where innervation is elevated and matrix stiffness is reduced [35]. Considering these facts, MRS is not meant to be a stand-alone diagnostic for pain in the absence of some other degeneration-related and clinical factors.
A potential limitation to our study is our relatively short follow-up at 6 and 12 months. However, this time period is sufficient for evaluating the accuracy of the diagnosis, whereas outcomes at longer times are more likely related to the durability of the chosen surgical treatment. In addition, while our MRSmiss patients were slightly older (44.2 vs 39.3; p = 0.047), there were no statistically significant differences in other potential confounding factors such as race, smoking, BMI, and worker’s compensation status (Table 2; p > 0.08) [36,37,38,39]. Nonetheless, given our sample size is comparable to prior studies reporting pain and disability following lumbar fusion [40], our data firmly support the notion that proper level selection in fusion surgery is important, and that limitations in this regard may explain discordance between historically improving rates of technical success (e.g., radiographically confirmed fusion) and lack of proportionate gains in patient outcomes [41].
Despite these limitations, we show that MRS-derived data accurately distinguish PD+ from PD− discs, especially in non-herniated axial DLBP patients. Six- to 12-month surgical success rates were very high for patients treated at all MRS+ discs (and even MRSmild discs in patients without an MRS+ disc), versus low for patients treated at only an MRS− discs or with MRS+ discs left untreated. These data motivate the use of MRS as a valuable new approach to help doctors, in combination with other available clinical information, better diagnose and evaluate treatment options toward more successful outcomes.
Future studies are being planned to investigate MRS applications in the cervical and thoracic spines, although this will likely require still further technical improvements as may be necessary to accommodate the challenges associated with smaller discs along those regions. We also anticipate future use of this MRS tool for other purposes, such as screening for infection, tracking success of biologic therapies meant for disc repair, and studying biochemical mechanisms of action for such new therapies.
All procedures performed in studies involving human participants were in accordance with the ethical standards of the institutional and/or national research committee and with the 1964 Declaration of Helsinki and its later amendments or comparable ethical standards.
References
Brayda-Bruno M, Tibiletti M, Ito K, Fairbank J, Galbusera F, Zerbi A, Roberts S, Wachtel E, Merkher Y, Sivan SS (2014) Advances in the diagnosis of degenerated lumbar discs and their possible clinical application. Eur Spine J 23(Suppl 3):S315–S323
Andersson G (1981) Epidemiologic aspects on low-back pain in industry. Spine 6(1):53–60
Balague F, Mannion AF, Pellise F, Cedraschi C (2012) Non-specific low back pain. Lancet 379(9814):482–491
Ringwalt C, Gugelmann H, Garrettson M, Dasgupta N, Chung A, Proescholdbell S, Skinner A (2014) Differential prescribing of opioid analgesics according to physician specialty for Medicaid patients with chronic noncancer pain diagnoses. Pain Res Manag 19(4):179–185
Centers for Disease Control and Prevention, National Center for Health Statistics, Health in the United States (2014). https://www.cdc.gov/nchs/data/hus/2014/046.pdf. Accessed Nov 2018
Buchbinder R, van Tulder M, Oberg B, Costa LM, Woolf A, Schoene M, Croft P, Lancet Low Back Pain Series Working Group (2018) Low back pain: a call for action. Lancet 391(10137):2384–2388
Foster NE, Anema JR, Cherkin D, Chou R, Cohen SP, Gross DP, Ferreira PH, Fritz JM, Koes BW, Peul W, Turner JA, Maher CG, Lancet Low Back Pain Series Working Group (2018) Prevention and treatment of low back pain: evidence, challenges, and promising directions. Lancet 391(10137):2368–2383
Hartvigsen J, Hancock MJ, Kongsted A, Louw Q, Ferreira ML, Genevay S, Hoy D, Karppinen J, Pransky G, Sieper J, Smeets RJ, Underwood M, Lancet Low Back Pain Series Working Group (2018) What low back pain is and why we need to pay attention. Lancet 391(10137):2356–2367
Fraser RD (1996) The North American Spine Society (NASS) on lumbar discography. Spine (Phila Pa 1976) 21(10):1274–1276
Manchikanti L, Glaser SE, Wolfer L, Derby R, Cohen SP (2009) Systematic review of lumbar discography as a diagnostic test for chronic low back pain. Pain Physician 12(3):541–559
Cuellar JM, Stauff MP, Herzog RJ, Carrino JA, Baker GA, Carragee EJ (2016) Does provocative discography cause clinically important injury to the lumbar intervertebral disc? A 10-year matched cohort study. Spine J 16(3):273–280
Wei J, Song Y, Sun L, Lv C (2013) Comparison of artificial total disc replacement versus fusion for lumbar degenerative disc disease: a meta-analysis of randomized controlled trials. Int Orthop 37(7):1315–1325
Ibrahim T, Tleyjeh IM, Gabbar O (2008) Surgical versus non-surgical treatment of chronic low back pain: a meta-analysis of randomised trials. Int Orthop 32(1):107–113
Andrade NS, Flynn JP, Bartanusz V (2013) Twenty-year perspective of randomized controlled trials for surgery of chronic nonspecific low back pain: citation bias and tangential knowledge. Spine J 13(11):1698–1704
Nachemson A (1969) Intradiscal measurements of pH in patients with lumbar rhizopathies. Acta Orthop Scand 40(1):23–42
Yoneda T, Hiasa M, Nagata Y, Okui T, White F (2015) Contribution of acidic extracellular microenvironment of cancer-colonized bone to bone pain. Biochim Biophys Acta 1848(10 Pt B):2677–2684
Yoneda T, Hiasa M, Nagata Y, Okui T, White FA (2015) Acidic microenvironment and bone pain in cancer-colonized bone. Bonekey Rep 4:690
Immke DC, McCleskey EW (2001) Lactate enhances the acid-sensing Na+ channel on ischemia-sensing neurons. Nat Neurosci 4(9):869–870
Stover JD, Farhang N, Berrett KC, Gertz J, Lawrence B, Bowles RD (2017) CRISPR epigenome editing of AKAP150 in DRG neurons abolishes degenerative IVD-induced neuronal activation. Mol Ther 25(9):2014–2027
Keshari KR, Lotz JC, Link TM, Hu S, Majumdar S, Kurhanewicz J (2008) Lactic acid and proteoglycans as metabolic markers for discogenic back pain. Spine (Phila Pa 1976) 33(3):312–317
Wolfer LR, Derby R, Lee JE, Lee SH (2008) Systematic review of lumbar provocation discography in asymptomatic subjects with a meta-analysis of false-positive rates. Pain Physician 11(4):513–538
Copay AG, Glassman SD, Subach BR, Berven S, Schuler TC, Carreon LY (2008) Minimum clinically important difference in lumbar spine surgery patients: a choice of methods using the Oswestry Disability Index, Medical Outcomes Study Questionnaire Short Form 36, and pain scales. Spine J 8(6):968–974
Zigler J, Delamarter R, Spivak JM, Linovitz RJ, Danielson GO 3rd, Haider TT, Cammisa F, Zuchermann J, Balderston R, Kitchel S, Foley K, Watkins R, Bradford D, Yue J, Yuan H, Herkowitz H, Geiger D, Bendo J, Peppers T, Sachs B, Girardi F, Kropf M, Goldstein J (2007) Results of the prospective, randomized, multicenter Food and Drug Administration investigational device exemption study of the ProDisc-L total disc replacement versus circumferential fusion for the treatment of 1-level degenerative disc disease. Spine (Phila Pa 1976) 32(11):1155–1162 (discussion 1163)
Garcia R Jr, Yue JJ, Blumenthal S, Coric D, Patel VV, Leary SP, Dinh DH, Buttermann GR, Deutsch H, Girardi F, Billys J, Miller LE (2015) Lumbar total disc replacement for discogenic low back pain: two-year outcomes of the activL multicenter randomized controlled IDE Clinical trial. Spine (Phila Pa 1976) 40(24):1873–1881
Gornet MF, Burkus JK, Shaffrey ME, Argires PJ, Nian H, Harrell FE Jr (2015) Cervical disc arthroplasty with PRESTIGE LP disc versus anterior cervical discectomy and fusion: a prospective, multicenter investigational device exemption study. J Neurosurg Spine 23(5):558–573
Keshari KR, Lotz JC, Kurhanewicz J, Majumdar S (2005) Correlation of HR-MAS spectroscopy derived metabolite concentrations with collagen and proteoglycan levels and Thompson grade in the degenerative disc. Spine 30(23):2683–2688
Zuo J, Saadat E, Romero A, Loo K, Li X, Link TM, Kurhanewicz J, Majumdar S (2009) Assessment of intervertebral disc degeneration with magnetic resonance single-voxel spectroscopy. Magn Reson Med 62(5):1140–1146
Zuo J, Joseph GB, Li X, Link TM, Hu SS, Berven SH, Kurhanewitz J, Majumdar S (2012) In vivo intervertebral disc characterization using magnetic resonance spectroscopy and T1rho imaging: association with discography and Oswestry Disability Index and Short Form-36 Health Survey. Spine (Phila Pa 1976) 37(3):214–221
Techy F, Benzel EC (2014) Discography: the data, the myth, and reality. World Neurosurg 82(5):634–637
Hebelka H, Nilsson A, Hansson T (2014) Pressure increase in adjacent discs during clinical discography questions the methods validity. Spine (Phila Pa 1976) 39(11):893–899
Lee CK, Shin DA, Kim HI, Yi S, Ha Y, Kim KN, Yoon DH (2017) Automated pressure-controlled discography in patients undergoing anterior lumbar interbody fusion for discogenic back pain. World Neurosurg 97:8–15
Xi MA, Tong HC, Fahim DK, Perez-Cruet M (2016) Using provocative discography and computed tomography to select patients with refractory discogenic low back pain for lumbar fusion surgery. Cureus 8(2):e514
Smith JS, Sidhu G, Bode K, Gendelberg D, Maltenfort M, Ibrahimi D, Shaffrey CI, Vaccaro AR (2014) Operative and nonoperative treatment approaches for lumbar degenerative disc disease have similar long-term clinical outcomes among patients with positive discography. World Neurosurg 82(5):872–878
Gruber HE, Rhyne AL 3rd, Hansen KJ, Phillips RC, Hoelscher GL, Ingram JA, Norton HJ, Hanley EN Jr (2012) Deleterious effects of discography radiocontrast solution on human annulus cell in vitro: changes in cell viability, proliferation, and apoptosis in exposed cells. Spine J 12(4):329–335
Dudli S, Fields AJ, Samartzis D, Karppinen J, Lotz JC (2016) Pathobiology of Modic changes. Eur Spine J 25(11):3723–3734
Khor S, Lavallee D, Cizik AM, Bellabarba C, Chapman JR, Howe CR, Lu D, Mohit AA, Oskouian RJ, Roh JR, Shonnard N, Dagal A, Flum DR (2018) Development and validation of a prediction model for pain and functional outcomes after lumbar spine surgery. JAMA Surg 153(7):634–642
Anderson JT, Haas AR, Percy R, Woods ST, Ahn UM, Ahn NU (2015) Clinical depression is a strong predictor of poor lumbar fusion outcomes among workers’ compensation subjects. Spine (Phila Pa 1976) 40(10):748–756
Carreon LY, Glassman SD, Howard J (2008) Fusion and nonsurgical treatment for symptomatic lumbar degenerative disease: a systematic review of Oswestry Disability Index and MOS Short Form-36 outcomes. Spine J 8(5):747–755
LaCaille RA, DeBerard MS, Masters KS, Colledge AL, Bacon W (2005) Presurgical biopsychosocial factors predict multidimensional patient: outcomes of interbody cage lumbar fusion. Spine J 5(1):71–78
Koenders N, Rushton A, Verra ML, Willems PC, Hoogeboom TJ, Staal JB (2018) Pain and disability after first-time spinal fusion for lumbar degenerative disorders: a systematic review and meta-analysis. Eur Spine J. https://doi.org/10.1007/s00586-018-5680-3
Cuneo JG, DeBerard MS, Wheeler AJ (2017) Lumbar fusion in Utah workers’ compensation patients: changing outcomes across a decade. Spine (Phila Pa 1976) 42(9):692–699
Author information
Authors and Affiliations
Corresponding author
Ethics declarations
Conflict of interest
Some authors have a financial relationship with the sponsor of the study (MGG, JP, JC, FWS, RKE, and JCL). The authors have full control of all primary data and agree to allow the journal to review data if requested.
Electronic supplementary material
Below is the link to the electronic supplementary material.
Rights and permissions
OpenAccess This article is distributed under the terms of the Creative Commons Attribution 4.0 International License (http://creativecommons.org/licenses/by/4.0/), which permits unrestricted use, distribution, and reproduction in any medium, provided you give appropriate credit to the original author(s) and the source, provide a link to the Creative Commons license, and indicate if changes were made.
About this article

Cite this article
Gornet, M.G., Peacock, J., Claude, J. et al. Magnetic resonance spectroscopy (MRS) can identify painful lumbar discs and may facilitate improved clinical outcomes of lumbar surgeries for discogenic pain. Eur Spine J 28, 674–687 (2019). https://doi.org/10.1007/s00586-018-05873-3
Received:
Revised:
Accepted:
Published:
Issue Date:
DOI: https://doi.org/10.1007/s00586-018-05873-3