
Abstract
Disinformation attacks that make use of social media platforms, e.g., the attacks orchestrated by the Russian “Internet Research Agency” during the 2016 U.S. Presidential election campaign and the 2016 Brexit referendum in the UK, have led to increasing demands from governmental agencies for AI tools that are capable of identifying such attacks in their earliest stages, rather than responding to them in retrospect. This research undertaken on behalf of the Canadian Armed Forces and Department of National Defence. Our ultimate objective is the development of an integrated set of machine-learning algorithms which will mobilize artificial intelligence to identify hostile disinformation activities in “near-real-time.” Employing The Dark Crawler, the Posit Toolkit, TensorFlow (Deep Neural Networks), plus the Random Forest classifier and short-text classification programs known as LibShortText and LibLinear, we have analysed a wide sample of social media posts that exemplify the “fake news” that was disseminated by Russia’s Internet Research Agency, comparing them to “real news” posts in order to develop an automated means of classification.
1 Introduction
One of the key challenges facing governments, intelligence agencies, law enforcement agencies, cybersecurity personnel and business owners-operators worldwide is how to monitor and effectively respond to dynamic and emerging cybersecurity threats, with increasing attention being paid to disinformation activities orchestrated by hostile foreign actors on social media platforms [1]. To illustrate, an application developed by Cambridge Analytica managed to scrape data from over 80 million Facebook pages worldwide. This information was then used to micro-target voters through Facebook advertisements that were premised upon the demographic profiles and known political leanings of those voters, based upon information which had been extracted using the Cambridge Analytica application [2, 3]. In July 2018, Facebook was fined £500,000—the maximum amount allowable under British law—for its mishandling of data in the Cambridge Analytica scandal [4]. In July 2019, the US Federal Trade Commission fined Facebook five billion USD for its failure to protect user privacy [5]. The nexus between Cambridge Analytica, WikiLeaks, and Russian interference in the 2016 U.S. Presidential election remained under investigation by the U.S. Congress as recently as the Summer of 2020 [6].
According to the 2017 Intelligence Community Assessment prepared by the Central Intelligence Agency (CIA), the Federal Bureau of Investigation (FBI) and the National Security Agency (NSA), a number of other social media platforms including Instagram and Twitter were also implicated as (possibly unaware) participants in the hosting and dissemination of disinformation attacks associated with the Russian “Internet Research Agency” (IRA) [7]. Special Counsel Robert Mueller’s report into Russian interference in the U.S. Presidential election [8] set out how purposively designed Facebook and Twitter accounts targeted certain groups, such as Southern Whites (through the Patriototus Facebook page), the right-wing anti-immigration movement (through the Secured Borders Facebook page) and Blacks (through the Blacktivist Facebook page), as well as through Twitter feeds such as the anti-immigration account @America_1st and @TEN_GOP (which falsely claimed to have a connection to the Republican Party of Tennessee). In the UK, Russian-orchestrated disinformation campaigns—which primarily stoked Islamaphobic and anti-immigration passions—made extensive use of Twitter employing handles such as #voteleave and ReasonsToLeaveEU [9,10,11,12]. Evidence also indicates that the Russian IRA maximized use of social media bots in their 2016 assaults on the U.S. Presidential election and the U.K. Brexit referendum [9, 10, 13, 14], thereby amplifying the disinformation content in order to reach and influence a much wider audience. Recent research demonstrates clearly that the Russian IRA also attempted to interfere in the 2020 U.S. Presidential election [15,16,17]. More will be said about Russian involvement in disinformation warfare in Sect. 2 of this paper, wherein we present our literature review.
Our research is being conducted by the International CyberCrime Research Centre (ICCRC) at Simon Fraser University in Canada, in cooperation with the Department of Information and Computer Sciences at the University of Strathclyde in Scotland. Essentially, this ongoing project undertaken on behalf of the Canadian Armed Forces (CAF) and the Department of National Defence (DND) contemplates the development of an artificial intelligence (AI) tool for identifying hostile disinformation activities on social media platforms on-the-fly, or if not, then at least in near-real-time. It is anticipated that the knowledge generated by our research will aid the CAF and the DND in the rapid and accurate pinpointing of disinformation attacks in their very early stages, and allow them to take action where appropriate.
For the present study we employed automation (AI) tools that include The Dark Crawler (TDC), TensorFlow (Deep Neural Networks), Random Forest, LibShortText, LibLinear and Posit. Additional information on these research tools is provided in Sect. 3, wherein we set out our methodology. This present paper will focus on the classification accuracies attained by TensorFlow, Random Forest, LibShortText, LibLinear and the Posit toolkit when it comes to their ability to discern between real information and dis/misinformation, sometimes referred to as “real news” and “fake news.” Our research results are reported in Sect. 4, and elucidated further in Sects. 5 and 6, wherein we discuss our results, set out the directions that our future research endeavours are expected to take, and present our interim conclusions.
2 Literature review
As noted in Sect. 1, social media platforms have come under increasing scrutiny for permitting hostile foreign actors to manipulate public opinion through fake social media accounts that disseminate false information or “fake news” [18,19,20]. This false information or fake news can be broken down into two broader categories: misinformation and disinformation. The less sinister of the two, misinformation, is simply inaccurate or false information. While sometimes used by hostile foreign actors, misinformation may also be based upon a genuine misapprehension of the facts, as opposed to having been created with any particular intention of deceiving or manipulating people [21,22,23]. Disinformation, on the other hand, especially when employed by hostile foreign actors, is created and spread intentionally for the purpose of deception and manipulation of public opinion [21, 23, 24].
An example of misinformation might be the oft-repeated claims by anti-vaccination groups that vaccinations contain toxins, that they erode immunity, or that they have been proven to be associated with autism or sudden infant death syndrome [25], often buttressed by making reference to a study by Andrew Wakefield, which was published in (and then subsequently withdrawn by) the medical journal, The Lancet. Wakefield’s findings were premised upon a sample of only 12 children and relied exclusively upon the beliefs and recollections of their parents, without any sort of control group in place [26]. Although the article was withdrawn by The Lancet, the study has continued to provide fuel for the anti-vaccination movement, which itself is housed largely on the Internet [26]. Fake news may be promulgated for a variety of reasons, such as profit, the favouring of a particular partisan ideology, or supporting unfounded beliefs or conspiracy theories [1, 18, 27].
The activities of Russia’s IRA during the 2016 U.S. Presidential election are a prime example of a disinformation campaign mounted by a hostile foreign actor [10, 13, 28, 29]. In February 2018, U.S. Special Counsel Robert Mueller obtained a grand jury indictment against the IRA (which was bankrolled by Yevgeniy Prigozhin, often referred to as “Putin’s chef”), plus Prigozhin’s American-based companies Concord Management and Consulting LLC and Concord Catering as well as Prigozhin himself, along with a dozen Russian “trolls” who were employed by Prigozhin’s IRA. The indictment stated that the accused had “operated social media pages and groups designed to attract U.S. audiences” in order to advance divisive issues and create discord, falsely claiming that those pages and groups were controlled by American activists [9, 30].
The dozen Internet “trolls” described in Mueller’s indictment belonged to a larger workforce comprised of approximately 1000 Russian trolls employed by Prigozhin’s IRA [31,32,33]. Working in a building in St. Petersburg, these IRA employees toiled around the clock in two, 12-h shifts (a day shift and a night shift), with the objective of fomenting discord, dissent, distrust and hostility within and between targeted groups in the American populace [34,35,36]. In particular, these IRA trolls were instructed to spread disinformation that would buttress Donald Trump’s campaign for the U.S. Presidency, while undermining the campaign of Hillary Clinton [7, 32, 36, 37].
The Computational Propaganda Project housed primarily in the Oxford Internet Institute, reported that 19 million identifiable “bot” accounts tweeted in support of Trump or Clinton in the week leading up to the 2016 Presidential election, with 55.1% of those in favour of Trump and only 19.1% in favour of Clinton [38,39,40]. This apparent disparity in Twitter support is difficult to account for except in terms of highly orchestrated and deliberate political interference, given that Hillary Clinton received 65,844,954 votes compared to Donald Trump’s 62,979,879 votes [41].
According to a study by Zannettou et al., 71% of these “fake” accounts were created prior to the 2016 election [36]. The 2017 Intelligence Community Assessment prepared by the CIA, FBI and NSA indicated that Russian operatives began researching the US electoral processes and election-related technology as early as 2014 and that the Prigozhin-led IRA had started advocating on behalf of Donald Trump’s candidacy as early as 2015, one year prior to the election [7]. Zannettou et al. reported that 24 accounts were created a week before the Republican National Conference (at which Donald Trump was formally nominated as the Republican candidate for the 2016 Presidential election) [36]. The study also found that the Russian Internet trolls attempted to mask their disinformation campaign by adopting different identities, changing their screen names and profile information, and in some cases, deleting their previous tweets.
Much has been said about the use of social media bots during the 2016 U.S. presidential election and the 2016 U.K. Brexit referendum [10, 13, 14]. Briefly, the transfer and transformation of information on the Internet is not accomplished by people, but rather, by algorithms, which are scripts that convert mathematical expressions into instructions for the Internet [39]. The Cambridge Analytica application, which attracted so much negative attention to Facebook in the aftermath of the 2016 U.S. Presidential election and the 2016 U.K. Brexit referendum, would be an example of an algorithm that was designed for the express purpose of collecting and evaluating behavioural data such as the likes, dislikes and political proclivities of the Facebook users whose data it collected [42].
It is estimated that these social media bots comprise between 5 and 9% of the overall Twitter population and account for approximately 24% of all tweets [43]. Stories that “go viral”—i.e. that rise to the top of Twitter feeds—are often pushed there by these social media bots through manipulation of the social media platform’s algorithms [43].
Many consumers of “fake news” or dis/misinformation tend to accept what they read at face value. The Pew Research Center reports that 36% of Americans get their news from Facebook [44], and of those who use Twitter regularly, over half depend on Twitter as their source of news [44, 45]. It can be said that the frequent tweeting and re-tweeting of dis/misinformation by bots leads to ever-increasing exposure, resulting in an “echo chamber effect” [46]. Evidence also suggests that many individuals are unable to distinguish between factual and non-factual content found on Twitter and Facebook [24]. Indeed, according to a Stanford University study, far too many are inclined to accept images or statements that they come across on social media at face value, without questioning the source of those images or statements.
Russian interference is by no means restricted to the US and the UK. To illustrate, in 2019, the European Commission released a progress report on its Action Plan Against Disinformation. According to the Commission, evidence gathered throughout 2018 and early 2019 confirmed ongoing disinformation activities originating from Russian sources, believed to be undertaken for the purpose of influencing voter preferences and suppressing voter turnout in the EU Parliamentary elections [22, 47]. A recent study of Canadian Twitter data suggests that Russian trolls were behind “fake news” stories that attempted to stoke fear and distrust between Muslims and non-Muslims following the 2017 shooting deaths of six worshippers at a mosque in Quebec City, leading to renewed concerns that Russian trolls might attempt to interfere in the Fall 2019 Canadian federal election [48, 49]. Indeed, Russian disinformation activities on social media have continued apace in a concerted effort to promote anti-NATO sentiments and push pro-Russian narratives around the globe [49].
This is not to suggest that all known disinformation campaigns have been launched by Russia. A 2019 inventory compiled by the Oxford Internet Institute found evidence of disinformation campaigns in 70 different countries around the world, for example, Armenia, India, Malaysia, Mexico, The Philippines, Saudi Arabia, The United Arab Emirates and Venezuela [50]. Countries such as China and Saudi Arabia are believed to be making increasing use of disinformation campaigns beyond their own borders [51]. That said, Russian disinformation activities have been documented in the Czech Republic and Slovakia as far back as 2013 [52], and in the 2014 election in the Ukraine, which itself followed shortly after Russia’s annexation of the Crimean Peninsula [53, 54].
Observers have warned that Beijing is now seeking narrative control on a worldwide scale, believing that it must prevent any critical external opinions of its policies or practices from entering domestic discourse out of fear that they may damage the image of the CCP [54]. Recently, the Chinese government’s approach has become more aggressive, as they attempt to exploit the openness of Western societies by eroding trust in their democratic institutions and processes via execution of state-sponsored disinformation [54]. Chinese disinformation has struck against states within their immediate vicinity, e.g. Taiwan and Hong Kong, as well as against nations such as Australia, Canada and the US [55, 56].
Iran has employed foreign interference against Canada via disinformation on social media, particularly Twitter [48, 56]. The 2015 Canadian federal election was targeted by Iran, although in contrast to Russian activities, Iranian disinformation was primarily anti-Harper (the former Prime Minster of Canada) [47]. More recently, Iran has engaged in interference on Twitter, posting about Canadian pipelines [56].
The Chinese and Iranians have learned from and adopted Russian strategies and techniques, making it difficult to distinguish between these foreign state actors [57]. A complicating factor is the adoption of Russian strategies and techniques by far-right domestic groups. Nonetheless, some differences appear, especially in terms of the lack of sophistication of Chinese disinformation when micro-targeting particular subgroups and Iran’s generally more “left-leaning” choice of content [58].
Various researchers have mobilized artificial intelligence to counter the type of disinformation warfare employed by Russia during the 2016 U.S. Presidential election and the 2016 U.K. Brexit referendum. In 2017, Darren Linvill and John Walker (from Clemson University) gathered and saved vast numbers of Twitter postings (prior to their removal from the Internet by the platform, thereby preserving the evidence and making the data available to the academic, cyber-security and law enforcement communities for study [51]. Our research team has made extensive use of the IRA’s Twitter postings that were gathered, saved and made available by Linvill and Walker.
In 2017, William Yang Wang released his LIAR dataset, which included 12,836 statements labelled for their subject matter, situational context, and truthfulness, broken down into training, validation, and test sets, along with instructions for automatic fake news detection [59]. In addition, William Wang reported that the open-source software toolkit, LibShortText, developed by the Machine Learning Group at National Taiwan University, had been shown to perform well when it came to short text classification [60, 61]. The dataset provided by Linvill and Walker and the suggestion by William Wang about using LibShortText were both used by us to inform and refine the machine learning and automated analysis processes described in the following sections on Methodology and Research Results.
In the above-mentioned study using the LIAR dataset, William Wang found that when it came to automatic language detection, a hybrid convoluted Deep Neural Network that integrated both meta-data and text produced superior results to text-only approaches [59]. We are employing a somewhat similar approach to that of William Wang, in that we are using a combination of Tensor Flow [61], the LibShortText program developed by the Machine Learning Group at National Taiwan University [60], LibLinear, a companion open source software package to LibShortText, again developed by the same Machine Learning Group at National Taiwan University that developed LibShortText [62], a text-reading program (the Posit toolkit) that also produces meta-data or mark-up [63, 64], plus the Random Forest classifier [64].
Employing techniques of machine learning and natural language processing, a 2018 study of Twitter troll activity in the 2016 U.S. Presidential election found that a model blending measurements of “precision” and “recall” failed to accurately classify 34% of troll posts, suggesting that such models could not be relied upon to identify and screen out fake news [65]. However, a 2019 paper entitled “Defending Against Neural Fake News” reports on the development of GROVER, a computer model that can both generate and detect neural fake news, premised on the notion that while most fake news is presently generated by humans, the fake news of the future may be generated by machines. The authors of this paper report additionally that they have been able to discriminate fake news with an accuracy of 92%, as opposed to the more standard 73% accuracy exhibited by other fake news discriminators [66]. Our research results, reported below, come closer at times to approximating those described in this 2019 study.
Recently, there has been an increasing focus on the detection of foreign-controlled “bots” and “sock puppet” accounts as a means of identifying disinformation campaigns [67]. As noted previously, bots are social media accounts that are controlled by software rather than by real people [39]. Use of bots can artificially cause a topic or hashtag to trend, reaching many more users than could be reached by sending messages manually [68]. Sock puppet accounts are operated by users who are pretending to be someone else. They seek to accumulate a history of activity and obtain a level of trust in order to create the impression that they are legitimate sources of information. The accounts are usually disguised by employing different identities (multiple users) that seemingly have no relationship to each other, but they can be detected because the supposedly “different” accounts exhibit similar sentiment orientation and behaviours [69].
3 Methodology
Our analysis of “fake news” messages posted by the (IRA), before, during and after the 2016 U.S. Presidential election, employed a variety of approaches, including collection of IRA posts and “real news” datasets using TDC, plus machine analysis of large samples of the posts using TensorFlow, Random Forest, LibShortText, LibLinear and the Posit toolkit. Although this research was geared primarily toward machine learning and the development of an artificial intelligence tool to aid in the rapid and accurate pinpointing of disinformation attacks in their early stages, we also conducted qualitative, textual analysis of 2500 of the Russian IRA’s “fake news” Twitter posts and 2500 of their “fake news” Facebook posts in order to cross-validate the classification accuracies of the machine-learning algorithms and to probe into the alleged degree of Russian involvement in the alleged disinformation warfare campaign.
3.1 The dark crawler
TDC is a custom-written, web-crawling software tool, developed by Richard Frank of Simon Fraser University’s ICCRC. This application captures Web content from the open and Dark Web, as well as structured content from online discussion forums and various social media platforms. TDC uses key words, key phrases and other syntax to retrieve relevant pages from the Web. TDC analysed them and recursively follows the links out of those pages. Statistics are automatically collected and retained for each webpage extracted, including frequency of keywords and the number of images and videos (if any are present). The entire content of each webpage is also preserved for further manual and automated textual analysis. Content retrieved by TDC is parsed into an Excel-style worksheet, with each data element being identified and extracted. In previous studies of this nature, we have employed this same procedure to collect over 100 million forum posts from across a vast number of hacking and extremist forums, to be used for later analysis [70, 71].
3.2 Natural language processing
We employed OpenNLP for data extraction and pre-processing for TensorFlow, LibShortText, LibLinear and Random Forest. OpenNLP was originally a Java-based machine learning toolkit for the processing of natural language text [71], which, although Java-based, can be integrated into a.NET-based program. It has also been ported to the.NET family of languages, which we used for our NLP needs. The tools included in this processing include:
-
(1)
a sentence detector to separate paragraphs into sentences (not a trivial job, given how acronyms and numbers can also use periods)
-
(2)
a tokenizer to separate the sentences into words
-
(3)
a Part-Of-Speech tagger to tag each word with the type of word it is (noun, verb, etc.) based on the word and the context it is found within
-
(4)
a chunker, to group the tagged words into groups for easier analysis
All of these components were then combined to extract more information from the given text.
This data that we input to the machine-learning models contains only the ID of the content and the full textual content of the social media post, which are fed into OpenNLP, which then analyses each text and generates extra statistics about the text. In our case, an additional 126 features are generated for each text, and were appended to the data. This data is then moved onto the Windows server and Linux Server, where the various algorithms are used to build the respective models.
3.3 TensorFlow (Deep Neural Networks)
TensorFlow, originally developed by the Google Brain Team, is a machine learning system that employs deep neural networks, inspired by real-life neural systems [61]. The learning algorithms are designed to excel in pattern recognition and knowledge-based prediction by training sensory data through an artificial network structure of neurons (nodes) and neuronal connections (weights). The network structure is usually constructed with an input layer, one or more hidden layers, and an output layer. Each layer contains multiple nodes, with connections between the nodes in the different layers. As data are fed into this neural system, weights are calculated and repeatedly changed for each connection [61].
To elaborate, Deep Neural Networks (DNN) constitute a network of neurons, or nodes, which are organized into rows, each of which represents a layer. Layers are identified as input, hidden and output, respectively. The input layer takes information directly from the data, as an input value, and passes it through to the DNN. Hidden layers exist between the input layer and the output layer. DNNs can use any number of hidden layers for the network. The greater the number of hidden layers, the deeper the DNN becomes. Multiple hidden layers allow DNNs to solve more complex problems, by preventing the Network from relying on linear separability, as would be the case with decision trees. Where decision trees follow a linear rule pattern, establishing which class values exhibit specific characteristics, DNNs can generate patterns that are not limited to a single dimension. The output layer displays the various outputs required for the problem. In this case, the class values (real, fake or other) would be presented in the output layer. Figure 1 demonstrates what a DNN looks like. In this example the DNN is attempting to predict the probability of a specific type of Iris (plant genus). In the input layer, information about specific characteristics of Irises are exposed to the DNN, after which the hidden layers attempt to group the characteristics into categories. The output layer then produces the probability that an Iris will be a certain species.

Neural nodes of a DNN used to predict probability of an Iris type
In the early stages of experimentation, we employed TensorFlow default settings for the parameters pertaining to the number of partitions, epochs, layers, learning rate, and regularization. With respect to regularization, data was partitioned into groups according to the order in which it appeared in the dataset. Thus, if the majority of the “real information” messages appeared in the beginning of the dataset, it would be difficult to maintain consistent accuracy when conducting X-fold cross-validation. To overcome this issue, the data were randomized as it became partitioned. Furthermore, each partition maintained the same data across all X-fold cross-validation tests, so that the accuracy of the results could be compared properly.
TensorFlow next compared the same data against the constructed Deep Neural Networks model and utilized that model to predict the category for each data entry. To be able to run large numbers of experiments, we wrapped all code into a standalone function, so that large numbers of various scenarios could be designed, set up and tested continuously. These batch jobs allowed us to evaluate different combinations of parameters. The parameters of each run, and the corresponding results, are also shown below. Tests were run using 10 partitions, with training on the first 9 partitions, and testing on the last partition.
3.4 LibShortText
LibShortText is an open-source software package, developed by the Machine Learning Group at National Taiwan University. The use of LibShortText was recommended in a 2018 paper by William Yang Wang of the University of California at Santa Barbara, wherein he also described (and provided access to) his benchmark LIAR dataset. This LIAR dataset, which included 12,836 statements labelled for their subject matter, situational context, and truthfulness, was broken down into training, validation and test sets and was accompanied by instructions for automatic fake news detection [60].
LibShortText is said to be more efficient and more extensible than other generalized text-mining tools, allowing for the conversion of short texts into sparse feature vectors, and also for micro- and macro-level error analysis [60]. On a typical computer, for example, processing and training with 10 million short texts requires only half an hour or so, whereas some text-mining tools such as Posit (discussed later) might require a day or more. LibShortText includes an interactive tool for error analysis, and the program’s default options usually work well, without tedious fine-tuning.
For our research project, we built a model using the default settings that came with the LibShortText software. We started by running “$ python text-train.py trainfile,” which generated a “trainfile.model” for our given “trainfile.” Working with this previously built model, we set out to predict the classification labels of the test set, or “trainfile,” using the instructions: “$ python text-predict.py -f testfile trainfile.model predict_result,” followed by “Option –f” to overwrite the existing model file and predict_result.
3.5 LibLinear
LibLinear is a companion open-source software package to LibShortText, again developed by the same Machine Learning Group at National Taiwan University that developed LibShortText [62]. LibShortText is a text analysis program, while LibLinear is a classification program. LibLinear predicts the accuracy of the classification performed by LibShortText, much like WEKA predicts the accuracy of the classification performed by Posit (discussed below). Another advantage to LibLinear is that it supports incremental and decremental learning, or to express it differently, the addition and removal of data in order to improve optimization and decrease run time. LibShortText, on the other hand, does not readily support updating of the model.
In an earlier test run, using a “train” dataset consisting of 90,000 “fake news” articles taken from the Kaggle and FA-KES datasets and the ISOT (fake news) dataset, juxtaposed with 80,000 “real news” articles taken from the ISOT (real news) dataset plus sources such as the BBC, CBC, The Globe & Mail, Sky News and the Vancouver Sun, followed afterward by a “test” data set using 90,000 of the same real news articles and 10,000 of the same fake news articles, LibLinear yielded a remarkable classification accuracy of 98.24%. This however was a smaller dataset used as a preliminary test to determine viability of using this algorithm for our experiments.
3.6 Random forest
A decision tree is one of the basic, and probably most understandable, classification algorithms [72]. In the Random Forest method, classification trees (of the type found in WEKA) are independently constructed by employing a bootstrap sample of the entire dataset, and then relying on a simple majority vote for predictive purposes (see Fig. 2), rather than relying on earlier trees to boost the weight of successive trees [65, 73]. WEKA [74] employs a standard J48 tree classification method with tenfold cross-validation. In this cross-validation, 10% of the data are hidden, and conditions are sought that will split the remaining 90% of the dataset in two, with each part having as many data-points as possible belonging to a single class. Accuracy of the tree is then considered relative to the hidden 10% of the data. This process is normally repeated 10 times, each time with a different hidden 10% subset, with WEKA producing a measure of how many data items were correctly classified.

Random es (Retrieved from https://compgenomr.github.io/book/trees-and-forests-random-forests-in-action.html
The predicted label of Random Forest’s input data is a vote by the trees in the forest, weighted by their probability estimates. That is, the predicted class is the one with highest mean probability estimate across the trees. Thus, the prediction probabilities of Random Forest can be computed as the mean predicted class probabilities of the trees in the forest, and the class probability of a single tree is the fraction of samples of the same class in a leaf [75].
3.7 The combined model
The combined model that we presently envision (see Fig. 3) commences with TDC, which collects data from social media platforms, which are then stored in TDC’s database (Step 2). The section of the data for which known labels exist (e.g. dis/misinformation, real information or other) is exported into a flat-file (CSV format—Step 3). This data contains only the ID of the content, and the full text of the content and is fed into our NLP algorithm (OpenNLP in our case) which analyses each text and generates extra statistics about the text; in our case, for each text, an additional 126 features are generated and appended to the exported data. This data is then moved onto the Windows server (Step 5a) and Linux Server (Step 5b) where the various algorithms are used to build the respective models. A total of 4 models have been built, Random Forest (using Scikit-learn) and Deep Neural Networks (using TensorFlow) are built on Windows (where TensorFlow seems more stable) while LibLinear and LibShortText are built on Linux (where those algorithms were found to be more stable). Once the resulting model files are generated, the process is complete, and the system is ready for prediction on new content.

Model building process
In TDC, a new feature is available where users can browse paginated results of predicted posts, sorted mainly by Real, Fake and Troll class categories and News, Twitter and Facebook source types. On top of the predicted probabilities, the user can edit the four textbox fields right below the columns for each model type (i.e. LibLinear, LibShortText, Random Forest, TensorFlow) to set the weights and click calculate to see the effective total probability of prediction (see Fig. 4).

Weight entry validation
The formula for calculating the total probability is as follows:
where LL is the LibLinear model; LST is the LibShortText model; TF is TensorFlow’s Deep Neural Net model; RF is the Random Forest model and Wx represents the user-assigned weight for algorithm x; Px represents the probability of the requested class, as predicted by algorithm x.
For example, when calculating the prediction probability that a specific text is “real”, the user-defined weight for LibLinear (WLL) is multiplied by the probability that the text is “real” according to LibLinear (PLL), which is then added to the weight and probabilities of the other three algorithms. The final total is divided by the sum of weights assigned to all four algorithms, resulting in a weighted average. If the user prefers to use only a single algorithm, the weight can be set to 1, with the weights of the other algorithms set to 0. The ultimate goal is to provide a prediction and alert process whereby the user can be notified of a disinformation campaign on social media in near-real-time.
LibLinear, Random Forest and TensorFlow model algorithms have an option for printing out the predicted class probabilities (floating-point numbers between 0.0 and 1.0). Currently we are storing this information in the database along with the predicted labels. LibLinear presently supports probability outputs for logistic regression only. The probability model for logistic regression is:
The predicted label of Random Forest’s input data is a vote by the trees in the forest, weighted by their probability estimates. That is, the predicted class is the one with highest mean probability estimate across the trees. Thus, the prediction probabilities of Random Forest can be computed as the mean predicted class probabilities of the trees in the forest, and the class probability of a single tree is the fraction of samples of the same class in a leaf [75].
For the TensorFlow DNN classification model, tf.estimator.DNNClassifier returns four predictions: logits, probabilities, class_ids, classes, where class_id is integer and classes is string representing the predicted class.
3.8 The posit toolkit
The Posit toolkit was developed by George Weir of the Department of Computer and Information Sciences at the University of Strathclyde. Posit generates frequency data and Part-of-Speech (POS) tagging while accommodating large text corpora. The data output from Posit includes values for total words (tokens), total unique words (types), type/token ratio, number of sentences, average sentence length, number of characters, average word length, noun types, verb types, adjective types, adverb types, preposition types, personal pronoun types, determiner types, possessive pronoun types, interjection types, particle types, nouns, verbs, prepositions, personal pronouns, determiners, adverbs, adjectives, possessive pronouns, interjections and particles. When analysing texts using Posit, output is generated at several levels of detail. Of these, the summary level is the most general, e.g. the total number of verbs, nouns, adjectives, etc. for a total of 27 features in all. An example of such output is shown in Fig. 6.
As it was configured for previous studies, the Posit toolkit created data on the basis of word-level information; thus, the limited content of the Russian IRA tweets that we were examining meant that many of the original features might have zero values. For this particular research project, Posit was extended to include analysis of character-level content, to assist with the analysis of short texts. To this end, the system supplemented the standard word-level statistics, generating an additional 44-character features for each instance of text data. These new features included quantitative information on individual alphanumeric characters, plus a subset of special characters—specifically, exclamation marks, question marks, periods, asterisks and dollar signs. The extension of Posit to embrace character-level as well as word-level data maintained the domain-neutral nature of Posit analysis. As a result of this extended Posit analysis, each data item (tweet) was represented by a set of 71 features, rather than the usual twenty-seven [1].
Thereafter, Posit’s summary values for each data item are treated as features that describe the associated item. Each data item is thereby represented by numerical values for Posit’s 27 summary features. To these features, we can add the pre-classification value–in the present case, this is either “real” information or “misinformation”—thereby characterising each data item by these 28 features (see Fig. 4).
In the case of Posit, the resultant data were input to the WEKA data analysis application. For Posit, the standard J48 tree WEKA classification method was applied, augmented with the Random Forest classification method, both with ten-fold validation (as described above). WEKA then produced a measure of how many of the text items were correctly classified. In the Random Forest method, classification trees (of the type found in WEKA) are independently constructed, by employing a bootstrap sample of the entire dataset, and then relying on a simple majority vote for predictive purposes, rather than relying on earlier trees to boost the weight of successive trees.
Using a software tool such as WEKA, we evaluate the efficacy of the quantitative data as a basis for matching the pre-classification of the considered data set. Specific algorithms are selected within the classification tool. Combined with the feature set, the software tool (WEKA) builds a classification model and considers its ability to match the pre-classification. As detailed elsewhere, the evaluation of any model’s performance in WEKA generates the following measures: confusion matrix, accuracy (acc), precision (pr), recall (rec) and F1 score (f1). A confusion matrix is an NxN table that summarizes model performance, where N is the number of classes being considered.
In the preliminary stages of our research, we envisioned the Posit toolkit as part of our combined model, along with TDC, TensorFlow (Deep Neural Networks), LibShortText, LibLinear and Random Forest. However, we found that Posit worked better as a stand-alone model, as it was taking longer than LibShortText and LibLinear to process social media messages, and did not integrate particularly well into the.Net and REST applications being used for the other machine-learning algorithms. Nevertheless, Posit performed as well as some of the other machine-learning algorithms employed in our combined model, and at times outperformed one or more of them in certain experiments. Thus, we have continued to employ Posit in our research, and in fact, used it in a recent study of COVID-19 dis/misinformation on social media.
3.9 The research sample
At the beginning of the project, the research team downloaded a dataset of 2,946,219 Twitter messages (tweets) from git.hub, which had been posted online by fivethirtyeight.com. This dataset of tweets was collected and assembled by the aforementioned professors from Clemson University, Darren Linvill and Patrick Warren [51]. These tweets were described as originating from the Russian IRA, also referred to in common parlance as the Russian troll factory, a hostile foreign agency that was believed to have intentionally interfered in the 2016 U.S. Presidential election and the 2016 U.K. Brexit referendum. As the various approaches used in our research (i.e. manual qualitative analysis, Posit, TensorFlow, LibShortText and Random Forest) were designed to read English text, a decision was made to extract only those entries that were labelled as being “English,” so in the process, we excluded languages such as Albanian, Bulgarian, Catalan, Croatian, Dutch, Estonian, French, German, Italian, Russian, Ukrainian, Uzbek, Vietnamese. As a consequence, 13 new Excel spreadsheets were created, with 2,116,904 English-speaking tweets remaining in the dataset following the removal of all non-English tweets.
Having acquired the Russian (IRA) Twitter data, we then sought a second Twitter dataset that would allow us to develop a classification model based upon comparison between “real news” and what has often been referred to simply as “fake news”. To this end, we analysed the textual content from the full set of IRA tweets (or “fake news”) using Posit, in order to identify frequently occurring terms, and more specifically, nouns. The resultant “keyword” list was used by TDC, in order to retrieve a set of matching “real news” Twitter posts from legitimate news sites.
The customized crawler harvested Twitter feeds maintained by more “traditional,” mainstream news sources, such as the Globe and Mail, CBC News, CTV News, the BBC, the New York Times, the Daily Telegraph, the Wall Street Journal, Asahi Shim-Bun, Times of India, the Washington Post, the Guardian, and Daily Mail Online, collecting tweets posted between the beginning of January 2015 and the end of August 2018 (within the approximate time frame of the IRA tweets). Tweets from the “real news” dataset that were posted after August 2018 were removed, as the data from the IRA tweets did not extend beyond that time frame. We started with 90,605 tweets, but with the removal of 10,602 tweets that had been posted in late 2018 and early 2019, we were left with 80,003 individual cases or tweets that exemplified “real” or “legitimate” news sources. These sources of information were selected for their reputation, journalistic integrity, and variety in “leanings” right, or left.
A somewhat different sample was assembled for the TensorFlow (Deep Neural Networks) analysis, because for TensorFlow to operate effectively, a larger dataset is desirable. To achieve this, we combined the 2,116,904 English-speaking “fake news” tweets that remained (following the removal of all non-English cases) with the 90,605 “real news” tweets that were downloaded by TDC (prior to removal of tweets that extended beyond the time frame of the IRA activities). This dataset was supplemented with 2500 posted by the IRA on Facebook pages named variously as Blacktivist, Secured Borders, Being Patriotic, LGBT United and United Muslims of America. This sample of Facebook posts was collected and made available at data.world and Tableau by Jonathon Albright of Columbia University’s Tow Center for Digital Journalism. Dr. Albright has himself conducted research into IRA disinformation activities on social media and realized the importance of capturing and preserving the evidence and sharing it with other researchers [76, 77]. Thus, a large dataset of tweets and Facebook posts was analysed in TensorFlow following the merging of these multiple datasets.
The first of two “real news” comparator datasets intended for analysis of the IRA data was derived from 87,157 political news articles from October 2015, posted at webhose.io. These “real news” articles came from a wide variety of Web-based news posts, from sources including the WorldNews (WN) Network, Independent Television, Philadelphia Daily News, the Buffalo News, The Wall Street Journal, The Washington Times, The Boston Herald, The Chicago Sun Times, The New York Times, Fox News, the BBC, etc. To ensure that our results would not be predicated on only one comparator dataset, we next obtained a second “real news” dataset, this time of actual Facebook posts made available at github.com. The data that we retrieved from github.com was originally comprised of 164 sets of publicly accessible Facebook status posts. From these status posts, we manually selected Facebook IDs that appeared to be associated with traditional news sources, such as USA Today, the New York Times and CNBC.
Following our initial round of data collection, described under Task 1 (above), we broadened and enriched our selection of data sources under Task 2 (above), focussing primarily on Facebook, Twitter, and other web-based news sources. A “fake news” list of Facebook pages was generated by searching for Facebook pages that belonged to websites described by MediaBiasFactCheck.com as coming from “questionable sources,” from which we derived a list containing 530 questionable sources (websites) referred to as “fake news.” Of those, 185 were found to have a Facebook page. These pages were located by searching for the website’s name and/or link. Only pages meeting specific selection criteria were harvested, yielding 96,219 Facebook “fake news” items, recently supplemented by a set of 3,736 Canadian Facebook “fake news” items.
Twitter fake news specifically assembled by the research team for this project were extracted the same way as the set of “fake” Facebook posts, i.e. using the list of 530 “questionable sources” published by MediaBiasFactCheck.com. From this, 181 Twitter accounts were identified for data collection, accounting for 43,193 data items. Only Twitter accounts that contained a link to the websites identified by MediaBiasFactCheck.com as suspect and that met our selection criteria were included in this sample.
Our third category of “fake news” was derived from Web sites presenting themselves as legitimate sources of real news but considered “fake.” News articles were collected from four publicly available datasets: (1) ISOT Fake News, (2) Getting Real About Fake News, (3) Fake News Corpus and (4) FA-KES: A Fake News Dataset around the Syrian War. Finally, the FA-KES dataset, created at the American University of Beirut with the intention of helping train machine learning models, contained 805 news articles about the conflict in Syria, of which 46 are labelled as “fake,” while the remaining 378 as “real.”
Comparator “real news” Facebook and Twitter data sets have been collected from official news sources representing the top 24 Canadian newspapers in accordance with their known circulation in 2016. We also included Huffington Post Canada and two TV News sources with large online followings—CBC News and CTV News. Apart from the CBC, CTV and the Canadian edition of the Huffington Post, we obtained data from 24 sources, including the Globe and Mail, The National Post, The Toronto Star, Le Journal de Montreal (French), Le Journal de Quebec (French), The Vancouver Sun, The Toronto Sun, The Hamilton Spectator, The Calgary Herald, The Winnipeg Free Press, The Edmonton Journal, The Ottawa Citizen, The Chronicle Herald, The Montreal Gazette, etc. In total, we collected 31,557 “real news” Facebook data items from these “trustworthy” news sources. We also collected 253,936 “real news” Twitter data items from these “trustworthy” news sources.
We also collected a sample of 3,500 tweets from hashtags such as #TrudeauMustGo, #TrudeauMustGoToJail, and #TrudeauMustResign all of which were suspected to contain “fake news” intended to influence the outcome of the recent Canadian federal election in October 2019. We are now in the process of collecting data from the online news site USAReally, as it is suspected of being set up by the Russian IRA for the purpose of interfering in the upcoming 2020 US Presidential Election. We are also investigating the possibility of retrieving 6691 data items that exemplify pro-Kremlin news stories identified by the European Union as designed to interfere in the recent 2019 EU Parliamentary Election. While the EU disinformation cases do not involve social media campaigns per se, they nevertheless are expected to provide us with current examples of Russian-orchestrated disinformation activities in a broader geopolitical setting. In addition, we are currently focussing our efforts on collecting Canadian-specific “fake news” Facebook items, from The Buffalo Chronicle-Canadian edition, Canadian Truth Seekers, Million Canadian March, The Canadian Defence League, The Silent Majority Canada, The Angry Cousin, Proud Canadians and Canada Proud. The latter dataset presently consists of 3,737 discrete data items.
At this point, we have assembled a database consisting of 6,562,080 “real news” and “fake news” items. This is a current value, and good only at the moment of writing, as our data collection is extensive and ongoing.
3.10 Labelling of data
A team of five qualitative researchers (along with the team leader) met several times, to discuss the manual classification process, review the tentative findings, and resolve differences in classification methods and findings. If there were disagreements with respect to the assessment, then the team would listen to the various arguments advanced by those who disagreed and come up with a solution that was mutually acceptable to all of the team members. To illustrate, some of the team members were unable to arrive at a final classification for messages that were in the French language, as they lacked fluency in French. They were not initially provided with the source of the French language messages, nor with the source of any of the messages, for that matter, so they did not realize that all of those messages had been harvested from recognized, reputable French language media. Once the language that the messages contained had been explained to them, and they became aware of the sources from which those messages had been drawn, this classification issue was overcome.
A research decision was made to have this team of qualitative researchers manually classify the previously unseen set of 1000 Facebook posts and another previously unseen set of 1000 Twitter messages. These two datasets consisted of the above-mentioned “real news” and “fake news,” randomly sampled from the massive “real” and “fake” datasets that had already been input to LibLinear, LibShortText, Random Forest and TensorFlow for training and classification purposes. The classifications already assigned to these 1000 Facebook posts and 1000 Twitter messages 1000 were known to the research team working with LibLinear, LibShortText, Random Forest and TensorFlow, but not known to the qualitative researchers.
Each of the messages in these new datasets consisting of 1000 “real” and “fake” Facebook posts and 1000 “real” and “fake” Twitter messages were read and re-read several times, often by several researchers. Anything that they contained that appeared to have the slightest possible relationship to “real news” was subjected to a Google search, to determine authenticity or lack thereof. All viewable attachments or related stories were also taken into consideration. In the final analysis, where classification discrepancies still existed, the known sources of the messages were then examined by the team leader and a senior researcher, to maximize classification precision. We classified 599 of the Facebook posts as “real,” and 401 as “fake,” and classified 543 of the Twitter messages “real,” and 457 as “fake.”
3.11 Ethical considerations in data collection
Informed consent is a central ethical principle in research scenarios that pose potential risk, harm, discomfort or embarrassment to the research subjects [78, 79]. The type of Internet research undertaken in this study of dis/misinformation on social media could abrogate the right of the research subjects to know about the nature and duration of the research project, the potential risks and benefits, and what measures were being taken to ensure confidentiality [80, 81]. In the final analysis, this study of real information and dis/misinformation on social media used readily accessible archival materials posted in a public arena, it involved no interaction with the research subjects, and posed no greater risk than what might normally be encountered by the research subjects in their daily lives [82, 83]. Moreover, it addresses a serious social problem, given that the type of dis/misinformation promulgated by hostile foreign actors a real threat to normal democratic processes.
4 Research findings
4.1 Research findings TensorFlow, LibShortText, LibLinear and random forest
Overall, we found that LibShortText and LibLinear were outperforming TensorFlow (Deep Neural Networks, using 5 hidden layer with 100 nodes) and Posit. To illustrate, when analysing 1000 randomly selected data items taken from our own “real news” dataset and from the “real news” portions of the ISOT and FA-KES datasets, contrasted with 1000 randomly selected data items taken from our own “fake news” dataset and from the “fake news” portions of the Kaggle, ISOT and FA-KES datasets, we found that LibShortText and LibLinear exhibited classification accuracies of 93 and 92%, respectively, as opposed to Posit and WEKA at 72.7%, TensorFlow (using Posit-generated.arff content at 54.5%, TensorFlow (using content only) at 52.5%, and TensorFlow (using tagged text) at 48%. We would consider these TensorFlow numbers to be no better than tossing a coin, but these results were not entirely unexpected, as TensorFlow thrives on large data, and this experiment was conducted using only 2,000 discrete data items.
The qualitative research team had a high degree of confidence in this manual classification, regarding it as the “gold standard,” against which the machine classification could then be cross-validated, in what could essentially be regarded as a “double-blind” process. The qualitative classifications were given to the other (machine-reading) research teams, who in turn gave the qualitative researchers the classifications obtained by Posit, and by LibLinear, LibShortText, Random Forest and TensorFlow for these same two datasets. The qualitative research team then analysed similarities and dissimilarities across the research findings.
There was a reasonably high degree of concordance between the classifications assigned by the different research teams to the new datasets consisting of 1000 “real” and “fake” Facebook posts and 1000 “real” and “fake” Twitter messages. For example, with the 1000 “real” and “fake” Facebook posts, the classifications assigned by the LibLinear, LibShortText, Random Forest and TensorFlow combination were in agreement with the manually assigned classifications 80.5% of the time (see Table 1). In instances where there were classification differences, they occurred almost exclusively with the classification of “real news” items (i.e. 196 of the “real news” messages, or 19.6% of the Facebook dataset). Moreover, in cases where there were disagreements between the LibLinear, LibShortText, Random Forest and TensorFlow combination and the manually assigned classifications, LibLinear on its own agreed with (supported) the manual classification 88 times, suggesting that LibLinear should be given a greater weight in any future machine-reading classification process. Indeed, the relationship between the manual classification and the classification provided by LibLinear was particularly strong and robust (X2 = 608.374, df = 1, p = 0.001).
Much the same can be said with respect to the 1000 “real” and “fake” Twitter messages, albeit with not quite the same degree of confidence. The classifications assigned by the LibLinear, LibShortText, Random Forest and TensorFlow combination were in agreement with the manually assigned classifications only 59.6% of the time (see Table 2). Unlike the case with the Facebook dataset, however, in instances where there were classification differences with Twitter, they occurred almost exclusively with the classification of “fake news” items (i.e. 401 of the “fake news” messages, or 40.1% of the Twitter dataset). Again, in cases where there were disagreements between the LibLinear, LibShortText, Random Forest and TensorFlow combination and the manually assigned classifications, LibLinear on its own agreed with (supported) the manual classification 331 times, adding further evidence that LibLinear should be given a greater weight in any future machine-reading classification process. As was the case with the Facebook dataset, the relationship between the manual classification and the classification provided by LibLinear was strong and robust (X2 = 238.077, df = 1, p = 0.001), albeit not as strong and robust as it was for classification of the 1000 Facebook data items.
4.2 Posit findings—overview
The set of 1000 Facebook posts and 1000 Twitter messages described above were forwarded to the research team at Strathclyde University in Scotland for classification and cross-validation purposes. As was the case with the samples initially provided to the qualitative research team, these datasets did not include classification scores from the LibLinear, LibShortText, Random Forest, TensorFlow team, nor did they include the classification scores that had subsequently been assigned by the qualitative research team. Rather, the classification scores that had subsequently been assigned by the qualitative research team were only provided after the provisional classification was conducted in Posit. As importantly, the two new datasets that were forwarded to Strathclyde for Posit analysis did not include information about the sources from which the “real” and “fake” news were drawn, thereby precluding anyone at the Strathclyde end from identifying them as “real” or “fake, solely on the basis of source. Essentially, this could be regarded as another “double-blind” process. The following is a detailed account of the findings of the research team at Strathclyde.
-
(1)
Complexion Analysis of 1000 Twitter messages and 1000 Facebook messages
The purpose of complexion analysis is to reveal any gross discrepancies in characteristics between the data items that have been classified. For instance, there is always a possibility that a single distinctive feature may unduly influence the automated classification process. Once the classification has been undertaken, we are able to undertake the subsequent inspection of key characteristics of each class, in order to gain a view on the likelihood of such influential factors as number of words, number of characters, number of special characters, as well as maximum, minimum and average values for each of these features.
Following the manual classification, all data samples were contrasted to determine their complexion in terms of total words, total characters and total special characters. The special characters are a subset of the non-alphanumeric characters, which are expected to appear routinely in social media posts. This small subset comprises exclamation marks, dollar signs, question marks, asterisks and periods.
The following details the results of complexion analysis on the Twitter and Facebook data subsets that were classified manually by the qualitative research team on the basis of extensive, in-depth analyses of the 1000 randomly selected tweets and 1000 randomly selected Facebook posts (Figs. 5 and 6).
Fig. 5 
Example of posit summary output
Fig. 6 
Example of posit aggregate output (prepared for WEKA input)
-
(2)
Twitter and Facebook Comparison
Data items drawn from different social media platforms (SMPs, Facebook, for example) may be expected to display distinctive characteristics that reflect their particular SMP origin. Indeed, comparing lexical features across social networks through quantitative methods is not likely to afford useful insights toward the classification of individual items, since their social network provenance is usually a given. Nevertheless, in the present context, we are exploring aspects that may influence the decision on “real” or “fake” classification. Before presenting complexion details of the separate Twitter and Facebook data samples, we can note the evident similarities and dissimilarities between these two datasets.
The number of words exhibited by the differently sourced samples, reflecting how this is distributed across each set of 1000 items, is illustrated in Fig. 7. This exhibits a very similar distribution curve.
Fig. 7 
Word count distribution for twitter and facebook datasets
The corresponding distribution of character counts is shown in Fig. 8. This exposes a difference in scale, with Twitter items generally greater in character count than Facebook, but, once again, the distribution curves reveal a similar shape.
Fig. 8 
Character count distribution for twitter and facebook datasets
Finally, we may contrast the relative use of special characters in each of the Twitter and Facebook datasets. This is illustrated in Fig. 9. As with the word and character counts, the distribution curves for special characters between the Twitter and Facebook datasets show similar shapes. Like the contrast between their character counts, Twitter items exhibit a curve that is consistently above the values for the Facebook items.
Fig. 9 
Special character count distribution for twitter and facebook datasets
-
(3)
Twitter
This Twitter dataset comprised 1000 samples that were manually classified by the qualitative research team as either “real” or “fake”. The breakdown for these two classes, as classified by the qualitative researchers, was 543 “real” and 457 “fake” data items. Considering the number of words that were present in the data items from these two classes, we determined that there was little difference in the average number of words of each class of tweet, with “real” averaging 23 words and “fake” averaging 22 words. The minimum number of words were also close, with “real” tweets recording 6 words and “fake” tweets recording 4 words. A greater difference was apparent in terms of the maximum number of words, with “real” tweets reaching 67 words and “fake” tweets only 31 (Table 3). Despite the apparent scale of this difference, the distribution of tweets when focusing on number of words for each of the two classes is fairly similar. Figure 10 illustrates this distribution.
Table 3 Word and Character Statistics for Twitter and Facebook Posts Fig. 10 
Distribution of word count by twitter class
While such contrasts in data complexion are not used in our present classification, they demonstrate the insights that can be afforded by this step in our methodology. This is all the more evident as we turn our attention to the individual datasets.
The Twitter samples displayed similar scale in the average number of characters, with “real” Tweets on 170 characters and “fake” Tweets on 172 characters. Minimum number of characters in Tweets were 40 and 26, respectively. As with the comparison of maximum number of words, the contrast in maximum number of characters appears marked, with “real” Tweets reaching 525 and “fake” Tweets at 279. Although the maximum number of characters for Tweets permitted on Twitter is 280 characters, this is exceeded if URLs are included. The full length of such URLs would be retained as text in our data samples. These contrasts are shown in Table 3, with the corresponding distributions illustrated in Fig. 10.
The final contrast between the “real” and “fake” Tweet classes took into consideration the presence of our special character set. In this case, the average special character count was similar between the two classes of Tweets, with “real” reaching 27 and “fake” at 26. The minimum and maximum number of occurrences were also very close for each Twitter class, with “real” minimum at 16 and “fake” minimum at 15, “real” maximum at 38 and “fake” maximum at 37 (Table 3). The distribution of special character count across the two classes of Tweet is shown in Fig. 10.
While these particular “real” and “fake” Twitter classes display similar graph shapes in distribution across our three features (word count, character count and special character count), for each of these features there is an evident extension in range for the “real” Tweets. This may indicate that the process of manual classification was based upon sizes in word count, character count and special character count, with Tweets at the higher reaches of these values being more readily characterised as “real”. Correspondingly, the manual classification of “fake” Tweets may be ‘easier’ for shorter Tweets (Fig. 11).
Fig. 11 
Distribution of special character counts by twitter class
-
(4)
Facebook
This Facebook data set comprised 1000 samples that were manually classified as “real” or “fake”. The breakdown against these classes was 599 “real” and 401 “fake”.
Considering the number of words present in data items of these two classes, we determined that there was some difference in the average number of words of each class of Facebook post, with “real” averaging 22 words and “fake” averaging 14 words. The minimum number of words were identical at 1 (Table 3). A greater difference was apparent in terms of their maximum word length, with “real” posts reaching 88 words and “fake” posts only 70. Figure 12 shows the distribution in the number of words across posts in the two classes. From this, we see that the difference in average number of words reflects the greater number of longer posts in the “real” class against the “fake” class.
Fig. 12 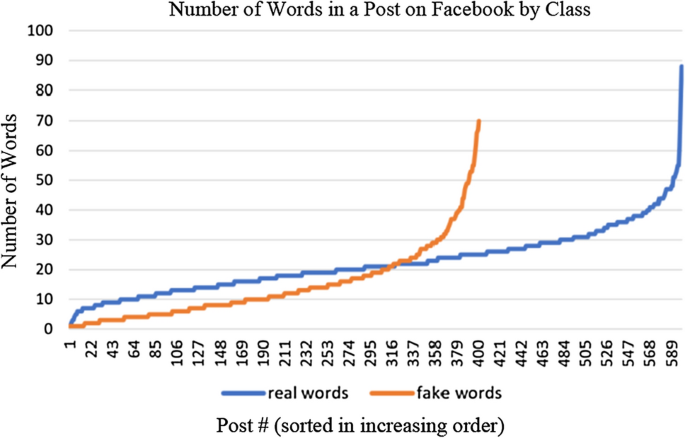
Distribution of word counts by class of facebook post
The Facebook posts displayed some difference in average character lengths, with “real” Facebook posts having, on average, 142 characters and “fake” Tweets having 94 characters. The minimum number of characters in posts was 6 and 4, respectively, while the difference in maximum number of characters appears marked, with “real” posts reaching 636 and “fake” posts 159. Since a greater number of words is likely to translate into a greater number of characters, we should expect the graphs of each distribution (words vs. characters) to reflect a similar shape. The character count contrasts are shown in Table 3, with the corresponding distributions illustrated in Fig. 13.
Fig. 13 
Distribution of character counts by facebook class
The final contrast between the “real” and “fake” Facebook post classes considered the presence of our special character set (Table 3). In this case, the average number of occurrences for special characters was similar between the two classes of posts, with “real” reaching 21 and “fake” at 20. The minimum and maximum number of occurrences were also very close for each Facebook class, with both showing a “real” minimum of 2 special character occurrences. Their values for maximum occurrence of special characters were 31 for “real” and 34 for “fake” (Table 3). The distribution of number of special characters across the two classes of Tweet is shown in Fig. 14.
Fig. 14 
Distribution of special character counts by facebook class
These particular “real” and “fake” Facebook classes display notable differences in graph shapes for distribution across our three features (word count, character count and special character count). As with our Twitter samples, these complexion analyses shed light on the decisions taken in manual classification and give further indication that decisions on the “real” items correlate closely with the scale of the data items. This may suggest that “real” items are more easily identified if they are lengthy. This is plausible on the assumption that the human decision maker simply had more evidence upon which to make a judgment.


4.3 Posit findings
-
(1)
Introduction
Following qualitative analysis on two data subsets of social network posts from Facebook and Twitter, we undertook a further series of six classification experiments on the qualitatively analysed samples. As noted, these comprised 1000 data samples from each of Facebook and Twitter and, following their qualitative analysis, these were manually classified as “real” or “fake” news. The output from this stage was a split of approximately half “real” and “half” fake posts (Table 4).
Table 4 Manually classified Facebook and Twitter posts Armed with these classified datasets, we sought to determine how accurately we might match this with automated classification based upon Posit and charcount analyses. To this end, we conducted six experiments on these “labelled,” i.e. pre-classified, sets of data. The following analyses were performed for each of the Facebook and Twitter datasets: Posit features only; charcount features only; Posit and charcount features combined, to produce the experimental set noted in Table 5, below.
Table 5 Posit and charcount experiment set -
(2)
Applying Posit and charcount to posts from the Facebook dataset
-
(a)
Experiment 1–Posit
This experiment applied a Posit analysis to the Facebook manually classified dataset in order to generate the ‘standard’ Posit output of 27 word-based features for each of the 1000 Facebook data items. This feature information was then re-formatted for direct use with the WEKA knowledge acquisition software tool. In turn, WEKA was configured to apply the Random Forest classification algorithm and determine the degree of match with the manual classification. Table 6 details the performance results for this experiment.
Table 6 Classification Performance The performance by class for this result is given as a confusion matrix in Table 6, which shows that a total of 164 posts were classified as “real” when in fact they were “fake”, and 71 were classified as “fake” when in fact they were “real”.
-
(b)
Experiment 2–Charcount
This experiment applied a charcount analysis to the Facebook manually classified dataset to generate the output of 44 character-based features for each of the 1000 Facebook data items. This feature information was ready for direct use with the WEKA knowledge acquisition software tool. In turn, WEKA was configured to apply the Random Forest classification algorithm and determine the degree of match with the manual classification. Table 6 details the performance results for this experiment. The performance by class for this result is given as a confusion matrix in Table 6.
-
(c)
Experiment 3–Posit and charcount
This experiment applied a combined Posit analysis with a charcount analysis to the Facebook manually classified dataset to generate the combined output of 71 word and character-based features for each of the 1000 Facebook data items. This feature information was then re-formatted for direct use with the WEKA knowledge acquisition software tool. In turn, WEKA was configured to apply the Random Forest classification algorithm and determine the degree of match with the manual classification. Table 6 details the performance results for this experiment. The performance by class for this result is given as a confusion matrix in Table 6.
-
(a)
-
(3)
Applying Posit and charcount to Twitter dataset
-
(a)
Experiment 1–Posit
This experiment applied a Posit analysis to the Twitter manually classified dataset to generate the ‘standard’ Posit output of 27 word-based features for each of the 1000 Twitter data items. This feature information was then re-formatted for direct use with the WEKA knowledge acquisition software tool. In turn, WEKA was configured to apply the Random Forest classification algorithm and determine the degree of match with the manual classification. Table 6 details the performance results for this experiment. The performance by class for this result is given as a confusion matrix in Table 6.
-
(b)
Experiment 2 – charcount
This experiment applied a charcount analysis to the Twitter manually classified dataset to generate the output of 44 character-based features for each of the 1000 Twitter data items. This feature information was ready for direct use with the WEKA knowledge acquisition software tool. In turn, WEKA was configured to apply the Random Forest classification algorithm and determine the degree of match with the manual classification. Table 6 details the performance results for this experiment. The performance by class for this result is given as a confusion matrix in Table 6.
-
(c)
Experiment 3 – Posit and charcount
This experiment applied a combined Posit analysis with a charcount analysis to the Twitter manually classified dataset to generate the combined output of 71 word and character-based features for each of the 1000 Twitter data items. This feature information was then re-formatted for direct use with the WEKA knowledge acquisition software tool. In turn, WEKA was configured to apply the Random Forest classification algorithm and determine the degree of match with the manual classification. Table 6 details the performance results for this experiment. The performance by class for this result is given as a confusion matrix in Table 6.
The results from this series of experiments allowed us to determine that the best performance in matching the manually classified data was for Twitter data using the combined Posit and charcount features, at 81.60%. Next best performance was for Twitter data with Posit features only, at 78.00%. This was followed by Facebook data with Posit features only, at 76.50% and Twitter data using charcount features only, at 74.40%. Facebook data with combined Posit and using only the charcount features both resulted at an accuracy of 73.50%.
-
(a)
5 Discussion
The degree to which the IRA’s disinformation campaign actually altered the outcome of the 2016 U.S. Presidential Election remains a subject of debate. Uhlmann and McCombie have argued that the IRA’s efforts were poorly disguised, and that the IRA’s cooperation with other branches of the Russian government that were similarly tasked with meddling in the U.S. election were poorly coordinated and likely not as effective as might be imagined [84]. Instead, the Russians may have benefitted more from embarrassing the U.S. government by demonstrating to the international community the vulnerability of the American system to this sort of attack, and by setting the various political factions within the US on the warpath in the aftermath of the election. Nor can it be said that the US is an innocent victim in the arena of election meddling —they too have engaged for decades in interference in the political affairs of other countries [82], e.g. Cuba, Vietnam, Nicaragua, Grenada, Afghanistan and Iraq, to name but a few.
As noted earlier, a 2019 inventory from the Oxford Internet Institute found evidence of disinformation campaigns in 70 different countries around the world, including Armenia, India, Malaysia, Mexico, The Philippines, Saudi Arabia, The United Arab Emirates and Venezuela [50]. Chinese disinformation has struck against Taiwan and Hong Kong, as well as against the USA and Australia [55, 56]. Iran has employed foreign interference against Canada, via disinformation on social media, particularly Twitter during the 2015 and 2019 Canadian federal elections [48, 56].
Nevertheless, Russia remains the most familiar and widely-studied actor, and its methods are the most well-known. O’Connor et al. found that between 2010 and 2020, Russia used online disinformation to interfere with “31 elections and seven referendums involving 26 states” including members of the EU, the USA, nations of Africa and South America, as well as Canada [58]. Russia, especially through the IRA, used social media disinformation to target both Canadian elections and Canadian society, promoting Stephen Harper and denigrating Justin Trudeau, while fiercely encouraging right-wing extremism, particularly via amplifying and fomenting Islamophobia and anti-immigrant hatred [47].
With democracy under threat from the intentional (and perhaps criminal) manipulation of Cloud-based social media, and the resultant digital wildfires [85], legislators, regulators and service providers are eagerly seeking solutions and defences against disinformation warfare [86]. We have described the brazen attempts by the Russian Internet Research Agency to manipulate public opinion in the US and UK, wherein the use of so-called “fake news” sought to influence democratic processes across international boundaries. Looking ahead to technological responses, we anticipate developing tools that will permit agencies to filter and identify suspicious social network content.
6 Conclusion
We have customized TDC to monitor selected social media and online news sources, we have acquired massive datasets that are representative of “fake” and “real” news, and we have demonstrated our ever-improving ability to classify “fake” and “real” news with a high degree of accuracy, using machine-learning and a number of complementary automated text-reading/classification programs. During this project, we were able to combine multiple technologies successfully, and apply them to real-world data (Facebook posts and tweets, and news articles), demonstrating our ability to discern measurable differences between “fake” and “real” news.
During the course of our research, we have observed that many social media messages (on some platforms, over 50%) are accompanied by images, memes or videos, and that the meme, image or video is the only messaging. Thus, we plan to expand the scope of the social media content that our technology can monitor and analyse, by combining natural-language processing (NLP), robust optical character recognition (OCR) and Mask R-CNN to extract textual information from images, videos and memes. This will include biometric matching based on facial images, general image matching via computer vision algorithm and basic text-based searching to identify areas of interest.
We are also defining and integrating into our technology an automated method for the detection of “bots” and “sock puppet” accounts. As noted earlier, it is estimated that social media bots comprise between 5 and 9% of the overall Twitter population and account for approximately 24% of all tweets [43]. To spread dis/misinformation successfully, sock puppet accounts seek to obtain a level of trust and accumulate a history of activity to create the impression that they are legitimate sources of information. Our new approach will determine the trust method implemented by top social media platforms such as Reddit, Facebook, Twitter and Instagram, and then select a set of features/factors and patterns of behaviour that can be collected and used to accurately assess the legitimacy of social media accounts.
We anticipate that the solutions and models we are building (to detect differences between “fake” and “real” news) could be expanded upon to create a system that can retrieve, analyse, and predict “fake” news on-the-fly, as data is coming in. This would benefit all countries through the early detection—and possible removal—of fake news content as it is appearing. Even if removal is not possible, or difficult to achieve in time to mitigate its spread and influence, awareness of these campaigns would allow worldwide and trusted media sources to react and respond with messaging that hopefully would be able to counter the disinformation.
One need look no further than the disinformation campaign surrounding Russia’s February 2022 invasion of the Ukraine to appreciate the relevance of what we are attempting to achieve [87]. In fact, the Canadian Armed Forces and the Department of National Defence recently requested and received from us an updated (detailed) analysis of Russian dis/misinformation pertaining to the Russian war against the Ukraine [88]. The Canadian Ministry of Heritage—knowing of our work on disinformation warfare—just approached us about doing research on their behalf into Russian disinformation on Canadian social media pertaining to the Russian war against the Ukraine. The significance and timeliness of this work cannot be overstated.
References
Cartwright B, Weir GRS, Frank R, Padda K (2019) Deploying artificial intelligence to combat disinformation warafre: identifying and interdicting disinformation attacks against cloud-based social media platforms. Int J Adv Secur 12(3 & 4):203–222
Ebner D, Freeze C (2018) Aggregate IQ, Canadian data firm at centre of global controversy, was hired by clients big and small,” Globe and Mail. https://www.theglobeandmail.com/canada/article-aggregateiq-canadian-data-firm-at-centre-of-global-controvery-was/ Accessed: 14 July 2021
Rathi R (2019) Effect of Cambridge Analytica’s Facebook ads on the 2016 US Presidential Election. Towards Data Science. https://towardsdatascience.com/effect-of-cambridge-analyticas-facebook-ads-on-the-2016-us-presidential-election-dacb5462155d. Accessed 20 July 2019
Russell J (2018) UK watchdog hands Facebook maximum £500K fine over Cambridge Analytica data breach. TechCrunch. https://techcrunch.com/2018/10/25/uk-watchdog-hands-facebook-500k-fine/. Accessed: 18 August 2019
McGill MH, Scola N (2019) FTC approves $5B facebook settlement that democrats label 'chump change. Politco. https://www.politico.com/story/2019/07/12/facebook-ftc-fine-5-billion-718953. Accessed 12 Jul 2019
Select Committee on Intelligence, United States Senate (2020) Russian active measures, campaigns and interference in the 2016 U.S. election, Volume 2: counterintellgince threats and vulnerabilities. https://www.intelligence.senate.gov/sites/default/files/documents/report_volume2.pdf. Accessed: 14 July 2021
Office of the Director of National Intelligence (2017) Assessing Russian activities and intentions in recent US elections. www.dni.gov/files/documents/ICA_2017_01.pdf. Accessed: 28 July 2019
Mueller RS (2019) Report on the investigation into Russian interference in the 2016 presidential election. www.justsecurity.org/wp-content/uploads/2019/04/Muelller-Report-Redacted-Vol-II-Released-04.18.2019-Word-Searchable.-Reduced-Size.pdf. Accessed: 28 July 2019
Intelligence and Security Committee of Parliament (2020) Russia Report. https://isc.independent.gov.uk/wp-content/uploads/2021/03/CCS207_CCS0221966010-001_Russia-Report-v02-Web_Accessible.pdf. Accessed: 9 December 2020
Bastos MT, Mercea D (2017) The brexit botnet and user-generated hyperpartisan news. Soc Sci Comput Rev 37(1):38–54. https://doi.org/10.1177/0894439317734157
Field and Wright (2018) Russian trolls sent thousands of pro-Leave messages on day of Brexit referendum, Twitter data reveals: Thousands of Twitter posts attempted to influence the referendum and US elections. The Telegraph. www.telegraph.co.uk/technology/2018/10/17/russian-iranian-twitter-trolls-sent-10-million-tweets-fake-news/ Accessed: 8 April 2019
Evolvi G (2018) Hate in a tweet: exploring internet-based islamophobic discourses. Religions 9(10):37–51. https://doi.org/10.3390/rel9100307
Badawy A, Ferrara E, Lerman K (2018) Analyzing the digital traces of political manipulation: the 2016 russian interference twitter campaign. In: 2018 IEEE/ACM International Conference on Advances in Social Networks Analysis and Mining (ASONAM), 2018, pp. 258-265, doi: https://doi.org/10.1109/ASONAM.2018.8508646
Shao C, Hui PM, Wang L, Jiang X, Flammini A, Menczer F, Ciampaglia GL (2018) Anatomy of an online misinformation network. PloS one. https://doi.org/10.1371/journal.pone.0196087
Kim YM (2020) New evidence shows how russia’s election interference has gotten more brazen: the kremlin-linked operation behind 2016 election meddling is using similar tactics for 2020, plus some new ones. Brennan Center for Justice. https://www.brennancenter.org/our-work/analysis-opinion/new-evidence-shows-how-russias-election-interference-has-gotten-more. Accessed: 20 March 2022
Luther C, Horen B, Zhang X (2021) Partisanship over security: Public narratives via Twitter on foreign interferences in the 2016 and 2020 U.S. presidential elections. First Monday. https://doi.org/10.5210/fm.v26i8.11682
National Intelligence Council (2021) Foreign threats to the 2020 US federal elections. https://www.dni.gov/files/ODNI/documents/assessments/ICA-declass-16MAR21.pdf. Accessed: 20 March 2022
Berghel H (2017) Lies, damn lies, and fake news. Computer 50(2):80–85
Jankowski NW (2018) Researching fake news: a selective examination of empirical studies. Javnost - The Public 25(1–2):248–255. https://doi.org/10.1080/13183222.2018.1418964
Tandoc EC Jr, Lim ZW, Ling R (2018) Defining ‘fake news’: a typology of scholarly definitions. Digital Journal 6(2):137–153. https://doi.org/10.1080/21670811.2017.1360143
Lazer DM, Baum MA, Benkler Y, Berinsky AJ, Greenhill KM, Menczer F, Schudson M (2018) The science of fake news. Science 359(6380):1094–1096. https://doi.org/10.1126/science.aao2998
de Cock Buning M, Ginsbourg L, Alexandra S (2019) Online disinformation ahead of the European parliament elections: toward societal resilience. European University Institute, School of Transnational Governance https://cadmus.eui.eu/bitstream/handle/1814/62426/STG_PB_2019_03_EN.pdf?sequence=1&isAllowed=y Accessed: 15 July 2019
Desai S, Mooney H, Oehrli JA (2018) “Fake News," lies and propaganda: how to sort fact from fiction. https://guides.lib.umich.edu/fakenews. Accessed: 15 July 2019
Kshetri N, Voas J (2017) The economics of “Fake News.” IT Prof 19(6):8–12
Kata A (2010) A postmodern pandora’s box: anti-vaccination misinformation on the Internet. Vaccine 28(7):1709–1716. https://doi.org/10.1016/j.vaccine.2009.12.022
Bester JC (2016) Measles and measles vaccination: a review. JAMA Pediatr 170(12):1209–1215. https://doi.org/10.1001/jamapediatrics.2016.1787
Bennett WL, Livingston S (2018) The disinformation order: disruptive communication and the decline of democratic institutions. Eur J Commun 33(2):122–139
Vosoughi S, Roy D, Aral S (2018) The spread of true and false news online. Science 359(6390):1146–1151. https://doi.org/10.1126/science.aap9559
Bennett WL, Livingston S (2018) The disinformation order: disruptive communication and the decline of democratic institutions. Eur J Commun 33(2):122–139
United States v. Internet Research Agency LLC, Case 1:18-cr-00032-DLF, The United States District Court for the District Of Columbia, February 26, 2018. www.justice.gov/file/1035477/download. Accessed: 8 April 2019
Green JJ (2018) Tale of a troll: Inside the ‘Internet Research Agency’ in Russia. WTOP. https://wtop.com/j-j-green-national/2018/09/tale-of-a-troll-inside-the-internet-research-agency-in-russia/ Accessed: 15 July 2019
Reston L (2017) How Russia weaponizes fake news: the kremlin's influence campaign goes far beyond Trump's victory. Their latest unsuspecting targets: American conservatives. The New Republic. https://newrepublic.com/article/142344/russia-weaponized-fake-news-sow-chaos. Accessed: 20 July 2019
Wagner K (2018). Facebook and twitter worked just as advertised for Russia’s troll army: social platforms are an effective tool for marketers—and nation states that want to disrupt an election. Recode Daily. https://www.vox.com/2018/2/17/17023292/facebook-twitter-russia-donald-trump-us-election-explained. Accessed 20 July 2019
Marwick A, Lewis R (2017) Media manipulation and disinformation online. New York: Data & Society Research Institute. https://datasociety.net/output/media-manipulation-and-disinfo-online/. Acessed: 29 July 2019
Shu K, Silva A, Wang SH, Tang J, Liu H (2017) Fake news detection on social media: a data mining perspective. ACM SIGKDD Explor Newsl 19(1):22–36. https://doi.org/10.1145/3137597.3137600Accessed:16July2021
Zanettou S, Caulfied T, de Cristofaro E, Sirivianos M, Stringhini G and Blackburn J (2019) Disinformation warfare: understanding state-sponsored trolls on twitter and their influence on the web. In: WWW '19: Companion Proceedings of The 2019 World Wide Web Conference, pp 218–226, https://doi.org/10.1145/3308560.3316495. Accessed15 July 2021
Papenfuss M (2017) 1000 Paid Russian trolls spread fake news on hillary clinton, senate intelligence heads told. Huffington Post. https://www.huffingtonpost.ca/entry/russian-trolls-fake-news_n_58dde6bae4b08194e3b8d5c4. Accessed: 29 July 2019
The Computational Propaganda Project (2016) Resource for understanding political bots. https://comprop.oii.ox.ac.uk/research/public-scholarship/resource-for-understanding-political-bots/. Accessed: 29 July 2019
Howard PN, Woolley S, Calo R (2018) Algorithms, bots, and political communication in the US 2016 election: the challenge of automated political communication for election law and administration. J Inform Tech Polit 15(2):81–93. https://doi.org/10.1080/19331681.2018.1448735
Rheault L, Musulan A (2021) Efficient detection of online communities and social bot activity during electoral campaigns. J Inform Tech Polit 18(3):324–337. https://doi.org/10.1080/19331681.2021.1879705
Krieg G (2016) It's official: clinton swamps trump in popular vote. CNN Politics Data. https://www.cnn.com/2016/12/21/politics/donald-trump-hillary-clinton-popular-vote-final-count/index.html. Accessed: 15 July 2021
Stark Luke (2018) Algorithmic psychometrics and the scalable subject. Soc Stud Sci 48(2):204–231. https://doi.org/10.1177/0306312718772094
Morstatter F, Wu L, Nazer,TH, Carley KN, Liu H (2016) A new approach to bot detection: Striking the balance between precision and recall. In: IEEE/ACM Conference on Advances in Social Networks Analysis and Mining (ASONAM), pp 533–540. https://ieeexplore-ieee-org.proxy.lib.sfu.ca/document/7752287 3 August, 2019
Shearar E, Mitchell A (2021) News use across social media platforms in 2020: facebook stands out as a regular source of news for about a third of Americans. Pew Research Center. https://www.journalism.org/2021/01/12/news-use-across-social-media-platforms-in-2020/. Accessed: 15 July 2021
Allcott H, Gentzkow M (2017) Social media and fake news in the 2016 election. J Econ Perspect 31(2):211–236. https://doi.org/10.1257/jep.31.2.211TopofForm
Chang HC, Chen E, Zhang M, Muric G, Ferrara E (2021) Social bots and social media manipulation in 2020: the year in review. arXiv preprint arXiv:2102.08436. 2021 Feb 16. Accessed: 15 July 2021
Al-Rawi A (2021) How did Russian and Iranian trolls’ disinformation toward Canadian issues diverge and converge? Digital War 2:21–34. https://doi.org/10.1057/s42984-020-00029-4
Louden R, Frank R (2021) Information Trolls vs Democracy: An examination of isinformation content delivered during the 2019 Canadian Federal Election. CrimRxiv. https://doi.org/10.21428/cb6ab371.e1ca98a9. Accessed: 15 July 2021
DiResta R, Grossman S (2021) Fronts & freinds: an investigation into two twitter networks linked to Russian actors. Cyber Policy Cnter, Stanford Interney Observatory. https://cyber.fsi.stanford.edu/io/publication/fronts-friends-investigation-two-twitter-networks-linked-russian-actors-takedown. Accessed: 15 July 2021
Bradshaw S, Howard PN (2019) The global disinformation order: 2019 global inventory of organized social media manipulation. https://comprop.oii.ox.ac.uk/wp-content/uploads/sites/93/2019/09/CyberTroop-Report19.pdf. Accessed: 16 November 2019
Linvill DL, Warren PL (2018) Troll factories: the internet research agency and state-sponsored agenda-building. Resource Centre on Media. https://www.google.com/search?q=Troll+factories%3A+The+Internet+Research+Agency+and+state-sponsored+agenda-building&oq=Troll+factories%3A+The+Internet+Research+Agency+and+state-sponsored+agenda-building&aqs=chrome..69i57j69i60l3.354j0j7&sourceid=chrome&ie=UTF-8. Accessed: 21 July 2019
Smoleňová I (2015) The pro-Russian disinformation campaign in the Czech Republic and Slovakia. Prague: Prague Security Studies Institute. http://www.pssi.cz/download/docs/253_is-pro-russian-campaign.pdf. Accessed: 21 July 2019
Mejias A, Vokuev NE (2017) Disinformation and the media: the case of Russia and Ukraine. Media, Cult Soc 39(7):1027–1042
Curtis JS (2021) Springing the ‘Tacitus Trap’: countering Chinese state-sponsored disinformation. Small Wars Insurg 32(2):229–265. https://doi.org/10.1080/09592318.2021.1870429
Heer T, Heath C, Girling K, Bugg E (2021) Misinformation in Canada: research and policy options. Evidence for Democracy. https://evidencefordemocracy.ca/en/research/reports/misinformation-canada-research-and-policy-options. Accessed: 23 July 2021.
Rocha R, Yates J (2019) Twitter trolls stoked debates about immigrants and pipelines in Canada, data show | CBC News. https://www.cbc.ca/news/canada/twitter-troll-pipeline-immigrant-russia-iran-1.5014750. Accessed: 23 July 2021.
Beskow DM, Carley KM (2020) Characterization and comparison of Russian and Chinese disinformation campaigns. In: Shu K, Wang S, Lee D, Liu H (eds) Disinformation, misinformation, and fake news in social media: emerging research challenges and opportunities. Springer, pp 63–81
O’Connor S, Hanson F, Currey E, Beattie T (2020) Cyber-enabled foreign interference in elections and referendums. Australian Strategic Policy Institue: International Cyber Policy Centre. https://www.aspi.org.au/report/cyber-enabled-foreign-interference-elections-and-referendums. Accessed: 23 July 2021
Wang WY (2018) ‘Liar, Liar Pants on Fire’: A New Benchmark Dataset for Fake News Detection. arXiv preprint arXiv:1705.00648. https://arxiv.org/abs/1705.00648. Accessed:15 July 2019
Yu HF, Ho CH, Juan YC and Lin CJ (2013) LibShortText: a library for short-text classification and analysis. Department of Computer Science, National Taiwan University. https://www.csie.ntu.edu.tw/~cjlin/papers/libshorttext.pdf. Accessed: 4 August 2019
Abadi M, Barham P, Chen J, Chen Z, Davis A, Dean J, Devin M, Ghemawat S, Irving G, Isard M, Kudlur M (2016) {TensorFlow}: A System for {Large-Scale} Machine Learning. In: 12th USENIX symposium on operating systems design and implementation (OSDI 16) pp 265–283 https://www.usenix.org/conference/osdi16/technical-sessions/presentation/abadi, Accessed: March 18, 2022
Fan RE, Chang KW, Hsieh CJ, Wang XR, Lin CJ (2008) LIBLINEAR: a library for large linear classification. J Mach Learn Res 9:1871–1874
Weir GRS (2009) Corpus profiling with the Posit tools. In: Proceedings of the 5th Corpus Linguistics Conference. http://citeseerx.ist.psu.edu/viewdoc/download?doi=10.1.1.159.9606&rep=rep1&type=pdf. Accessed:4 August 2019
Breiman L (2001) Random forests. Mach Learn 45:5–32
Falk C (2018) Detecting twitter trolls using natural language processing techniques trained on message bodies. http://www.infinite-machines.com/detecting-twitter-trolls.pdf. Accessed: 15 July 2019
Zellers R, Holtzman A, Rashkin H, Bisk Y, Farhadi A, Roesner F and Choi Y (2019) Defending against neural fake news. Adv Neural Inf Process Syst 32 (NeurIPS 2019)
Vargas L, Emami P, Traynor P (2020) On the detection of disinformation campaign activity with network analysis. In: CCSW'20: Proceedings of the 2020 ACM SIGSAC Conference on Cloud Computing Security Workshop, pp 133–146 https://doi.org/10.1145/3411495.3421363
Dubois E, McKelvey F (2019) Political bots: disrupting canada’s democracy. Can J Commun 44(2):27–33
Barojan D (2021) Building digital resilience ahead of elections and beyond. In: Jayakumar S, Ang B, Anwar ND (eds) Disinformation and fake news. Springer, Singapore, pp 61–73
Zulkarnine AT, Frank R, Monk B, Mitchell J and Davies G (2016) Surfacing collaborated networks in dark web to find illicit and criminal content. In: 2016 IEEE Conference on Intelligence and Security Informatics (ISI) September 2016, pg 109–114 https://doi.org/10.1109/ISI.2016.7745452 Accessed: 4 August 2019
Hockenmaier J, Bierner G, Baldridge J (2004) Extending the coverage of a CCG system. Res Lang Comput 2:165–208
Liaw A, Wiener M (2002) Classification and regression by randomForest. R News 2:18–22
Albright J (2017) Itemized posts and historical engagement - 6 now-closed FB pages [data visualization]. In Tableau Public. https://public.tableau.com/profile/d1gi#!/vizhome/FB4/TotalReachbyPage. Accessed: 1 August, 2021
Hall M, Frank E, Geoffrey H, Pfahringer B, Reutemann P, Witten I (2009) The Weka data mining software: an update. SIGKDD Explor 11:10–18. https://doi.org/10.1145/1656274.1656278
Pedregosa F, Varoquaux G, Gramfort A, Michel V, Thirion B, Grisel O, Duchesnay E (2011) Scikit-learn: machine learning in python. J Mach Learn Res 12:2825–2830
Thomas J (1996) Introduction: a debate about the ethics of fair practices for collecting social science data in cyberspace. Inf Soc 12(2):107–118. https://doi.org/10.1080/713856137
Comstock G (2012) Research ethics: a philosophical guide to the responsible conduct of research. Cambridge University Press, Cambridge
Mann C, Stewart F (2000) Internet communication and qualitative research: a handbook for researching online. Sage Publications, London; Thousand Oaks, Calif
Sharkey S, Jones RA, Smithson J, Hewis E, Emmens T, Ford T, Owens C (2011) Ethical practice in internet research involving vulnerable people: lessons from a self-harm discussion forum study (SharpTalk). J Med Ethics 37(12):752–758. https://doi.org/10.1136/medethics-2011-100080
Kitchin HA (2002) The Tri-Council on cyberspace: Insights, oversights, and extrapolations. In: Van den Hoonaard WC (ed) Walking the tightrope: ethical issues for qualitative researchers. University of Toronto Press, Toronto, pp 160–173
Moreno MA, Fost NC, Christakis DA (2008) Research ethics in the MySpace era. Pediatrics 121(1):157–160
Uhlmann AJ, McCombie S (2020) The russian gambit and the US intelligence community: Russia’s use of Kompromat and implausible deniability to optimize its 2016 information campaign against the US presidential election. Libr Trends 68(4):679–696. https://doi.org/10.1353/lib.2020.0017
McCombie S, Uhlmann AJ, Morrison S (2020) The US 2016 presidential election & Russia’s troll farms. Intell Nat Sec 35(1):95–114. https://doi.org/10.1080/02684527.2019.1673940
Lapowsky I (2018) Shadow politics: Meet the digital sleuth exposing fake news. Wired. https://www.wired.com/story/shadow-politics-meet-the-digital-sleuth-exposing-fake-news/. Accessed: 1 August 2021
Narayanan V, Howard PN, Kollanyi B and Elswah M (2017) Russian involvement and junk news during Brexit. URL: comprop.oii.ox.ac.uk/wp-content/uploads/sites/93/2017/12/Russia-and-Brexit-v27. pdf.
European Commission (2019) A Europe that protects: EU reports on progress in fighting disinformation ahead of European Council. https://ec.europa.eu/commission/commissioners/2014-2019/ansip/announcements/europe-protects-eu-reports-progress-fighting-disinformation-ahead-european-council_en. Accessed: 15 June 2019
Khaldarova I, Pantti M (2016) Fake news: the narrative battle over the Ukrainian conflict. J Pract 10(7):891–901. https://doi.org/10.1080/17512786.2016.1163237
Tuttle D (2019) Campaigns of disinformation: modern warfare, electoral interference, and canada’s security environment. SSRN Electron J. https://doi.org/10.2139/ssrn.3437117
Funding
The research leading to these results received funding in part by the Canadian government’s Cyber Security Cooperation Program and in part by the Department of National Defence and the Canadian Armed Forces through the Canadian government’s IDEaS program.
Author information
Authors and Affiliations
Corresponding author
Ethics declarations
Conflict of interest
The authors declare that they have no competing interests.
Additional information
Publisher's Note
Springer Nature remains neutral with regard to jurisdictional claims in published maps and institutional affiliations.
Rights and permissions
Open Access This article is licensed under a Creative Commons Attribution 4.0 International License, which permits use, sharing, adaptation, distribution and reproduction in any medium or format, as long as you give appropriate credit to the original author(s) and the source, provide a link to the Creative Commons licence, and indicate if changes were made. The images or other third party material in this article are included in the article's Creative Commons licence, unless indicated otherwise in a credit line to the material. If material is not included in the article's Creative Commons licence and your intended use is not permitted by statutory regulation or exceeds the permitted use, you will need to obtain permission directly from the copyright holder. To view a copy of this licence, visit http://creativecommons.org/licenses/by/4.0/.
About this article

Cite this article
Cartwright, B., Frank, R., Weir, G. et al. Detecting and responding to hostile disinformation activities on social media using machine learning and deep neural networks. Neural Comput & Applic 34, 15141–15163 (2022). https://doi.org/10.1007/s00521-022-07296-0
Received:
Accepted:
Published:
Issue Date:
DOI: https://doi.org/10.1007/s00521-022-07296-0