
Abstract
In the summer (July and August) of 2022, unprecedented heat wave occurred along the Yangtze River Valley (YRV) over East Asia while unprecedented flood occurred over western South Asia (WSA), which are located on the eastern and western sides of Tibetan Plateau (TP). Here, by analyzing the interannual variability based on observational and reanalysis data, we show evidences that the anomalous zonal flow over subtropical Tibetan Plateau (TP) explains a major fraction the extreme events occurred in 2022. As isentropic surfaces incline eastward (westward) with altitude on the eastern (western) side of the warm center over TP in summer, anomalous easterly (westerly) flow in upper troposphere generates anomalous descent (ascent) on the eastern side of TP and anomalous ascent (descent) on the western side of TP via isentropic gliding. The anomalous easterly flow is extremely strong to reverse the climatological westerly flow over subtropical TP in 1994, 2006, 2013 and 2022. The easterly flow in 2022 is the strongest since 1979, and it generates unprecedented descent (ascent) anomaly on the eastern (western) side of TP, leading to extreme heat wave over YRV and extreme flood over WSA in 2022. The anomalously strong easterly flow over subtropical TP in 2022 is dominated by atmospheric internal variability related to mid-latitude wave train, while the cold sea surface temperature anomaly over the tropical Indian Ocean increases the probability of a reversed zonal flow over TP by reducing the meridional gradient of tropospheric temperature.
1 Introduction
In the summer of 2022, different types of extreme climate events occurred in East Asia and western South Asia. Long-lasting heat wave occurred in East Asia throughout July and August (JA), with the JA-mean daily-maximum temperature anomaly above 3 K along the Yangtze River Valley (YRV) and its vicinity relative to the past 44-year climatology, and the temperature was extremely high in Sichuan Basin, Chongqing and the Yangtze River Delta where the JA-mean daily-maximum temperature anomaly is higher than 4 K (Fig. 1a). Even with the linear warming trend removed, the temperature still ranks the highest over many areas along the YRV (stippling in Fig. 1b), suggesting the dominant role of interannual climate variability. Meanwhile, unprecedented flood swept western South Asia (WSA), with a two-month averaged precipitation anomaly exceeding 400 mm above the climatology in southern Pakistan (Fig. 1c). Positive precipitation anomaly not only covers WSA but also extends to Iran Plateau and the Arabian Peninsula in West Asia (Fig. 1c,d). Although the absolute rainfall anomaly (in the unit of mm) over the desert region in West Asia does not exceed 100 mm (Fig. 1c), the percentage rainfall anomaly is extremely high, reaching 400–800% of the local climatology (Fig. 1d). Understanding the mechanism for the extreme events is of urgent need due to their large social impacts.

Anomalous temperature and precipitation in the summer (July–August) of 2022. a Raw Tmax anomaly relative to the 1979–2022 climatology (unit: K). b Same as (a) but the linear warming trend is removed. c Precipitation anomaly (unit: mm). d Percentage precipitation anomaly (unit: %, non-linear contour interval adopted). The stippling indicates that the anomaly is the highest or the lowest in 2022 among the 44 years since 1979. The location of TP with a surface pressure less than 700 hPa is marked by thin black curve. The black box indicates the YRV region (27°–33°N, 100°–120°E) and the orange box indicates the WSA region (25°–35°N, 60°–75°E) adopted for regional averaging
The Asian climatology is characterized by moist climate over East Asia and arid hot climate over West Asia. The WSA (Pakistan and its vicinity) is a transition region between the South Asian monsoon climate and desert climate. Persistent and abundant precipitation occurs along YRV to south Korea and Japan in early summer from June to mid July, which is called Meiyu in China, Changma in Korea and Baiu in Japan (Zhou et al. 2009a; Ha et al. 2012; Ding et al. 2020). In contrast, arid hot climate controls West Asia and WSA, where surface air temperature exceeding 50 °C is often observed (Rashid et al. 2020; Zerafati et al. 2021; Karzani et al. 2022) and sand storms often occur (Middleton 1986; Littmann 1991; Cao et al. 2015). It is interesting that the pattern of anomalous Asian climate in the summer of 2022 is "opposite" to the climatology. The climatologically wet YRV in East Asia was extremely hot and dry, while WSA and West Asia appeared anomalously cool and wet in 2022 (Fig. 1). Another interesting feature is that the regions with the greatest precipitation and temperature anomalies in 2022 are located at about 30°N on the eastern and the western sides of the Tibetan Plateau (TP), respectively (Fig. 1). It is unclear whether these two concurrent extreme events are dynamically connected.
Atmospheric circulation anomalies directly modulate the variability of seasonal mean temperature and precipitation. In general, heat wave in summer is associated with local descent anomaly which suppresses the formation of cloud and precipitation but increases the shortwave radiation arrived at the land surface (e.g., Hsu et al. 2017; Wang et al. 2017; Chen and Zhou 2018; Chen et al. 2019; Gao et al. 2021). The variability of precipitation is also directly controlled by local vertical velocity anomaly, and anomalous ascent (descent) leads to excessive (deficient) precipitation (e.g., Huang et al. 2015; Ni and Hsu 2018; He and Li 2019). Anomalous cyclone (anticyclone) system in the boundary layer may induce ascent (descent) through Ekman pumping (e.g., Wu et al. 2009, 2010; Xie et al. 2009; Hamouda and Kucharski 2019), but the relation between horizontal flow and vertical motion is not so straightforward in the free troposphere due to the absence of friction. For example, strong ascending motion prevails in the eastern part of the South Asian high pressure system in the upper troposphere over TP (Ye and Wu 1998; Wu et al. 2015; Yu et al. 2017) and also over the western flank of the western Pacific subtropical high (Sun and Ying 1999; Liu and Wu 2004; Zhou et al. 2009b). Until now, it is not clear how the extreme Asian summer climate in 2022 is connected to anomalous atmospheric circulation and how the anomalous vertical motion is generated.
Both lower-boundary forcing and atmospheric internal dynamics regulate the interannual variability of the atmospheric circulation (e.g., Deser et al. 2017; Chen and Zhou 2018; Wang et al. 2020). Sea surface temperature (SST) anomalies, particularly the SST anomalies over tropical Indian Ocean (TIO), was claimed to play an essential role in the interannual variability of the Asian climate in summer (Yang and Liu 2008; Wu et al. 2009, 2010; Xie et al. 2009, 2016). Anomalously warm SST over TIO in summer may lead to excessive precipitation along the YRV by stimulating anomalous atmospheric circulation, which accounts for the great flood occurred along the YRV in 2020 (Takaya et al. 2020; Pan et al. 2021; Zhou et al. 2021). It is reasonable to speculate that a cold SST anomaly over TIO may result in dry and hot summers over the YRV such as in 2022. However, SST anomalies cannot determine the atmospheric circulation anomalies in a specific year, and the stochastic atmospheric internal variability also plays an important role (He et al. 2016; Chen and Zhou 2018; Wang et al. 2020; Liu et al. 2022). Up to now, it is unclear how the extreme Asian summer climate in 2022 is connected with the SST anomalies and atmospheric internal variability.
Based on observational (including reanalysis) dataset, this study investigates the mechanism connecting atmospheric circulation anomalies with the interannual variability of temperature/precipitation over YRV and WSA, and we aim to address the following questions: (1) What is the key atmospheric circulation anomaly responsible for the extreme climate over subtropical Asia in 2022, as seen from their interannual relationship? (2) What is the underlying mechanism connecting the anomalous atmospheric circulation with subtropical Asian climate, and why is the atmospheric circulation so extreme in the summer of 2022?
2 Data and Method
This study adopts the following datasets. (1) Gridded daily-maximum temperature (Tmax) at 0.5° resolution for global land areas released by Climate Prediction Center (CPC) in National Oceanic and Atmospheric Administration (see Data Availability Statements). (2) The version 2.3 of monthly rate of precipitation released by Global Precipitation Climatology Project (GPCP), which has a resolution of 2.5° (Adler et al. 2003). (3) The ERA5 monthly reanalysis dataset on atmospheric circulation and temperature at pressure levels, which has a resolution of 0.25° (Hersbach et al. 2020). (4) The Extended Reconstructed SST version 5 (Huang et al. 2017) on global oceans with a resolution of 2°. For all these datasets, the 44 summers from 1979 to 2022 are adopted for analysis.
Following Chen and Zhou (2018), we focus on the two-month season of July and August (JA) for each year. Different from the widely used three-month period from June to August, "summer" in this work refers to JA, since extreme heat waves along YRV usually occurs in JA while June is the main Meiyu season. The JA-mean Tmax for each summer is calculated as the 62-day averaged value from 1st July to 31st August, and the JA-mean precipitation rate, atmospheric circulation and SST for each summer are calculated as the arithmetic average of the monthly mean values for July and August. The JA-accumulated precipitation (unit: mm) is obtained by multiplying the JA-mean precipitation rate (unit: mm/day) by a factor of 62 days. The 44-year average from 1979 to 2022 is defined as the climatology, and the raw anomaly for each year is obtained by subtracting the 44-year climatology. The de-trended anomaly is obtained by simply removing the linear trend for the time series of the raw anomaly over the 44 years, and the word "anomaly" refers to de-trended anomaly throughout the paper unless particularly stated. Based on the de-trended anomalies, linear regression and correlation analyses are performed to investigate the interannual variability, and the statistic significance is determined based on the Student's t test.
Regional averaged Tmax for YRV and regional averaged precipitation for WSA are calculated, respectively, based on the box regions marked in Fig. 1. The YRV region is selected as the 100°–120°E, 27°–33°N box (black box in Fig. 1), which is a densely populated region where extreme heat wave occurred in 2022. The WSA area is selected as the 60°–75°E, 25°–35°N box covering Pakistan and its vicinity (orange box in Fig. 1), which is the continental region with the strongest positive precipitation anomaly as seen in Fig. 1c. The WSA box does not include the desert region in West Asia to the west of 60°E, because the interannual precipitation variability over the arid region deviates strongly from normal distribution and regression/correlation analysis is not applicable. The results for the desert areas over West Asia are only shown in the spatial pattern plots.
3 Results
3.1 Anomalous Asian summer climate in 2022
Figure 1a, b shows the anomalous Tmax for JA in 2022, in terms of raw anomaly and de-trended anomaly. The Tmax for JA in 2022 shows positive anomaly over eastern TP and along the YRV, with a maximum anomaly exceeding 4 K in the Sichuan basin (about 105°–110°E around 30°N). The Tmax in the summer of 2022 is the highest since 1979 at most of the grid points near 30°N within 85°–120°E (shown as stippling in Fig. 1a). Meanwhile, negative Tmax anomaly is seen over WSA in the summer of 2022, and the raw Tmax anomaly exceeds − 4 K and it is the lowest since 1979 in some areas of Pakistan (stippling in the orange box in Fig. 1a). After removing the linear warming trend, negative Tmax anomaly covers almost all areas from WSA to the Arabian Peninsula, while the de-trended Tmax anomaly over East Asia is still the highest since 1979 at many grid points along the YRV and over eastern TP (Fig. 1b).
Figure 1c,d shows the anomalous precipitation for JA in 2022, in terms of accumulated precipitation amount and percentage anomaly. One prominent feature is the positive precipitation anomaly over WSA, which exceeds 400 mm in southern Pakistan (Fig. 1c). Over West Asia, the JA-accumulated rainfall anomaly is less than 100 mm (Fig. 1c), but it reaches 400 ~ 800% of the local climatology over the Iran Plateau and Arabian Peninsula and even exceeds 800% at some regions (Fig. 1d). The apparent difference between Fig. 1c and Fig. 1d results from the rainfall climatology. Indeed, West Asia is dominated by desert climate with very scarce climatological rainfall, while the climatological rainfall is relatively abundant over WSA in summer since it is a transition region between the monsoon climate in South Asia and the desert climate in West Asia. The positive precipitation anomaly over WSA and West Asia is physically consistent with the local negative Tmax anomaly (Fig. 1b, d), since excessive rainfall acts to decrease local surface air temperature (Trenberth and Shea 2005; Hu et al. 2019). Over East Asia, negative precipitation anomaly extends from the southeastern TP to YRV, while positive anomaly appears over northern China (Fig. 1c,d), which are also physically consistent with the Tmax anomaly (Fig. 1b).
Figure 2 shows the time series for the regional averaged quantities. The raw Tmax anomaly over YRV in the summer of 2022 is 3.4 K (hollow black bar in Fig. 2a), which is the highest since 1979. It shows a linear warming trend of 0.47 K per decade (red line in Fig. 2a), which is statistically significant at the 95% confidence level. The linear trend has caused a Tmax anomaly of 1.1 K in 2022 relative to the 1979–2022 climatology. The de-trended Tmax anomaly over YRV is 2.3 K in 2022, which is still the highest since 1979 (solid blue bar in Fig. 2a). The de-trended Tmax anomaly in 2022 is higher than the extreme heat wave events in 1994, 2006 and 2013 which were widely studied (e.g., Guan and Yamagata 2003; Ding et al. 2010; Sun et al. 2014; Wang et al. 2016; Chen et al. 2018). Supposing the warming trend is linear, the warming trend explains about 1/3 (1.1 K) of the raw Tmax anomaly over YRV in 2022, and the interannual temperature variability explains the other 2/3 (2.3 K).

Time series for the regional averaged values over YRV and WSA from 1979 to 2022. a Regional averaged raw Tmax anomaly (hollow black bar) over YRV, its trend (red line) and the de-trended anomaly (solid blue bar). b Same as a but for the regional averaged precipitation anomaly over WSA. c Regional averaged vertical velocity in the upper troposphere (200-500 hPa average, unit: 10−2 Pa/s) over YRV (hollow black bar) and WSA (solid blue bar) regions
It is evident that the summer of 2022 in WSA is the wettest since 1979, followed by the summer of 1994 (Fig. 2b). The regional averaged precipitation over WSA shows a weak increasing trend (red line in Fig. 2b), but this trend is insignificant at the 95% confidence level. The raw precipitation anomaly over WSA in JA of 2022 reaches 214 mm (hollow black bar in Fig. 2b), and the de-trended anomaly is 191 mm (solid blue bar in Fig. 2b). The time series for the de-trended precipitation anomaly over WSA has a correlation coefficient of 0.57 with the de-trended Tmax anomaly over YRV, which is statistically significant at the 95% confidence level, suggesting that hot summers over the YRV region are usually wet summers over the WSA region. This connection has been noted by Liu et al. (2015), and it suggests a possible dynamic connection between the extreme events over YRV and WSA occurred in 2022.
3.2 Connection with atmospheric circulation anomalies
Anomalous local descent is directly responsible for heat wave by suppressing cloud/precipitation formation and increasing shortwave radiation arrived at the surface (Hsu et al. 2017; Chen and Zhou 2018; Chen et al. 2019), while excessive (deficient) precipitation is associated with anomalous ascent (descent) according to the simplified form of moisture budget equation (Huang et al. 2015; Ni and Hsu 2018; He and Li 2019). As the vertical velocity near the surface is more affected by local terrain (Galarneau et al. 2012; Nie et al. 2016), we mainly focus on the pressure velocity (ω, negative/positive value indicates ascent/descent) in the upper troposphere averaged within 200–500 hPa to understand the large-scale dynamics. Figure 3a,b re-examines the correlation coefficients of JA-mean Tmax and precipitation anomalies with local ω in the upper troposphere. Evidently, Tmax has a significant positive correlation with local ω in most areas outside the plateau region, and the correlation coefficients are above 0.6 at most grid points over eastern China (Fig. 3a). Meanwhile, the seasonal precipitation anomaly has a negative correlation with local ω over most grid points except over the desert regions (Fig. 3b).

a Correlation coefficients between Tmax anomaly and local vertical velocity at interannual time scale, with stippling indicating the statistically significant correlation above the 95% confidence level. b Same as a but between precipitation and local vertical velocity. c Anomalous vertical velocity in 2022 (shading, unit: 10−2 Pa/s), with stippling indicating where the amplitude of anomaly exceeds the 2 standard deviation of interannual variability. The gray line indicates the climatological interface between tropical easterly wind and mid-latitude westerly wind, and the purple line indicates the interface in 2022. d The climatology of 200–500 hPa averaged vertical velocity (shading, unit: 10−2 Pa/s) and potential temperature (contours with an interval of 2 K)
As vertical velocity has a direct effect on Tmax and precipitation variability, Fig. 3c shows the anomalous ω in the upper troposphere in 2022. Anomalous descent appears over YRV and the southeastern flank of TP, which caused the anomalously hot and dry condition from the southeastern TP to YRV. Meanwhile, anomalous ascent appears over WSA and West Asia (Fig. 3c), which overlaps the flooding region over WSA and West Asia see (Fig. 1). Indeed, the regional averaged descent anomaly over YRV and the ascent anomaly over WSA in 2022 are both the strongest since 1979 (Fig. 2c). The climatological ω in subtropical Asia (near 30°N) is characterized by descent on the western side of TP and ascent over central-eastern TP and the eastern side of TP, and the 80°E meridian separates the descent region to the west and the ascent region to the east (Fig. 3d). The anomalous ω in 2022 shows an opposite spatial pattern to the climatological ω over subtropical Asia. As shown in the 27°-33°N averaged vertical profile (Fig. 4a), anomalous descent appears through the entire troposphere to the east of 80°E while anomalous ascent appears to the west of 80°E in the summer of 2022. The anomalous vertical velocity to the west of 80°E is noisy in the lower troposphere (Fig. 4a), possibly because of the forcing of the complex terrain on the low-level circulation (Galarneau et al. 2012; Nie et al. 2016).

The vertical profile for the 27°-33°N averaged anomalies in the JA of 2022. a Vertical velocity anomaly (unit: 10−2 Pa/s). b Zonal wind anomaly (unit: m/s). c Temperature advection (unit: K/day) by the geostrophic component of zonal wind anomaly. d Temperature advection by the geostrophic component of meridional wind anomaly. The 27°–33°N averaged potential temperature climatology is marked as contours in a with an interval of 5 K. The geostrophic wind component is calculated based on the horizontal gradient of geopotential height to calculate temperature advection in c, d, which is only slightly different from the total wind which contains a small ageostrophic wind component
In summer, the upper troposphere over TP is a warm center (Yanai et al. 1992; Ye and Wu 1998; Wu et al. 2015). Climatologically, the highest potential temperature (θ, proportional to entropy) is located at about 30°N, 80°E over western TP (contours in Fig. 3d), generating strong but opposite zonal gradient of θ on the western and eastern sides of 80°E. The isentropic surfaces in the mid and upper troposphere, indicated as contours in Fig. 4a, show a sinking structure over TP and incline eastward (westward) with altitude to the east (west) of 80°E. Climatologically, the interface between tropical easterly flow and mid-latitude westerly flow is located at the southern flank of TP (gay line in Fig. 3c), and westerly flow prevails over TP. Since adiabatic flow moves along isentropic surfaces (Rodwell and Hoskins 1996; Hoskins et al. 2003; Wu et al. 2020; Boos and Pascale 2021), subtropical westerly flow generates descent to the west of 80°E and ascent to the east of 80°E. Rodwell and Hoskins (1996) proposed the "monsoon-desert" mechanism to explain the formation of desert climate from Mediterranean to West Asia, and they emphasized that the descending air parcels on the western side of TP originate from the west along the westerly flow rather than from the South Asian monsoon region. Previous studies also suggested that the zonal-elongated ascent and rain band over subtropical East Asia is generated by the westerly flow from TP to the downstream (Sampe and Xie 2010; Kong and Chiang 2020). Given the unique atmospheric thermal structure over TP, the zonal flow over TP is crucial for the vertical motion on the western and eastern sides of TP.
However, easterly wind anomaly appears in 2022 in the mid-upper troposphere over TP and its vicinity (Fig. 4b), and geostrophic component accounts for a major fraction of it while the ageostrophic component is very small (figure not shown). Based on the climatological potential temperature distribution (\(\overline{\theta }\)) and the geostrophic components of the zonal and meridional wind anomalies (\({u}_{g}^{^{\prime}}, {v}_{g}^{^{\prime}}\)) in 2022, the temperature advections (\({u}_{g}^{^{\prime}}\frac{\partial \overline{\theta }}{\partial x}\mathrm{ and }{v}_{g}^{^{\prime}}\frac{\partial \overline{\theta }}{\partial y}\)) in pressure coordinates are calculated and shown in Fig. 4c,d. The anomalous easterly flow in 2022 produces anomalous cold (warm) advection to the east (west) of the climatological warm center over TP (Fig. 4c), and the magnitude of the zonal advection is much greater than the meridional advection associated with the anomalous meridional flow (Fig. 4d). Based on the quasi-geostrophic theory, cold (warm) advection by geostrophic flow induces descent (ascent) (Hoskins et al. 2003; Sampe and Xie 2010; Wu et al. 2020). Thus we hypothesize that the anomalous easterly flow may be responsible for the strong ascent/descent anomalies on the western/eastern sides of TP.
In order to quantitatively measure the direction and strength of zonal flow over subtropical TP, we define an easterly flow index (EI) by averaging the 200–500 hPa mean zonal wind within the 27°–33°N, 60°–120°E box and multiplying it by − 1. This region includes the TP and a fraction of the upstream and downstream regions, and we still call it "TP" for short. By multiplying − 1, a positive (negative) value of EI indicates easterly (westerly) flow over TP, and the regressed anomalies onto the EI anomaly for interannual variability are in phase with the observed anomalies in 2022. Figure 5a shows the year-by-year time series of EI and its anomaly. No significant long-term trend is detected for EI, but it is characterized by robust interannual variability. The EI is negative for most years with an average of − 2.6 m/s, suggesting that climatological westerly flow prevails over subtropical TP around 30°N. However, the EI values are positive in 1994, 2006, 2013 and 2022, and they show that the JA-mean zonal flow reversed in these four years (solid blue bars in Fig. 5a). Indeed, extreme heat wave events also occurred over subtropical East Asia in 1994, 2006 and 2013 (see Fig. 2a) and these events were widely studied (e.g., Guan and Yamagata 2003; Ding et al. 2010; Sun et al. 2014; Wang et al. 2016; Chen and Zhou 2018). During the past 44-year period, the strongest easterly flow over subtropical TP is seen in 2022, with an EI value of + 1.8 m/s (original wind speed, not anomaly), followed by the summer of 1994 (Fig. 5a) when WSA experienced the second largest positive precipitation anomaly during the past 44 years (see Fig. 2b).

a Time series for the EI (solid blue bar) in summer and its anomaly (hollow black bar), where the EI is defined as the 200–500 hPa averaged zonal wind within 27°-33°N, 60°-120°E multiplied by − 1. b The latitude of the 60°–120°E averaged interface between tropical easterly wind and mid-latitude westerly wind, based on 200–500 hPa mean zonal wind
As the subtropics is a transition region between tropical easterly flow and mid-latitude westerly flow, the seasonal mean latitude for the interface between tropical easterly flow and mid-latitude westerly flow is shown in Fig. 5b for each year, based on the 200–500 hPa averaged zonal wind within 60°-120°E. The climatological E/W interface is located at about 28.4°N but it shows interannual variability (Fig. 5b). The latitude of E/W interface has a correlation coefficient of 0.94 with EI anomaly, suggesting that westerly flow is weaker and easterly flow may prevail over subtropical TP when the E/W interface shifts northward. In the summer of 2022, the seasonal mean latitude of the E/W interface is 30.7°N, which is the most extreme northward shift during the past 44 years (Fig. 5b), and a large fraction of the southern TP is located in the tropical easterly belt (see the purple line in Fig. 3c for the E/W interface in 2022).
In order to disentangle the effect of anomalous zonal flow over TP on the interannual variability of Asian climate, Fig. 6 shows the regressed anomalies of de-trended Tmax, precipitation, and atmospheric circulation in JA onto the EI anomaly based on the past 44 summers. Anomalous easterly flow over TP (positive EI anomaly) is associated with positive Tmax anomalies over East Asia covering eastern TP, YRV, Korean Peninsula and Japan, and also negative Tmax anomalies over WSA including Pakistan, northwest India and Arabian Peninsula (Fig. 6a). Meanwhile, anomalous easterly flow over TP is also associated with negative precipitation anomalies over East Asia from the YRV to Japan, and positive precipitation anomalies over the WSA including Pakistan and northwestern India (Fig. 6b). Statistically significant positive precipitation anomalies are also seen over the desert regions over West Asia, but their magnitudes are small due to the scarce mean state precipitation. The pattern of the regressed Tmax and precipitation anomalies onto the EI anomaly shares a similar pattern to the observed Tmax and precipitation anomalies in 2022, suggesting that the reversed zonal flow over TP may play a key role in the anomalous Asian climate in 2022.

The regressed seasonal mean anomalies in summer onto the EI anomaly. a Tmax anomaly (unit: K), b Precipitation anomaly (unit: mm), c Vertical velocity anomaly (unit: 10−2 Pa/s), d Vertical profile of 27°–33°N averaged vertical velocity anomaly (unit: 10−2 Pa/s, color bar is the same as in c). All the quantities shown here indicates the anomalies corresponding to + 1 m/s of EI anomaly, and the stippling indicates the regressed values statistically significant at the 95% confidence level. The gray contour in d indicates the climatological potential temperature, which is the same as in Fig. 4a
How does the anomalous zonal flow over TP modulates subtropical Asian climate? Fig. 6c shows the regressed vertical velocity anomalies in the upper troposphere (200–500 hPa averaged) onto EI anomaly. Associated with anomalous easterly flow over TP, anomalous descent appears over a belt region covering the southeastern TP, the YRV and Japan, and anomalous ascent appears on the western side of TP over the WSA and West Asia. As seen from the 27°–33°N averaged profile (Fig. 6d), 80°E is a critical longitude where anomalous descent (ascent) appears on its east (west) side associated with anomalous easterly flow, consistent with the climatological thermal structure with a warm center at about 80°E. Hence isentropic gliding is the key mechanism connecting the anomalous zonal flow over TP with the anomalous vertical motion on the eastern and western sides of the warm center (Rodwell and Hoskins 1996; Hoskins et al. 2003; Wu et al. 2020; Boos and Pascale 2021). As adiabatic flow moves along isentropic surfaces, westward-moving air parcels descend to the east of 80°E and ascend to the west of 80°E following the sloping isentropic surfaces (gray contours in Fig. 6d). The anomalous vertical motion primarily induced by the isentropic gliding may be further amplified by diabatic feedback processes, such as the latent heating feedback due to suppressed (enhanced) precipitation and latent heating in the descending (ascending) region (Rodwell and Hoskins 1996; Hoskins et al. 2003; Wu et al. 2020).
The linkage between the anomalous zonal flow over TP and the anomalous vertical motion may also be understood from the perspective of horizontal temperature advection. As a warm center exists in the upper troposphere over TP and the temperature decreases from 80°E to its eastern and western sides, anomalous easterly geostrophic wind may generate cold (warm) advection on the eastern (western) side of the warm center if the air parcels move along isobaric surfaces. To balance the cold (warm) horizontal advection, adiabatic flow must descend (ascend) to generate adiabatic heating (cooling). Indeed, it is well accepted that warm/cold advection by horizontal circulation generates adiabatic ascent/descent (e.g., Barlow et al. 2005; Sampe and Xie 2010; Liu et al. 2015; Kong and Chiang 2020), and it is equivalent to the explanation based on the concept of isentropic gliding. However, caution should be taken that adiabatic flow actually move along isentropic surfaces rather than isobaric surfaces.
Figure 7 further evaluates the contribution of EI anomaly to the regional averaged quantities from a linear regression perspective. The EI anomaly has a high correlation coefficient of 0.86 with the regional averaged Tmax anomaly over YRV region (Fig. 7a), suggesting that the seasonal mean Tmax in summer over YRV is almost determined by the anomalous zonal flow over TP. Based on the linear regression equation listed in Fig. 7a, the observed EI anomaly in 2022 corresponds to a Tmax anomaly of 1.8 K over YRV, which is close to the observed anomaly of 2.3 K. This also suggests that the anomalous zonal flow over TP is the dominant dynamic mechanism for the anomalously high temperature over YRV in 2022. The correlation coefficient between EI anomaly and precipitation anomaly over WSA is 0.56 for the 1979–2022 period, which is statistically significant at the 95% confidence level. Based on the linear regression equation shown in Fig. 7b, the EI anomaly in 2022 corresponds to a precipitation anomaly of about 60 mm over the WSA region, which accounts for about 1/3 of the observed anomaly of 192 mm.

a Scatter plot for the regional averaged Tmax anomaly over YRV as a function of the EI anomaly for the past 44 years. b Scatter plot for the regional averaged precipitation anomaly over WSA as a function of EI anomaly. The red dot indicates the year of 2022 and the blue dots indicate the other 43 years. The linear regression equation and correlation coefficient are marked on the upper-right corner of each panel
3.3 Relative roles of SST anomaly and atmospheric internal variability
Figure 8a shows the correlation coefficients between EI anomaly and the SST anomalies. Significant negative correlation is seen along equatorial central-eastern Pacific and tropical Indian Ocean (TIO), suggesting that the cold SST anomalies over equatorial Pacific and TIO in summer favor an easterly wind anomaly over TP. The observed (de-trended) tropical SST anomaly in 2022 is also characterized by cold SST anomaly over TIO and equatorial central-eastern Pacific (Fig. 8b). Previous studies suggested that the basin-wide warm (cold) SST anomalies over TIO in summer is a delayed response to the El Niño (La Niña) condition in the preceding winter and spring (Yang and Liu 2008; Wu et al. 2009, 2021; Xie et al. 2009), and the cold SST anomaly over TIO in the summer of 2022 is indeed associated with La Niña condition in the preceding winter and spring (figure not shown). Previous studies mostly focused on the impact of warm SST anomaly over TIO on the excessive summer rainfall along YRV such as in 2020 (e.g., Takaya et al. 2020; Pan et al. 2021; Zhou et al. 2021), but less attention was paid to the opposite case.

a Correlation coefficient between EI anomaly with tropical SST anomalies at interannual time scale based on the past 44 years, and the stippling indicates where the correlation coefficient is statistically significant at the 95% confidence level. b The SST anomalies in 2022. c Time series for the regional averaged SST anomalies over TIO within 20°S–20°N, 40°–110°E (blue bar, trend removed), and the red line indicates the linear trend. d Same as a but the signal of TIO SST anomaly (shown in c) is linearly removed from the SST anomaly at all grid points before calculating the correlation coefficient. e Regressed tropospheric (900–200 hPa averaged) temperature anomalies (unit: K) onto EI anomaly. f Regressed upper tropospheric (500–200 hPa averaged) zonal wind anomalies (unit: m/s) onto EI anomaly. The stippling in (e) and (f) indicates where the regressed anomalies are statistically significant at the 95% confidence level
Figure 8c shows the time series for the regional averaged SST anomaly over TIO within 20°S–20°N, 40°–110°E, referred as TIO-SSTA index. There is indeed a remarkable linear warming trend of TIO-SSTA index (red line in Fig. 8c), which may mask the cold SST anomaly over TIO in 2022 if the trend is not removed. Indeed, during the recent cases when extreme heat waves occurred in YRV such as in 1994, 2006 and 2013, the SST anomalies over TIO are all negative (Fig. 8c), suggesting the potential contribution of the SST anomaly over TIO. As the SST anomalies over different sectors of tropical oceans are not independent, we linearly removed the variability associated with the TIO-SSTA index at each oceanic grid point by regressing it onto the TIO-SSTA index shown in Fig. 8c, and obtained the residual SST variability. Figure 8d shows the correlation coefficient between the residual SST variability and EI anomaly. No statistically significant correlation is seen in the tropical ocean (Fig. 8d), suggesting that the TIO SST anomaly in summer has integrated the tropical SST signals which have an impact on the EI anomaly. Therefore, it is reasonable to explain the contribution of tropical SST anomalies on the EI anomaly by only considering the TIO sector.
Figure 8e, f shows the regressed tropospheric temperature (TT, 900–200 hPa averaged) anomalies and upper tropospheric zonal wind (200–500 hPa averaged) anomalies onto the TIO-SSTA index shown in Fig. 8c. A warm SST anomaly over the TIO stimulates a warm TT anomaly in the tropics to the south of 30°N, but it cannot effectively warm the troposphere in the extra-tropics (Fig. 8e). As a result, the meridional gradient of TT is enhanced at about 30°N, leading to a westerly wind anomaly in the upper troposphere over TP (Fig. 8f) under the constraint of the thermal wind relationship. Indeed, previous studies also proposed that the warm (cold) SST anomaly over TIO in summer stimulates a warm Kelvin wave, forming a wedge-like warm (cold) TT anomaly over the TIO (Xie et al. 2009, 2016; Zhang et al. 2022). In the summer of 2022, an opposite case to Fig. 8e, f occurred, and the cold SST anomaly over TIO reduced the meridional temperature gradient and induced an easterly wind anomaly over TP.
Figure 9a shows the scatter plot for the EI anomaly as a function of TIO SST anomaly for the past 44 years. A negative correlation of − 0.51 exists between these two quantities, which is statistically significant at the 95% confidence level. The SST anomaly over TIO is − 0.28 K in 2022 (see Fig. 8c), and it may stimulate an EI anomaly of − 0.42*(− 0.28) = 1.2 m/s based on the linear regression equation of Y = − 0.42X (dashed purple line in Fig. 9a), which is about 1/3 of the observed EI anomaly of 3.7 m/s in 2022 (red dot in Fig. 9a). Therefore, the TIO SST anomaly contributed to about 1/3 of the easterly wind anomaly over TP in 2022, and atmospheric internal variability may explain a major fraction of the other 2/3. Indeed, idealized climate model simulations suggest that SST anomalies explain no more than 30% of the interannual climate variability over subtropical Asia (He et al. 2016, 2017).

a Scatter diagram for the EI anomaly as a function of TIO SST anomaly based on the past 44 years, where the year of 2022 is marked as red dot. b Fitted normal distribution of the EI anomaly assuming the linear impact of TIO SST anomaly is removed from the EI anomaly (black curve), and the shift of the distribution forced by an SST anomaly over TIO as observed in 2022 (blue curve)
Based on the linear regression equation of Y = − 4.2X as listed in Fig. 9a, we removed the linear impact of TIO-SSTA index on the EI anomaly and obtained the residual EI anomaly for each year. The residual EI anomalies for the past 44 years still have substantial interannual variability, with a standard deviation of σ = 1.4 m/s. Supposing that the EI is normally distributed with a climatology of − 2.6 m/s and σ = 1.4 m/s (see Fig. 5a), the probability for EI > 0 is only 2.6% (black curve in Fig. 9b). In other words, the probability for a reversed JA-mean zonal flow over TP is only 2.6% in the absence of TIO SST variability. The SST anomaly over TIO in 2022 stimulates an EI anomaly of 1.2 m/s as shown in Fig. 9a, and it shifts the distribution of EI rightward by 1.2 m/s (blue curve in Fig. 9b), assuming that the atmospheric internal variability is independent on the SST anomalies (fixed σ). This shift increases the probability for reversed JA-mean zonal flow over TP from 2.6% to 14.4%. Hence the cold SST anomaly over TIO in 2022 not only enhances the anomalous easterly flow over TP but also increases the probability for reversed total zonal flow over TP by about 5 times.
In order to examine how atmospheric internal variability further enhances the easterly anomaly over TP in 2022, Fig. 10 shows the atmospheric circulation anomalies over the entire Eurasian continent. In the upper troposphere (Fig. 10a), a wave train pattern appears over the Eurasian continent, characterized by an anomalous anticyclone over Eastern Europe, an anomalous cyclone on the western side of the Lake of Baikal, and an anomalous anticyclone over northern China (marked with "A", "C", "A" letters in Fig. 10a), resembling an Eurasian (EU) or circum-global teleconnection (CGT) pattern (Ding and Wang 2005, 2007). In summer, the climatological westerly jet core is located at about 40°–50°N (the gray shading in Fig. 10a), and the anomalous anticyclone over northern China acts to intensify the westerly jet in the mid-latitude East Asia but weakens the westerly flow over TP (Fig. 10a). Indeed, many studies have revealed the essential role of the mid-latitude wave train in the heat waves over YRV (e.g., Wang et al. 2013, 2014; Chen and Zhou 2018; Gao et al. 2018) and precipitation over WSA (Lau and Kim 2012; Jiang and Ting 2017; Di Capua et al. 2021).

Anomalous vertical velocity (shading, unit: 10−2 Pa/s) and horizontal wind (vectors) in 2022, averaged within (a) 200–500 hPa and (b) 600–900 hPa. The shading in (a) indicates the jet core region where the climatological zonal wind exceeds 10 m/s. Note that the reference length scales for the wind vectors are different for (a) and (b)
In the mid latitudes, anomalous ascent (descent) appears where there is an anomalous southerly (northerly) flow along the wave train (Fig. 10a). Indeed, the meridional temperature gradient is much greater than the zonal gradient in most areas over mid latitudes and the isentropic surfaces generally incline northward with altitude. Therefore, southerly (northerly) flow effectively stimulates upward (downward) motion through isentropic gliding in mid latitudes, consistent with the fact that ascent (descent) generally appears on the eastern (western) section of a trough or cyclone in weather chart. However, as already shown in this work, the anomalous vertical motion on the eastern and western sides of subtropical TP is more closely related to the zonal flow rather than the meridional flow, due to the unique thermal structure over TP. Given that the climatological isentropic surfaces primarily incline eastward (westward) with altitude on the eastern (western) side of subtropical TP (contours in Figs. 4a and 6d), anomalous zonal flow can effectively stimulate anomalous vertical motion via isentropic gliding. Therefore, the unique climatological thermal structure over TP explains why the linkage between horizontal flow and vertical motion around TP is different from the mid latitudes.
In the lower troposphere (Fig. 10b), the atmospheric circulation anomalies in 2022 over mid latitudes are generally in phase with those in the upper troposphere, exhibiting a barotropic structure. Over South Asia, anomalous easterly wind appears in the lower troposphere (Fig. 10b), suggesting an anomalously weak South Asian summer monsoon circulation. Therefore, the strength of monsoon circulation cannot explain the excessive rainfall over WSA in 2022. There is a weak anomalous anticyclone extending from the western North Pacific (WNP) to southern China in the lower troposphere (Fig. 10b). As previous studies showed that an anomalous anticyclone over the WNP favors excessive precipitation along the YRV by generating ascent and transporting water vapor (Xie et al. 2009; Hu et al. 2017; Zhou et al. 2021), this anomalous anticyclone cannot explain the observed descent anomaly and hot dry condition over YRV in 2022. There is a lower tropospheric pathway through which warm/cold SST anomaly over the TIO stimulates an anomalous anticyclone/cyclone in the lower troposphere over WNP (e.g., Wu et al. 2009; Xie et al. 2009; Jiang et al. 2013; Zhou et al. 2021), but this mechanism does not play a dominant role in 2022. Instead, the anomalous anticyclone over WNP in 2022 may be a passive Rossby wave response to the suppressed latent heating over subtropical East Asia and WNP (Wu et al. 2009; Xie et al. 2009), and the anomalous descent from YRV to WNP results from the reversed zonal flow in the upper troposphere arising from both atmospheric internal variability and the forcing by negative SST anomaly over TIO.
4 Summary and Concluding Remarks
Unprecedented heat wave along YRV and flood over WSA occurred in the summer of 2022, on the eastern and the western sides of TP, respectively. From the perspective of interannual variability, this study investigated how these extreme events in 2022 are connected with anomalous atmospheric circulation, and identified the essential role of the reversed zonal flow over TP. We explained the mechanism how the anomalous zonal flow over TP generates anomalous vertical motion on the eastern and western sides of TP, and examined the relative roles of the SST anomalies and atmospheric internal variability in the circulation anomaly. The major findings are summarized as follows.
-
(1)
Interannual climate variability explains a major fraction of the extreme heat wave over YRV and the extreme flood over WSA in 2022. Even with the long-term linear trend removed, the seasonal mean Tmax over the YRV and the precipitation amount over the WSA in 2022 are still the highest since 1979. The summertime Tmax over the YRV has a significant warming trend of 0.47 K/decade, and it accounts for about 1/3 of the raw Tmax anomaly over YRV in 2022 relative to the 1979–2022 climatology, while the precipitation amount over the WSA does not have a significant long-term trend in the past 44 years. Based on the interannual variability, an anomalous easterly flow over subtropical TP is associated with both anomalously hot condition over YRV (correlation: 0.86) and anomalously wet condition over WSA (correlation: 0.56). Associated with an extreme northward shift of the interface between tropical easterlies and mid-latitude westerlies, easterly flow controls subtropical TP in the summer of 2022, as well as in 1994, 2006 and 2013. The anomalous easterly flow over subtropical TP in 2022 is the strongest since 1979, and it is the prime culprit for the extremely hot YRV and extremely flooding WSA in 2022.
-
(2)
The zonal flow over TP modulates the climate variability over subtropical Asia by stimulating vertical motion on the eastern and western sides of TP, primarily through isentropic gliding. As the upper troposphere over TP is a warm center, the isentropic surfaces incline eastward (westward) with altitude on the eastern (western) side of TP (schematically shown as red curves in Fig. 11). Climatologically, seasonal mean westerly flow prevails over TP, and descent (ascent) is generated on the western (eastern) side of TP when air parcels move eastward along the sloping isentropic surfaces (arrows in Fig. 11a), leading to hot arid climate in WSA and West Asia and moist climate in East Asia (Fig. 11a). However, in the summer of 2022, easterly flow prevails over subtropical TP. The easterly flow generates descent on the eastern side of TP and ascent on the western side of TP via isentropic gliding, leading to extremely hot dry condition over the YRV and cool wet condition over the WSA and West Asia (Fig. 11b), just like a swap of the climates between the eastern and western sides of TP. The above mechanism shown in Fig. 11 is also valid for anomalous westerly/easterly flow, and it is the key mechanism connecting the anomalous zonal flow over TP with climate variability on the eastern and western sides of subtropical TP.
Fig. 11 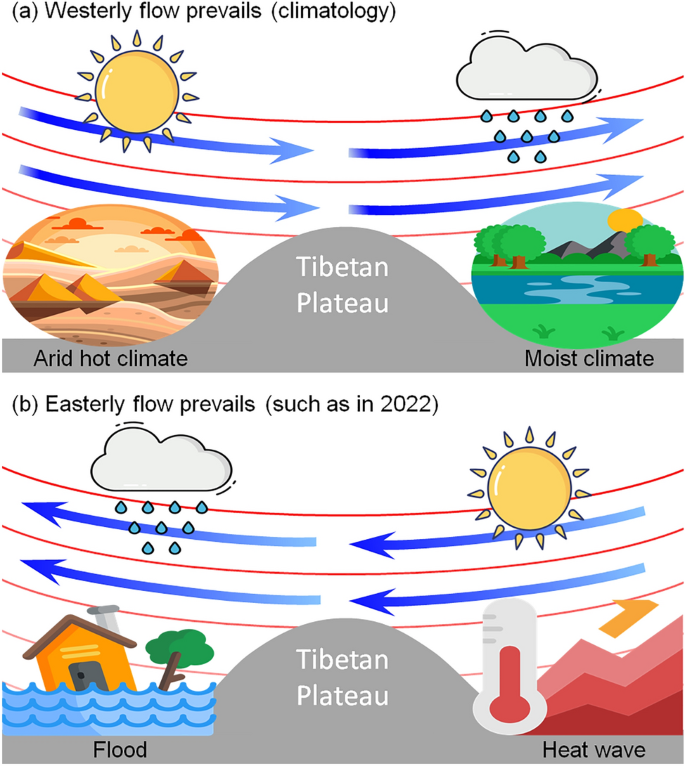
Schematic diagram illustrating the mechanism how subtropical Asian climate is connected to the zonal flow over TP. a Climatological westerly flow prevails. b Easterly flow prevails. The red curves sinking over TP indicate the climatological isentropic surfaces. As adiabatic flow moves along isentropic surfaces, westerly flow generates descent (ascent) on the western (eastern) side of TP, and vice versa for the easterly flow over TP (blue arrows). See the text for details. This figure is designed using images from Flaticon.com
-
(3)
The anomalous zonal flow over TP is dominated by atmospheric internal dynamics but also forced by the basin-wide SST anomalies over TIO. The warm (cold) TIO SST anomaly in summer associated with preceding El Niño (La Niña) condition acts to enhance (weaken) the westerly wind over TP, by warming (cooling) tropical troposphere and enhancing (weakening) the meridional temperature gradient over subtropical Asia under the constraint of the thermal wind relationship. Although the TIO SST is subject to a linear warming trend, negative SST anomaly over TIO is evident in 2022 if the warming trend is removed. Linear regression shows that the negative SST anomaly over TIO in 2022 explains about 1/3 of the anomalous easterly flow over TP in 2022, and it increases the probability of reversed seasonal mean zonal flow over TP by about 5 times. The rest of the easterly wind anomaly over TP in 2022 is explained by atmospheric internal variability associated with a wave train in the mid latitudes.

Based on the interannual relationship, the anomalous zonal flow over TP almost determines the interannual Tmax variability over YRV (Fig. 7a), but its control on the precipitation over WSA is relatively weak and it only explains about 1/3 of the precipitation anomaly over WSA in the summer of 2022 (Fig. 7b). Indeed, precipitation is strongly affected by local processes and synoptic disturbances besides the seasonal mean large-scale atmospheric circulation, such as the interaction of low-level circulation with local topography over WSA (Galarneau et al. 2012; Nie et al. 2016), stochastic noise related to meso-scale systems such as tropical cyclones (Hussain and Lee 2009; Paulikas and Rahman 2015), and the feedback of local and remote diabatic heating anomalies on atmospheric circulation over WSA (Vellore et al. 2015; Nie et al. 2016; Jiang and Ting 2017, 2019; Wang et al. 2019), which deserve further study. On the other hand, while the anomalous zonal flow over TP dominates the interannual Tmax variability over YRV and the extreme heat wave in 2022, the ongoing global warming may further amplify heat waves and increase the frequency of extreme heat waves (e.g., Sun et al. 2014; Li et al. 2020; Cao et al. 2021). More efforts are needed to estimate how anthropogenic forcing has increased the frequency of extreme heat waves like the heat wave over YRV in 2022.
Data availability
All the dataset adopted in this study can be accessed online via the following URL. The CPC daily gridded temperature data on global land area: https://psl.noaa.gov/data/gridded/data.cpc.globaltemp.html. GPCP global gridded monthly precipitation data: https://psl.noaa.gov/data/gridded/data.gpcp.html. ERA5 global gridded monthly reanalysis data: https://cds.climate.copernicus.eu/cdsapp#!/dataset/reanalysis-era5-pressure-levels-monthly-means. Extended Reconstructed SST version 5: https://psl.noaa.gov/data/gridded/data.noaa.ersst.v5.html.
References
Adler RF, Huffman GJ, Chang A, Ferraro R, Xie PP, Janowiak J, Rudolf B, Schneider U, Curtis S, Bolvin D, Gruber A, Susskind J, Arkin P, Nelkin E (2003) The version-2 global precipitation climatology project (GPCP) monthly precipitation analysis (1979-present). J Hydrometeorol 4(6):1147–1167. https://doi.org/10.1175/1525-7541(2003)004%3c1147:tvgpcp%3e2.0.co;2
Barlow M, Wheeler M, Lyon B, Cullen H (2005) Modulation of daily precipitation over southwest Asia by the madden–Julian oscillation. Mon Weather Rev 133(12):3579–3594. https://doi.org/10.1175/mwr3026.1
Cao H, Amiraslani F, Liu J, Zhou N (2015) Identification of dust storm source areas in West Asia using multiple environmental datasets. Sci Total Environ 502:224–235. https://doi.org/10.1016/j.scitotenv.2014.09.025
Cao N, Li G, Rong M, Yang J, Xu F (2021) Large Future Increase in Exposure Risks of Extreme Heat Within Southern China Under Warming Scenario. Frontiers in Earth Science 9. https://doi.org/10.3389/feart.2021.686865
Di Capua G, Sparrow S, Kornhuber K, Rousi E, Osprey S, Wallom D, van den Hurk B, Coumou D (2021) Drivers behind the summer 2010 wave train leading to Russian heatwave and Pakistan flooding. npj Climate and Atmospheric Science 4 (1). doi:https://doi.org/10.1038/s41612-021-00211-9
Chen X, Zhou T (2018) Relative contributions of external SST forcing and internal atmospheric variability to July–August heat waves over the Yangtze River valley. Clim Dynam 51(11–12):4403–4419. https://doi.org/10.1007/s00382-017-3871-y
Chen R, Wen Z, Lu R, Wang C (2019) Causes of the extreme hot midsummer in central and south china during 2017: role of the western tropical pacific warming. Adv Atmos Sci 36(5):465–478. https://doi.org/10.1007/s00376-018-8177-4
Deser C, Guo R, Lehner F (2017) The relative contributions of tropical Pacific sea surface temperatures and atmospheric internal variability to the recent global warming hiatus. Geophys Res Lett 44(15):7945–7954. https://doi.org/10.1002/2017gl074273
Ding Q, Wang B (2005) Circumglobal teleconnection in the Northern Hemisphere Summer. J Climate 18(17):3483–3505. https://doi.org/10.1175/jcli3473.1
Ding Q, Wang B (2007) Intraseasonal Teleconnection between the Summer Eurasian Wave Train and the Indian Monsoon. J Climate 20(15):3751–3767. https://doi.org/10.1175/jcli4221.1
Ding T, Qian W, Yan Z (2010) Changes in hot days and heat waves in China during 1961–2007. Int J Climatol 30(10):1452–1462. https://doi.org/10.1002/joc.1989
Ding Y, Liang P, Liu Y, Zhang Y (2020) Multiscale Variability of Meiyu and Its Prediction: A New Review. J Geophys Res 125 (7). https://doi.org/10.1029/2019jd031496
Galarneau TJ, Hamill TM, Dole RM, Perlwitz J (2012) A multiscale analysis of the extreme weather events over Western Russia and Northern Pakistan during July 2010. Mon Weather Rev 140(5):1639–1664. https://doi.org/10.1175/mwr-d-11-00191.1
Gao M, Wang B, Yang J, Dong W (2018) Are Peak summer sultry heat wave days over the Yangtze-Huaihe River Basin Predictable? J Climate 31(6):2185–2196. https://doi.org/10.1175/jcli-d-17-0342.1
Gao Q, Li Y, Han T (2021) Intra-seasonal features of an extreme high temperature event in 2011 in Eastern China and Its atmospheric circulation. J Trop Meteorol 27(4):437–446. https://doi.org/10.46267/j.1006-8775.2021.038
Guan ZY, Yamagata T (2003) The unusual summer of 1994 in East Asia: IOD teleconnections. Geophys Res Lett 30 (10):-
Ha K-J, Heo K-Y, Lee S-S, Yun K-S, Jhun J-G (2012) Variability in the East Asian Monsoon: a review. Meteorological applications:n/a-n/a. https://doi.org/10.1002/met.1320
Hamouda ME, Kucharski F (2018) Ekman pumping mechanism driving precipitation anomalies in response to equatorial heating. Clim Dynam 52(1–2):697–711. https://doi.org/10.1007/s00382-018-4169-4
He C, Li T (2019) Does global warming amplify interannual climate variability? Clim Dynam 52(5):2667–2684. https://doi.org/10.1007/s00382-018-4286-0
He C, Wu B, Li C, Lin A, Gu D, Zheng B, Zhou T (2016) How much of the interannual variability of East Asian summer rainfall is forced by SST? Clim Dynam 47(1):555–565. https://doi.org/10.1007/s00382-015-2855-z
He C, Wang L, Gu D, Lin A, Li C, Zheng B (2017) The fraction of East Asian interannual climate variability explained by SST in different seasons: an estimation based on 12 CMIP5 models. Atmos Sci Lett 18(2):45–51. https://doi.org/10.1002/asl.722
Hersbach H, Bell B, Berrisford P, Hirahara S, Horányi A, Muñoz-Sabater J, Nicolas J, Peubey C et al (2020) The ERA5 global reanalysis. Q J Roy Meteor Soc 146(730):1999–2049. https://doi.org/10.1002/qj.3803
Hoskins B, Pedder M, Jones DW (2003) The omega equation and potential vorticity. Q J Roy Meteor Soc 129(595):3277–3303. https://doi.org/10.1256/qj.02.135
Hsu P-C, Lee J-Y, Ha K-J, Tsou C-H (2017) Influences of boreal summer intraseasonal oscillation on heat waves in Monsoon Asia. J Climate 30(18):7191–7211. https://doi.org/10.1175/jcli-d-16-0505.1
Hu K, Huang G, Xie S-P (2019) Assessing the internal variability in multi-decadal trends of summer surface air temperature over East Asia with a large ensemble of GCM simulations. Clim Dynam 52(9–10):6229–6242. https://doi.org/10.1007/s00382-018-4503-x
Huang B, Thorne PW, Banzon VF, Boyer T, Chepurin G, Lawrimore JH, Menne MJ, Smith TM, Vose RS, Zhang H-M (2017) Extended reconstructed sea surface temperature, version 5 (ERSSTv5): upgrades, validations, and intercomparisons. J Climate 30(20):8179–8205. https://doi.org/10.1175/jcli-d-16-0836.1
Hussain MS, Lee S-H (2009) A classification of rainfall regions in Pakistan. J Korean Geographi Soc 44(5):605–623
Jiang X, Ting M (2017) A dipole pattern of summertime rainfall across the indian subcontinent and the Tibetan Plateau. J Climate 30(23):9607–9620. https://doi.org/10.1175/jcli-d-16-0914.1
Jiang X, Ting M (2019) Intraseasonal variability of rainfall and its effect on interannual variability across the indian subcontinent and the Tibetan Plateau. J Climate 32(8):2227–2245. https://doi.org/10.1175/jcli-d-18-0319.1
Jiang X, Yang S, Li J, Li Y, Hu H, Lian Y (2013) Variability of the Indian Ocean SST and its possible impact on summer western North Pacific anticyclone in the NCEP Climate Forecast System. Clim Dynam 41(7–8):2199–2212. https://doi.org/10.1007/s00382-013-1934-2
Karzani M, Ghavidel Y, Farajzadeh M (2022) Temporal changes in lethal temperatures above 50 °C in the northern hemisphere. Pure Appl Geophys. https://doi.org/10.1007/s00024-022-03109-6
Kong W, Chiang JCH (2020) Interaction of the Westerlies with the Tibetan Plateau in Determining the Mei-Yu Termination. J Climate 33(1):339–363. https://doi.org/10.1175/jcli-d-19-0319.1
Lau WKM, Kim K-M (2012) The 2010 Pakistan Flood and Russian Heat Wave: Teleconnection of Hydrometeorological Extremes. J Hydrometeorol 13(1):392–403. https://doi.org/10.1175/jhm-d-11-016.1
Li C, Sun Y, Zwiers F, Wang D, Zhang X, Chen G, Wu H (2020) Rapid warming in summer wet bulb globe temperature in China with human-induced climate change. J Climate 33(13):5697–5711. https://doi.org/10.1175/jcli-d-19-0492.1
Littmann T (1991) Dust storm frequency in Asia: Climatic control and variability. Int J Climatol 11:393–412. https://doi.org/10.1002/joc.3370110405
Liu Y, Wu G (2004) Progress in the study on the formation of the summertime subtropical anticyclone. Adv Atmos Sci 21(3):322–342. https://doi.org/10.1007/bf02915562
Liu G, Wu R, Sun S, Wang H (2015) Synergistic contribution of precipitation anomalies over northwestern India and the South China Sea to high temperature over the Yangtze River Valley. Adv Atmos Sci 32(9):1255–1265. https://doi.org/10.1007/s00376-015-4280-y
Liu B, Zhu C, Ma S, Yan Y (2022) Combined effects of tropical indo-pacific–atlantic SST anomalies on record-breaking floods over Central-North China in September 2021. J Climate 35(18):6191–6205. https://doi.org/10.1175/jcli-d-21-0988.1
Middleton NJ (1986) A geography of dust storms in South-West Asia. J Climatol 6(2):183–196. https://doi.org/10.1002/joc.3370060207
Ni Y, Hsu P-C (2018) Inter-annual variability of global monsoon precipitation in present-day and future warming scenarios based on 33 coupled model intercomparison project phase 5 models. Int J Climatol 38(13):4875–4890. https://doi.org/10.1002/joc.5704
Nie J, Shaevitz DA, Sobel AH (2016) Forcings and feedbacks on convection in the 2010 Pakistan flood: Modeling extreme precipitation with interactive large-scale ascent. J Adv Modeling Earth Syst 8(3):1055–1072. https://doi.org/10.1002/2016ms000663
Pan X, Li T, Sun Y, Zhu Z (2021) Cause of Extreme heavy and persistent rainfall over yangtze river in summer 2020. Adv Atmos Sci. https://doi.org/10.1007/s00376-021-0433-3
Paulikas MJ, Rahman MK (2015) A temporal assessment of flooding fatalities in Pakistan (1950–2012). J Flood Risk Manag 8(1):62–70. https://doi.org/10.1111/jfr3.12084
Rashid IU, Almazroui M, Saeed S, Atif RM (2020) Analysis of extreme summer temperatures in Saudi Arabia and the association with large-scale atmospheric circulation. Atmos Res 231:104659. https://doi.org/10.1016/j.atmosres.2019.104659
Rodwell MJ, Hoskins BJ (1996) Monsoons and the dynamics of deserts. Q J Roy Meteor Soc 122(534):1385–1404. https://doi.org/10.1002/qj.49712253408
Sampe T, Xie SP (2010) Large-scale dynamics of the Meiyu-Baiu rainband: environmental forcing by the westerly jet. J Climate 23(1):113–134. https://doi.org/10.1175/2009jcli3128.1
Sun S, Ying M (1999) Subtropical high anomalies over the western pacific and its relations to the asian monsoon and sst anomaly. Adv Atmos Sci 16(4):559–568. https://doi.org/10.1007/s00376-999-0031-2
Sun Y, Zhang X, Zwiers FW, Song L, Wan H, Hu T, Yin H, Ren G (2014) Rapid increase in the risk of extreme summer heat in Eastern China. Nature Clim Change 4(12):1082–1085. https://doi.org/10.1038/nclimate2410
Takaya Y, Ishikawa I, Kobayashi C, Endo H, Ose T (2020) Enhanced Meiyu‐Baiu Rainfall in Early Summer 2020: Aftermath of the 2019 Super IOD Event. Geophys Res Lett 47 (22). https://doi.org/10.1029/2020gl090671
Trenberth KE, Shea DJ (2005) Relationships between precipitation and surface temperature. Geophys Res Lett 32 (14). https://doi.org/10.1029/2005GL022760
Vellore RK, Kaplan ML, Krishnan R, Lewis JM, Sabade S, Deshpande N, Singh BB, Madhura RK, Rama Rao MVS (2015) Monsoon-extratropical circulation interactions in Himalayan extreme rainfall. Clim Dynam 46(11–12):3517–3546. https://doi.org/10.1007/s00382-015-2784-x
Wang W, Zhou W, Wang X, Fong SK, Leong KC (2013) Summer high temperature extremes in Southeast China associated with the East Asian jet stream and circumglobal teleconnection. Journal of Geophysical Research: Atmospheres 118(15):8306–8319. https://doi.org/10.1002/jgrd.50633
Wang W, Zhou W, Chen D (2014) Summer High temperature extremes in southeast China: bonding with the el niño-southern oscillation and east Asian summer monsoon coupled system. J Climate 27(11):4122–4138. https://doi.org/10.1175/jcli-d-13-00545.1
Wang W, Zhou W, Li X, Wang X, Wang D (2016) Synoptic-scale characteristics and atmospheric controls of summer heat waves in China. Clim Dynam 46(9):2923–2941. https://doi.org/10.1007/s00382-015-2741-8
Wang Z, Yang S, Duan A, Hua W, Ullah K, Liu S (2019) Tibetan Plateau heating as a driver of monsoon rainfall variability in Pakistan. Clim Dynam 52(9):6121–6130. https://doi.org/10.1007/s00382-018-4507-6
Wang X, Xie S-P, Guan Z (2020) Atmospheric internal variability in the summer indo-northwestern pacific: role of the intraseasonal oscillation. J Climate 33(8):3395–3410. https://doi.org/10.1175/jcli-d-19-0794.1
Wang P, Tang J, Sun X, Wang S, Wu J, Dong X, Fang J (2017) Heat Waves in China: Definitions, Leading Patterns, and Connections to Large-Scale Atmospheric Circulation and SSTs. Journal of Geophysical Research: Atmospheres 122 (20):10,679–610,699. https://doi.org/10.1002/2017jd027180
Wu B, Zhou TJ, Li T (2009) Seasonally evolving dominant interannual variability modes of east asian climate. J Climate 22(11):2992–3005. https://doi.org/10.1175/2008jcli2710.1
Wu B, Li T, Zhou TJ (2010) Relative contributions of the Indian ocean and local SST anomalies to the maintenance of the Western north pacific anomalous anticyclone during the el nino decaying summer. J Climate 23(11):2974–2986. https://doi.org/10.1175/2010jcli3300.1
Wu G, Duan A, Liu Y, Mao J, Ren R, Bao Q, He B, Liu B, Hu W (2015) Tibetan Plateau climate dynamics: recent research progress and outlook. Natl Sci Rev 2(1):100–116. https://doi.org/10.1093/nsr/nwu045
Wu G, Ma T, Liu Y, Jiang Z (2020) PV‐Q Perspective of Cyclogenesis and Vertical Velocity Development Downstream of the Tibetan Plateau. Journal of Geophysical Research: Atmospheres 125 (16):e2019JD030912. https://doi.org/10.1029/2019jd030912
Wu X, Li G, Jiang W, Long S-M, Lu B (2021) Asymmetric relationship between ENSO and the tropical Indian Ocean summer SST anomalies. J Climate:1–51. https://doi.org/10.1175/jcli-d-20-0546.1
Xie SP, Hu KM, Hafner J, Tokinaga H, Du Y, Huang G, Sampe T (2009) Indian ocean capacitor effect on indo-western pacific climate during the summer following El Nino. J Climate 22(3):730–747. https://doi.org/10.1175/2008jcli2544.1
Xie S-P, Kosaka Y, Du Y, Hu K, Chowdary JS, Huang G (2016) Indo-western Pacific ocean capacitor and coherent climate anomalies in post-ENSO summer: a review. Adv Atmos Sci 33(4):411–432. https://doi.org/10.1007/s00376-015-5192-6
Yanai M, Li C, Song Z (1992) Seasonal heating of the Tibetan Plateau and its effects on the evolution of the Asian summer monsoon. J Meteorol Soc Jpn 70(1):319–351
Yang J, Liu Q (2008) The “charge/discharge” roles of the basin-wide mode of the Indian Ocean SST anomaly. Acta Oceanol Sin 30(2):12–19
Ye D, Wu G (1998) The role of the heat source of the Tibetan Plateau in the general circulation. Meteorol Atmos Phys 67:181–198. https://doi.org/10.1007/BF01277509
Zerafati H, Ghavidel Y, Farajzadeh M (2021) Historical reconstruction and statistical survey on long-term temporal changes in temperatures above 50° C in West Asia. Arabian Journal of Geosciences 14 (21). doi:https://doi.org/10.1007/s12517-021-08611-0
Zhang M, Jin D, Wang X, Chen L, Luo J, Wang Z (2022) Seasonal transition of precedent Indian Ocean basin mode and subsequent Indian Ocean Dipole without El Niño-Southern Oscillation impact. Int J Climatol. https://doi.org/10.1002/joc.7793
Zhou TJ, Gong DY, Li J, Li B (2009a) Detecting and understanding the multi-decadal variability of the East Asian Summer Monsoon - Recent progress and state of affairs. Meteorol Z 18(4):455–467. https://doi.org/10.1127/0941-2948/2009/0396
Zhou TJ, Yu RC, Zhang J, Drange H, Cassou C, Deser C, Hodson DLR, Sanchez-Gomez E, Li J, Keenlyside N, Xin XG, Okumura Y (2009b) Why the Western Pacific Subtropical High Has Extended Westward since the Late 1970s. J Climate 22(8):2199–2215. https://doi.org/10.1175/2008jcli2527.1
Zhou Z-Q, Xie S-P, Zhang R (2021) Historic Yangtze flooding of 2020 tied to extreme Indian Ocean conditions. Proceedings of the National Academy of Sciences 118 (12):e2022255118. doi:https://doi.org/10.1073/pnas.2022255118
Acknowledgements
We wish to acknowledge Flaticon.com for supplying carton materials which helped us to create the schematic in Fig. 11.
Funding
This work was supported by National Natural Science Foundation of China (42175024, 41875081) and the Second Tibetan Plateau Scientific Expedition and Research Program (2019QZKK0102).
Author information
Authors and Affiliations
Contributions
CH performed the analysis and wrote the manuscript. TZ and XC helped to draw the schematic in Fig. 11. All authors reviewed and improved the manuscript.
Corresponding author
Ethics declarations
Conflict of interest
The authors declare no conflicts of interest or competing interests.
Additional information
Publisher's Note
Springer Nature remains neutral with regard to jurisdictional claims in published maps and institutional affiliations.
Rights and permissions
Open Access This article is licensed under a Creative Commons Attribution 4.0 International License, which permits use, sharing, adaptation, distribution and reproduction in any medium or format, as long as you give appropriate credit to the original author(s) and the source, provide a link to the Creative Commons licence, and indicate if changes were made. The images or other third party material in this article are included in the article's Creative Commons licence, unless indicated otherwise in a credit line to the material. If material is not included in the article's Creative Commons licence and your intended use is not permitted by statutory regulation or exceeds the permitted use, you will need to obtain permission directly from the copyright holder. To view a copy of this licence, visit http://creativecommons.org/licenses/by/4.0/.
About this article

Cite this article
He, C., Zhou, T., Zhang, L. et al. Extremely hot East Asia and flooding western South Asia in the summer of 2022 tied to reversed flow over Tibetan Plateau. Clim Dyn 61, 2103–2119 (2023). https://doi.org/10.1007/s00382-023-06669-y
Received:
Accepted:
Published:
Issue Date:
DOI: https://doi.org/10.1007/s00382-023-06669-y