
Abstract
The energy budgets over land and oceans are still afflicted with considerable uncertainties, despite their key importance for terrestrial and maritime climates. We evaluate these budgets as represented in 43 CMIP5 climate models with direct observations from both surface and space and identify substantial biases, particularly in the surface fluxes of downward solar and thermal radiation. These flux biases in the various models are then linearly related to their respective land and ocean means to infer best estimates for present day downward solar and thermal radiation over land and oceans. Over land, where most direct observations are available to constrain the surface fluxes, we obtain 184 and 306 Wm−2 for solar and thermal downward radiation, respectively. Over oceans, with weaker observational constraints, corresponding estimates are around 185 and 356 Wm−2. Considering additionally surface albedo and emissivity, we infer a surface absorbed solar and net thermal radiation of 136 and −66 Wm−2 over land, and 170 and −53 Wm−2 over oceans, respectively. The surface net radiation is thus estimated at 70 Wm−2 over land and 117 Wm−2 over oceans, which may impose additional constraints on the poorly known sensible/latent heat flux magnitudes, estimated here near 32/38 Wm−2 over land, and 16/100 Wm−2 over oceans. Estimated uncertainties are on the order of 10 and 5 Wm−2 for most surface and TOA fluxes, respectively. By combining these surface budgets with satellite-determined TOA budgets we quantify the atmospheric energy budgets as residuals (including ocean to land transports), and revisit the global mean energy balance.
1 Introduction
The energy balance of the Earth is a fundamental determinant of the climatic conditions on our planet. Thanks to impressive progress in space-based observation systems in the past decade, we now know the exchanges of radiative energy flows between our planet and surrounding space with unprecedented accuracy. This has enabled detailed assessments of the radiation budgets at the top of atmosphere (TOA) in climate models (e.g., Potter and Cess 2004; Trenberth and Fasullo 2010; Wang and Su 2013; Dolinar et al. 2014). However, the distribution of the radiative energy within the climate system has not been established with the same accuracy, since it cannot be directly measured from satellites. Accordingly, estimates on the magnitude of the energy balance components at the surface and within the atmosphere as presented in the literature largely vary even on a global annual mean basis (e.g., Budyko 1956; Hartmann et al. 1986; Ramanathan 1987; Ohmura and Gilgen 1993; Kiehl and Trenberth 1997; Wild et al. 1998; Hatzianastassiou et al. 2005; Trenberth et al. 2009; Stephens et al. 2012; Stevens and Schwartz 2012; Wild et al. 2013a; Trenberth and Fasullo 2012). Also the surface radiation budgets as represented in climate models thus traditionally largely differ (e.g., Wild et al. 1995b, 2013a; Wild 2008; Stephens et al. 2012; Li et al. 2013).
Recently, progress has been made to better constrain these budgets not only at the TOA, but also at the surface, taking into account latest modeling efforts and surface observations on the one hand (Wild et al. 2013a) as well as improved satellite retrievals from both passive and active sensors on the other hand (Kato et al. 2013). Here we expand the study of Wild et al. (2013a) to further decompose the global mean energy balance estimates as shown in Fig. 1 into their land and ocean domains. This is illustrated in a schematic form in Fig. 2, which summarizes some of the findings of this study. Knowledge of the energy balance over oceans is critical, for example, for the coupling of 3 dimensional dynamical models of the ocean and the atmosphere, and the related exchange of energy and water at the ocean–atmosphere interface. Accurate knowledge of the surface energy fluxes at the atmosphere/ocean interface is also critical for the determination of the ocean heat budget and transports of heat in the ocean (Trenberth and Caron 2001; Trenberth and Fasullo 2008). The energy balance over land is of eminent importance for the representation of land surface processes in Earth system models and the determination of climate and ecology of the immediate human environments (e.g., Seneviratne et al. 2010). The considerable uncertainties and lack of agreed-upon reference values particularly of the surface flux components of the land and ocean energy balances have traditionally hampered the coupling of land surface and ocean models to the atmospheric component. In the present study we try to use the information contained in direct observations to pose additional constraints on these budgets over land and oceans.
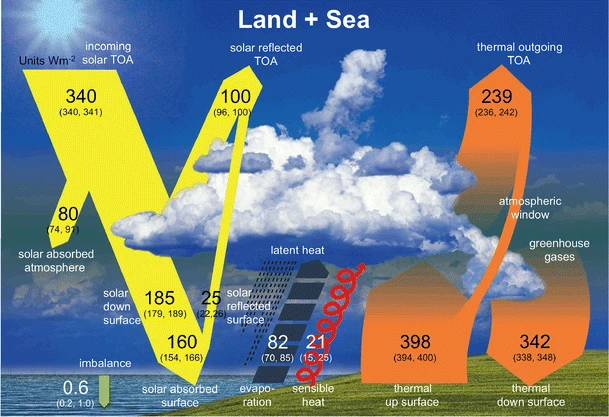
Schematic diagram of the global (land and ocean) annual mean energy balance of the Earth. Numbers indicate best estimates for the magnitudes of the globally averaged energy balance components together with their uncertainty ranges in parentheses, representing present day climate conditions at the beginning of the twenty-first century. The surface thermal upward flux contains both the surface thermal emission and a small contribution from the reflected part of the downward thermal radiation. Units Wm−2. Adapted from Wild et al. (2013a, b) with slight modifications as discussed in Sect. 5
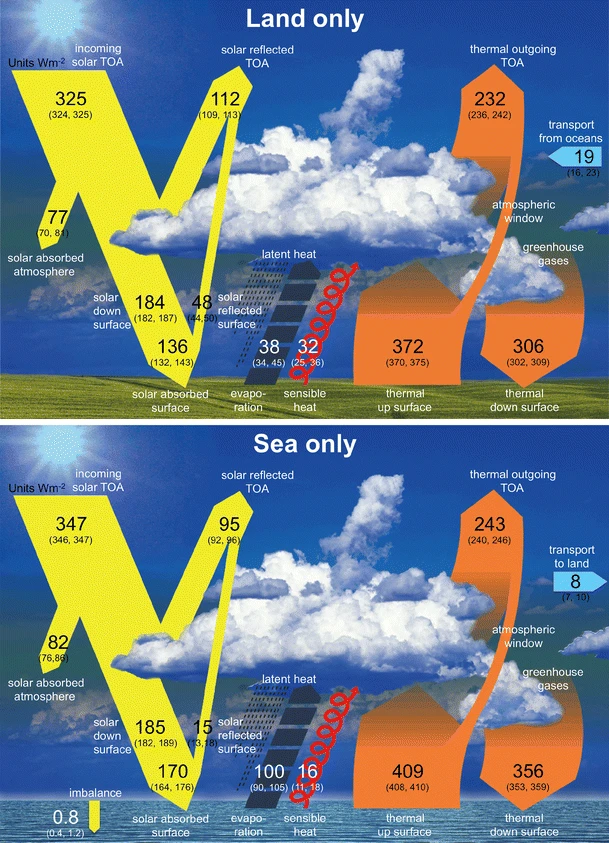
Best estimates for the magnitude of the annual mean energy balance components averaged over land (upper panel) and oceans (lower panel), together with their uncertainty ranges, representing climatic conditions at the beginning of the twenty-first century. The surface thermal upward flux contains both the surface thermal emission and a small contribution from the reflected part of the downward thermal radiation. Units Wm−2
As in Wild et al. (2013a), the approach taken here relies on a combination of direct observations and modeling results performed within the Coupled Model Intercomparison Project Phase 5 (CMIP5) for the latest 5th IPCC assessment report (IPCC-AR5). This goes along with a validation of the land and ocean energy budgets of the comprehensive set of climate models that is now available in the CMIP5 archive. Compared to Wild et al. (2013a) more than twice the number of climate models were available in the CMIP5 archive for the present study.
Emphasis in the present study is placed on the land surface energy balance, which is best constrained by direct surface observations, since the vast majority of direct flux measurements are taken over land surfaces. In addition and for completeness, an attempt is made to derive estimates for the energy balance components averaged over oceans, which are consistent with the land mean energy balance derived here and the global mean energy balance derived in Wild et al. (2013a), as well as with the limited information from direct observations taken in maritime environments. We further discuss our estimates in light of other recent land and ocean-separated estimates relying on independent approaches based on reanalyses and satellite products, to assess the consistency and robustness of these recent independent estimates. Finally, we recompose the global mean energy balance by combining the land and ocean mean energy balances derived here, to check its consistency with our previously published global estimates (Wild et al. 2013a, b).
Section 2 describes the observational data and climate models used in this study. Section 3 discusses the energy balance over land as simulated in the CMIP5 models, and infers best estimates for its components. Section 4 focuses on the energy balance over oceans. Section 5 reassembles the global mean energy balance from the land and ocean mean energy balances. Section 6 summarizes the main findings of this study.
2 Observational data and models
As in Wild et al. (2013a), the observational reference values for the radiative fluxes at the TOA are taken from the spaceborne Clouds and the Earth’s Radiant Energy System (CERES, Wielicki et al. 1996), but now separated into fluxes over land and oceans. CERES measures filtered radiances in the solar (between 0.3 and 5 μm), total (0.3 and 200 μm), and window (8 and 12 μm) regions on board of the NASA satellites Terra and Aqua, with thermal radiances determined as differences between total and solar channel radiances. The uncertainty in the solar reflected TOA fluxes from CERES due to uncertainty in absolute calibration is ~2 % (2 − σ), or equivalently 2 Wm−2. The uncertainty of the outgoing thermal flux at the TOA as measured by CERES due to calibration is ~3.7 W m−2 (2 − σ) (Loeb et al. 2009). In the CERES energy balanced and filled (EBAF) dataset, solar and thermal TOA fluxes are adjusted within their range of uncertainty to be consistent with independent estimates of the global heating rate based upon in situ ocean observations, and are made available on a 1° grid (Loeb et al. 2009). We calculated global land and ocean averages of the TOA radiative flux components from CERES EBAF for the periods 2001–2005 and 2001–2010, based on version EBAF 2.7 (Loeb et al. 2012), using a 10′ land-sea mask provided by CERES. We include in the global land budget Greenland and Antarctica as well as the ice shelves, whereas sea ice and inland seas are considered in the ocean budgets. This applies for all variables and results discussed in this study.
The land and ocean mean TOA reference fluxes determined this way for the period 2001–2005 are found to be within a few tenths of a W/m−2 as compared to the same quantities averaged over the period 2000–2010, the entire period now available from CERES EBAF (c.f. also Trenberth et al. 2014). Thus the exact length of the CERES EBAF record is not very critical for the present purpose of determining climatological land and ocean mean budgets. In sensitivity tests with different available land sea masks, we noted that differences up to 1 Wm−2 in the land and ocean averaged TOA insolation can emerge depending on whether floating ice shelve areas (predominantly in Antarctica) are considered as land or ocean. We define them here as land areas. Differences in the definition of fractional land/sea boxes along coastlines were found to cause differences of no more than a few tenth of a W/m−2 at the maximum in the land and ocean mean TOA insolation, whereas adding or dismissing interior lakes in the land-sea mask has a negligible impact on this quantity.
Observational constraints for surface fluxes primarily stem from two databases for worldwide measurements of radiative fluxes at the Earth surface, the global energy balance archive (GEBA, Gilgen et al. 1998; Ohmura et al. 1989) and the database of the Baseline Surface Radiation Network (BSRN, Ohmura et al. 1998; König-Langlo et al. 2013). GEBA, maintained at ETH Zurich, is a database for the worldwide measured energy fluxes at the Earth’s surface and currently contains 2500 stations with 450‘000 monthly mean values of various surface energy balance components. By far the most widely measured quantity is the solar radiation incident at the Earth’s surface, with many of the records extending back to the 1950s, 1960s or 1970s. This quantity is also known as global radiation, and is referred to here as downward solar radiation. Gilgen et al. (1998) estimated the relative random error (root mean square error/mean) of the downward solar radiation values at 5 % for the monthly means and 2 % for yearly means.
BSRN became operational in the early 1990s and provides radiation measurements with the highest available accuracy and high temporal resolution of 1 min at a limited number of sites in various climate zones. To date 54 anchor sites exposed to different climate regimes report their data to the BSRN Archive at the Alfred Wegener Institute (AWI) (http://www.bsrn.awi.de/). The accuracy of the BSRN solar and thermal radiation measurements used in this study is discussed in detail in Wild et al. (2013a).
At oceans surfaces, downward solar and thermal radiation is increasingly recorded from measurements on buoys with sensors that compose the Improved Meteorological (IMET) system (Colbo and Weller 2009). The quality of these unmanned sites is, however, not at the level of the BSRN measurements. Records are typically still fairly short, covering a few years only. For downward solar radiation, 48 buoys provide data that enable the determination of at least one monthly mean for each month of the year, thus allowing for the calculation of annual means from complete annual cycles and excluding the risk of spurious biases due to incomplete seasonal cycles. Out of these 48 buoys, 17 buoys stem from the Prediction and Research Moored Array in the Tropical Atlantic (PIRATA) (Bourles et al. 2008), 18 buoys from the Tropical Atmosphere Ocean/Triangle Trans-Ocean Buoy Network (TAO/TRITON) in the Tropical Pacific (McPhaden et al. 1998), 10 buoys from the Research Moored Array for African–Asian–Australian Monsoon Analysis and Prediction (RAMA) in the Indian Ocean (McPhaden et al. 2009), and three buoys from the Woods Hole Oceanographic Institution, located in the Northwest Tropical Atlantic (15°N, 51°W), East Tropical Pacific (20°S, 85°W, off northern Chile) and north of Hawaii, respectively (Colbo and Weller 2009). We further excluded 5 buoys from the PIRATA network, whose measurements were shown to be biased low due to the contamination of the domes of the radiometers with dust (Foltz et al. 2013), leaving a total of 43 buoy sites for the analysis of solar radiation. From the 53 buoys measuring the downward thermal radiation at the above networks, only 17 buoys fulfill the criterion of providing a complete annual cycle. These stem from PIRATA (2 buoys), RAMA (2 buoys), TAO/TRITON (9 buoys), and Woods Hole (3 buoys). The uncertainty of these buoy measurements is estimated at 5–6 Wm−2 for annual mean downward solar and 4 Wm−2 for annual mean thermal radiation (Colbo and Weller 2009).
The geographical distribution of the radiation sites used in this study is shown in Fig. 3. The distribution of sites is widespread and covers all major climate regimes, but gaps remain particularly in remote land areas and over the extratropical oceans.

Location of surface radiation stations used in this study. 760 sites from GEBA (green), 41 sites from BSRN (red) and 43 ocean buoys (blue)
We use data from 43 global climate models (GCMs) from the CMIP5 archive as frozen for the IPCC AR5 in June 2013 in our analysis. This includes all models available in the frozen CMIP5 database, except for the four models CanCM4, EC Earth, FIOESM and GFDL-CM2p1, which did not include the complete set of energy balance components. Thus, we are able to include more than twice the number of models compared to our previous study (Wild et al. 2013a) that was based on 21 CMIP5 models as available in June 2012. The 43 models used in this study are listed in Table 1, together with their host institutions, and their abbreviations as used in this manuscript. The model flux fields analyzed in this study are taken from the “historical” experiments that attempt to reproduce the climate variations of the twentieth century as accurately as possible, and include all major natural and anthropogenic forcings, such as changes in atmospheric greenhouse gases, solar output, aerosol loadings (tropospheric and volcanic) and land use. The “historical” experiments start around 1860 and are carried out up to at least to 2005. After 2000, CMIP5 models tend to slightly underestimate the stratospheric aerosol optical depth compared to satellite observations (Neely et al. 2013; Santer et al. 2014). A number of institutions provide several realizations of this experiment with differing initial conditions (ensemble simulations). However, we found that the choice of the ensemble member does not critically affect our results, since the relevant differences amongst the ensemble members are typically an order of magnitude smaller than the detected biases against observations in the specific analyses carried out in this study. Therefore, and also to avoid an overrating of a specific model, we include only one ensemble member from those models with several ensemble realizations.
The GCM radiation budgets representing the conditions at the beginning of the twenty-first century are determined as averages over the five-year period 2000–2004, which state the final five complete years of the historical experiments available from all investigated models. The slight shift in period by 1 year compared to the CERES radiation budgets (2001–2005, see above) is irrelevant for the comparisons since the GCMs are not deterministic by nature, and both ocean and land mean budgets are insensitive to the exact choice of the period as outlined above. Specifically, a shift in the CMIP5 radiation budget climatologies by 1 year typically introduces differences in the tenth of a Wm−2 range only, thus negligible for the accuracy level considered in this study. Similar to the CERES EBAF land and ocean mean budgets, the CMIP5 budgets are calculated using the land-sea masks of the individual GCMs and the Climate Data Operators (CDO) software package (https://code.zmaw.de/projects/cdo).
3 Energy balance over land
3.1 Assessment of land radiation budgets in CMIP5 models
3.1.1 Solar radiation
The global distributions of the solar radiation budgets at the TOA, within the atmosphere and at the surface as simulated by the 43 CMIP5 models over the years 2000–2004 in the historical “all forcings” experiment (Sect. 2) are presented in Fig. 4. Displayed are multimodel annual mean climatologies (left column) as well as the local spreads between the individual model climatologies in terms of their absolute and relative standard deviations (center and right column). The solar radiation budgets averaged over global land surfaces as determined by the individual models are presented in Fig. 5. The statistics of the model-calculated land mean budgets in Fig. 5 are summarized in Table 2 in terms of their multimodel-mean, range of values covered by the 43 models, and the standard deviation of these values. It is evident that the models vary substantially in their absorbed solar radiation over land in the total (surface + atmosphere) system, as well as within the atmosphere and at the surface, covering a range of more than 20 and 30 Wm−2 for the land mean total (solar net TOA) and surface absorption, respectively (Table 2). Considering the lower absolute amount of atmospheric and surface absorption compared to total (TOA) absorption, this suggests that the relative (percentage) differences between the model estimates increases from the TOA to the surface, i.e. the land mean model estimates vary for the TOA absorption in a range of 10 % of their absolute amounts, and for the surface absorption in a range of 23 % of their absolute amounts. This is largely a consequence of the model tuning towards the available observational constraints for the TOA budgets from satellites, while the surface budgets are not directly measurable from space and thus are usually not considered in the tuning process. Models are typically tuned within their cloud schemes to match their simulated TOA fluxes with reference values on a global mean basis as can be obtained with highest accuracy from the CERES EBAF satellite dataset (Sect. 2). From this dataset we determined a mean total absorption of solar radiation in the climate system above land surfaces (Solar net TOA land) of 213.3 Wm−2 (Table 3) (average over the period 2001–2005, c.f. Sect. 2). This is within 2 Wm−2 of the CMIP5 multimodel land mean of 211.4 Wm−2 (Table 2). Thus, although the individual CMIP5 models deviate in their solar TOA budgets averaged over land by up to 14 Wm−2 from the CERES reference value of 213 Wm−2 (Fig. 5) with a corresponding standard deviation of 6.1 Wm−2, the multi-model mean bias is, at 1.9 Wm−2, not substantial (Tables 2, 3). On more regional scales, discrepancies between the different models increase, as shown in Fig. 4b, c and also noted by Trenberth and Fasullo (2010) using the models from the preceding Coupled Model Intercomparison Project Phase 3 (CMIP3).

Geographical distribution of annual multimodel mean climatologies from 43 CMIP5 models, as well as absolute and relative standard deviations of their climatological annual fields, for the following variables: net solar absorption in the climate system (a, b, c), atmospheric solar absorption (d, e, f), surface solar absorption (g, h, j) and surface downward solar radiation (j, k, l). Climatological fields calculated for the period 2000–2004. Relative standard deviations defined as ratio between fields of absolute standard deviation and multimodel mean. Units Wm−2 for fields of multimodel mean and absolute standard deviation, dimensionless units for fields of relative standard deviations

Annual mean solar radiation budgets over terrestrial surfaces calculated by 43 CMIP5/IPCC AR5 models for present day climate (baseline 2000–2004). Solar radiation absorbed at the surface (lower panel), within the atmosphere (middle panel), and in the total climate system (TOA, uppermost panel). Units Wm−2
Unlike for the TOA mean radiation budgets, so far there have been no corresponding generally accepted observational references for the surface mean radiation budgets, which could serve as model tuning targets. Accordingly the surface budgets vary greatly between the various CMIP5 models. Discrepancies over land become even larger when the downward rather than the absorbed solar radiation is considered (Fig. 6, upper panel). Downward solar radiation incident on land surfaces varies in a range of more than 40 Wm−2 amongst the CMIP5 models, from 169 to 210 Wm−2, with a standard deviation of almost 10 Wm−2. This is the component with the largest spread within the CMIP5 models amongst all land and ocean mean energy balance components (c.f. Table 2). The spread in terms of standard deviations further increases when proceeding to more local (gridpoint) levels (Fig. 4k, l).

Annual mean downward solar (upper panel) and thermal (lower panel) radiation over terrestrial surfaces under present day climate (baseline 2000–2004) calculated by 43 CMIP5/IPCC AR5 models as listed in Table 2. Units Wm−2
This unsatisfactorily large spread causes considerable discrepancies in various aspects of the model-simulated land surface climates, as the downward solar radiation constitutes a key energy input for a variety of land surfaces processes. Since this component is directly measured by the land-based radiation networks, we make use of the information contained in these records to better constrain this spread. For this purpose, we extract datasets from both GEBA and BSRN. From GEBA we use 760 observation sites with multiyear records of downward solar radiation, that allow the formation of site-representative climatologies. We previously used this station-based dataset in analyses of earlier model generations, namely the models used in the Atmospheric Model Intercomparison Project (AMIP, Wild 2005), the CMIP3 models (Wild 2008) and a subset of the models of CMIP5 used here (Wild et al. 2013a). As in our previous studies, for comparison of the gridded flux fields with point observations, the 4 surrounding grid points weighted by their inverse spherical distance were taken into account (Wild et al. 1995b). Hakuba et al. (2013) estimated the random error caused by the comparison of the simulated solar flux of a typical 1° GCM grid box with a point observation to be on the order of 3 Wm−2 on a climatological timescale, which is attributed to the subgrid-scale variability not resolved by the GCM grid. The average bias for each model at the 760 sites is shown in Fig. 7 and in Table 4. Further documented in Table 4 are Root Mean Square (RMS) differences for the individual models (corresponding for each model to the combined effect of its average climatological mean bias and the standard deviation of its climatological mean biases at the individual sites). Most models show a RMS in the range of 20–30 Wm−2, with a multimodel mean and median RMS near 22 Wm−2. The vast majority of the GCMs (38 out of the 43 models) overestimate the downward solar radiation when averaged over the 760 sites. The multimodel mean overestimation amounts to 7.4 Wm−2 and the median overestimation is 6.5 Wm−2 (Table 4). If we further group the GEBA sites into 5° latitude bands and apply a latitudinal area weighting of the zonally-averaged biases (Wild 2008), the overall biases of the individual models are mostly similar, and multimodel mean and median biases amount to 8.1 and 7.2 Wm−2, respectively, thus within 1 Wm−2 of the simple unweighted average over the 760 sites given above at 7.4 Wm−2 (mean) and 6.5 Wm−2 (median).

Average biases (model—observations) in downward solar radiation at Earth’s surface calculated in 43 CMIP5 models at 760 sites from GEBA. Units Wm−2
Alternatively, we can compare the surface downward solar radiation of the 43 models against 38 sites from the BSRN network as used in Wild et al. (2013a). These sites can provide climatologies of surface downward solar radiation determined as the sum of the direct and diffuse radiation, measured with a pyrheliometer and a shaded pyranometer, respectively. This is considered a more accurate measurement method for surface downward solar radiation than the more simple total flux measurement with a pyranometer as typically used at the GEBA sites (Ohmura et al. 1998). Climatological RMS differences at the BSRN sites for the individual models are also given in Table 4 and range from 12 to 30 Wm−2. They are typically smaller than at the GEBA sites (on average by 5 Wm−2), indicative of higher quality data and more representative locations. However, the mean biases averaged over the 38 sites are for most models very similar to their biases against the 760 GEBA sites (Fig. 8; Table 4). Surface downward solar radiation is overestimated at the BSRN sites in the multi-model mean by 6.0 Wm−2 (median 6.1 Wm−2), which is close to the aforementioned bias at the GEBA sites (7.4 Wm−2 mean, 6.5 Wm−2 median). Thus, the overall biases appear robust with respect to the choice of the observational references, confirming findings based on fewer climate models in Wild et al. (2013a).

As Fig. 6, but biases determined as average over 38 sites from BSRN
The overestimation of solar radiation incident at the Earth’s surface is a long-standing issue in climate modeling, and is still present in many of the CMIP5 models (see e.g. Wild 2008 for a review and discussion of possible causes).
3.1.2 Thermal radiation
Figure 9 shows the global distributions of the outgoing thermal radiation at the TOA, net thermal radiation in the atmosphere, and net and downward thermal radiation at the surface as simulated by the 43 CMIP5 models over the years 2000–2004 in the historical “all forcings” experiment (c.f., Sect. 2). Displayed are again multimodel annual mean climatologies (left column) as well as the local spreads between the individual model climatologies in terms of their absolute and relative standard deviations (center and right column). Figure 6 (lower panel) and Fig. 10 show the corresponding thermal radiation budgets averaged over global land surfaces as calculated by the individual models, and the statistical summary is given in Table 2. Similar to the solar budgets, the thermal land mean budgets vary considerably amongst the models. Model estimates for the land mean outgoing thermal radiation at the TOA vary in a range of 13 Wm−2. This roughly doubles when the net thermal radiation at the surface (26 Wm−2) and in the atmosphere (29 Wm−2) are considered (Table 2). The higher consistency at the TOA compared to the surface is again largely a consequence of the tuning of the models, which aims to match the simulated TOA outgoing thermal radiation with the one observed from satellites. From the CERES EBAF satellite dataset (Sect. 2) we determined a reference outgoing thermal radiation at the TOA over land of 232.4 Wm−2 for the period 2001–2005 (232.2 Wm−2 for the period 2001– 2010, with a standard deviation of 0.47 Wm−2 in the annual values) (Table 3). This observed value differs from the CMIP5 multimodel mean of 231.2 Wm−2 (Table 2) by no more than about 1 Wm−2. Thus, as with the land mean solar radiation at the TOA, its thermal counterpart shows overall no systematic bias in the CMIP5 multimodel mean when compared to the best available observational estimates. The spread amongst the models on more regional scales is, however, evident, particularly in low latitude areas, where the standard deviations between the outgoing thermal radiation climatologies exceed 10 Wm−2 (Fig. 9b).

Geographical distribution of annual multimodel mean climatologies from 43 CMIP5 models, as well as absolute and relative standard deviations of their climatological annual fields, for the following variables: outgoing thermal radiation (a, b, c), atmospheric net thermal radiation (d, e, f), surface net thermal radiation (g, h, j) and surface downward thermal radiation (j, k, l). Climatological fields calculated for the period 2000–2004. Relative standard deviations defined as ratio between fields of absolute standard deviation and multimodel mean. Units Wm−2 for fields of multimodel mean and absolute standard deviation, dimensionless units for fields of relative standard deviations

Annual mean thermal radiation budgets over terrestrial surfaces calculated by 43 CMIP5/IPCC AR5 models for present day climate (baseline 2000–2004). Net thermal radiation at the surface (lower panel), within the atmosphere (middle panel), and emitted to space (uppermost panel). Units Wm−2
As noted above, the discrepancy between the model-calculated land mean thermal fluxes becomes larger at the surface. This is particularly evident in the land mean downward thermal radiation shown in Fig. 6 (lower panel) that varies in a range of as much as 33 Wm−2, from 281 to 314 Wm−2, with a standard deviation of 7.2 Wm−2. From all land and ocean averaged thermal components as given in Table 2, this is thus the flux component with the largest spread among the climate models. This spread in downward thermal radiation also further enlarges on more regional scales (Fig. 9k). At the same time the downward thermal radiation is also the quantity that we can directly compare with surface observations. Here we use 41 sites from BSRN that have extended records of downward thermal radiation. As in previous studies we accounted for possible differences in the altitudes of the observation sites and the collocated model topography, using a height correction of 2.8 Wm−2/100 m (Wild et al. 1995a). The RMS of the various models with respect to the 41 sites varies between 6 and 20 Wm−2 (Table 4), and is generally smaller than the corresponding RMS in the downward solar fluxes. Mean model biases of the various models at the 41 sites are illustrated in Fig. 11. Out of the 43 models, the majority of the GCMs, namely 33 models (77 %), show a negative bias, while 10 models (23 %) show positive biases. Interestingly, 8 models display a mean bias at the 41 observation sites of less than 1 Wm−2. The multimodel mean bias of the 43 models is negative with an underestimation of −3.0 Wm−2 (c.f. Table 4). The underestimation of the downward thermal radiation in climate models has also been a long-standing issue in GCM surface radiation budgets and partly induced by uncertainties in the formulation of the water vapor continuum (Iacono et al. 2000; Wild et al. 2001). However, considerable progress in reducing these biases over time is evident, with some of the models now showing negligible overall biases as noted above and pointed out in Ma et al. (2014).

Average bias in downward thermal radiation calculated in 43 CMIP5 models at 41 sites from BSRN (model—observations). Units Wm−2
3.2 Best estimates for the downward solar and thermal radiation at land surfaces
To obtain best estimates of land mean surface downward solar and thermal radiation we use the approach introduced in Wild et al. (2013a). In this approach we related the biases in downward solar and thermal radiation of 21 CMIP5 models at the surface sites to their respective global mean values. Here we adjust this approach, as we compare the model biases of 43 CMIP5 model no longer against their global means, but rather their land means. This is done in Figs. 12 and 13 for the land mean downward solar radiation. Thus, in Fig. 12, each cross signifies a CMIP5 model, with its mean bias in downward solar radiation compared to the 760 surface sites from GEBA (as given in Fig. 7) on the horizontal axis, and its respective land mean value (given in Fig. 6, upper panel) on the vertical axis. Generally, the higher the land mean value of a model, the stronger is also its overestimation relative to the observations from the GEBA sites. The correlation coefficient is almost 0.9. This is somewhat larger than the correlation coefficient of 0.8 derived in Wild et al. (2013a) where the global mean values rather than the land mean values were correlated with the model biases. The higher correlation with the land mean values is not unexpected as the density of the reference stations is highest over land. We apply a linear regression between the model biases and their respective land means shown in Fig. 12 (significant at the 95 % level). We use the orthogonal regression method that minimizes the distances orthogonal to the regression line, in contrast to the standard least y-squares regression that only minimizes the distances along the vertical axes. In this way the uncertainties in both x and y directions are accounted for. A best estimate for the land mean downward solar radiation is then deduced from the linear regression at the intersection where the bias with respect to the surface observations becomes zero, as indicated by the dotted lines in Fig. 12. This results in a best estimate for the land mean downward solar radiation at Earth’s surface of 183.7 (±1.8) Wm−2 The value in brackets gives the 2σ confidence interval for the line intercept resulting from the regression analysis.

Land mean surface downward solar radiation of 43 CMIP5/IPCC AR5 models versus their respective biases compared to an average over 760 GEBA surface sites. Each cross represents one individual model with its land mean solar radiation on the vertical axis and its solar radiation bias against surface observations on the horizontal axis. A “best estimate” for the land mean downward solar radiation is inferred at the intersection between the orthogonal linear regression line and the zero bias line (dotted lines). Units Wm−2

As Fig. 10, but compared to an average over 38 BSRN surface sites
Similar to the global mean estimates in Wild et al. (2013a), we also tested the robustness of this land mean estimate, by repeating the analyses using the 38 worldwide distributed BSRN sites instead of the 760 GEBA sites as observational references (Fig. 13). The correlation between the model biases, now determined at the 38 BSRN sites (as given in Fig. 8), and their respective land mean values of downward solar radiation (as given in Fig. 6, upper panel) is again high, at 0.9. The slope of the corresponding linear regression in Fig. 13 deviates slightly more from one than the respective slope when using the 760 GEBA sites, indicative of the lower spatial sampling with the BSRN sites. Still, the best estimate deduced from the linear regression in Fig. 13 using the 38 BSRN sites as reference is very similar to the one obtained with the GEBA sites as references in Fig. 12. With the BSRN sites as reference, the best estimate for the land mean downward solar radiation amounts to 184.0 (±1.6) Wm−2 (2σ uncertainty given in the parentheses), closely matching the 183.7 (±1.8) Wm−2 inferred above based on the GEBA sites. The close agreement, despite entirely different and independent surface reference networks, suggests that the best estimate inferred in this way is fairly robust.
As a conservative uncertainty range for this estimate, we expand the 2σ regression uncertainty range to cover all land mean values calculated by those GCMs which show only marginal biases compared to the surface stations, in line with the conceptual approach applied here that infers land mean estimates from GCMs which show no biases. Land mean estimates from models with no obvious biases against the surface sites strictly cannot be disqualified as being biased in this approach. Thus, in Figs. 12 and 13 we note also land mean downward solar radiation values of 182 and 187 Wm−2 (rounded) which stem from GCMs with marginal biases (defined here as smaller than 1 Wm−2) and thus should be included in the uncertainty range. With this definition, the uncertainty range for the land mean downward solar radiation, encompassing all GCM land mean values as defined above, extends from 182 to 187 Wm−2.
Interestingly, the above estimate for the land mean downward solar radiation around 184 Wm−2 is also nearly identical to the land mean estimate given in Trenberth et al. (2009) of 184.7 Wm−2 derived independently using the International Satellite Cloud Climatology Project (ISCCP FD) surface flux dataset with an adjustment for underestimated water vapor absorption (Kim and Ramanathan 2008), thereby not taking into account in any way the surface observations (Table 3). From the satellite-based surface flux dataset “Surface EBAF Ed2.7” (Kato et al. 2013) we calculated a slightly higher land mean surface downward solar radiation of 186.5 Wm−2 (Table 3), which is within the uncertainty range derived above. This product determines surface irradiances using observational constraints given by the TOA irradiances from CERES, and again, is independently derived from the approach taken here. Compared to Kato et al. (2011), a better treatment of the diurnal cycle in adjusting surface shortwave irradiance significantly reduced the downward solar radiation in this product (Kato et al. 2013; Rutan et al. 2014), which improves the agreement with the present study and Trenberth et al. (2009). ERA-Interim, yet another independent approach based on reanalysis, determines a slightly higher land mean downward solar radiation, at 187.2 Wm−2 (Table 3; Berrisford et al. 2011). The similar estimates obtained by these independent approaches, covering a range of only 3 Wm−2, gives additional confidence that we have now a better handle on the magnitude of the land mean downward solar radiation.
It is further interesting to note that the estimate for land mean downward solar radiation derived here matches its global mean estimate of 184.6 Wm−2 derived in Wild et al. (2013a) to within 1 Wm−2. The close agreement between global and land mean downward solar radiation does not only emerge from the present analysis, but we note this concurrence also in other estimates of the global and land mean energy balance. From Trenberth et al. (2009) we take that their estimates for the global and land mean downward solar radiation, at 184.3 and 184.7 Wm−2, respectively, differ by only 0.4 Wm−2. From the same study we take that also the ISCCP-FD satellite derived land mean surface downward solar radiation differs only by 0.6 Wm−2 from its global mean value. Further, the above-mentioned land mean estimate of 186.5 Wm−2, which we determined from the Surface EBAF Ed2.7 (Kato et al. 2013) differs by only 0.1 Wm−2 from the respective global mean estimate. In terms of reanalyses, we find in Berrisford et al. (2011) that also the ERA-Interim and the ERA-40 show differences of only 0.9 and 1.1 Wm−2 between their global and land mean estimates, respectively. The close similarity between the global and land mean estimates across various independent observation-based estimates gives some trust in the robustness of this finding. It also has implications for the ocean budget discussed in Sect. 4, as the above notion implies a close agreement between land and ocean mean surface downward solar radiation. In the CMIP5 climate models, global and land mean downward solar radiation differ in the multimodel mean by 2.8 Wm−2 (Table 2).
As above for the solar radiation, we further determine a best estimate for the land mean downward thermal radiation. Thus, in Fig. 14, land mean values of downward thermal radiation as calculated in 43 CMIP5 models are displayed as function of their biases averaged over 41 BSRN sites. A significant linear regression appears again between the model biases and their land mean values, with a high correlation of nearly 0.9, similar to the solar radiation above. There is an obvious tendency that the more a model underestimates the downward thermal radiation at the BSRN sites, the lower is also its land mean value. The zero model bias corresponds to a best estimate for a land mean downward thermal radiation of 305.7 (±1.2) Wm−2 (2σ uncertainty). Also this land mean estimate is robust with respect to a differing surface-based reference dataset of downward thermal radiation, consisting of 26 sites from GEBA and 19 sites from BSRN, which has also been used to test the robustness of the respective global mean estimate in Wild et al. (2013a).

Land mean downward thermal radiation of 43 CMIP5/IPCC AR5 models versus their respective mean biases compared to an average over 41 BSRN sites. A “best estimate” for the global mean downward thermal radiation is inferred at the intersection between the orthogonsl linear regression line and the zero bias line (dotted lines). Units Wm−2
We enlarge also the 2σ regression uncertainty range for this land mean downward thermal radiation estimate, to accept all land mean values from GCMs with marginal (<1 Wm−2) biases. In Fig. 14 land mean values ranging from 302 to 309 Wm−2 fulfill this criterion and form a conservative uncertainty range for this estimate.
The estimate of ERA-Interim is, at 304 Wm−2 (Table 3), very close to the estimate derived here. ERA-Interim includes the Rapid Radiation Transfer Model (RRTM, Mlawer et al. 1997), which was shown to substantially improve the downward thermal fluxes at the surface when included in a climate model (Wild and Roeckner 2006). In addition, reanalyses take into account the possibly best available estimates of atmospheric temperature and humidity profiles at high temporal frequency in their radiative transfer calculations, which further contributes to an accurate determination of the downward thermal radiation. It is interesting to note that also the estimate of Trenberth et al. (2009) (303.6 Wm−2, Table 3), who did not directly determine the magnitude of the downward thermal radiation, but inferred it as a residual of the other surface energy balance components, is close to our best estimate derived here.
3.3 Discussion of the energy balance over land
Figure 2 (upper panel) depicts a schematic representation of the land mean energy balance, which includes the estimates of land-mean downward solar and thermal radiation derived above along with best estimates for the other land energy balance components as discussed in the following.
3.3.1 Radiative components
The most accurate information currently available on the radiative energy exchanges at the TOA over land is compiled in the CERES EBAF Ed2.7 dataset. From this dataset we estimate the TOA land mean downward, upward and net solar radiation at 324.7, −111.4 and 213.3 Wm−2, respectively, and the thermal outgoing radiation at −232.4 Wm−2 (Table 3). All these estimates are averages over the period 2001–2005, with no significant change when averaged over the entire available period 2001–2010. They are displayed in Fig. 2 (upper panel), rounded to integers. Uncertainty ranges for land mean TOA fluxes correspond to those discussed in Wild et al. (2013a) for the global mean fluxes. Note that, in contrast to the global energy balance under equilibrium conditions, in the land energy balance the outgoing thermal radiation is not required to match the absorbed solar radiation at the TOA. Radiative imbalances can be induced by advective exchanges of latent and sensible energy in the atmosphere between the land and ocean domains. According to Table 3 and Fig. 2 (upper panel), the outgoing thermal radiation at the TOA over land is 19 Wm−2 larger than the absorbed solar radiation. This imbalance implies a corresponding net atmospheric energy transport of sensible and latent heat from the ocean to the land surfaces which compensates the net radiative energy loss through the TOA over land surfaces. Comprehensive analyses of the energy transport from ocean to land have been performed by Fasullo and Trenberth (2008a, b) and Trenberth and Fasullo (2013), who identified a strong annual cycle in this quantity, with large energy transport in the northern winter onto land, and small net transport from land to ocean in northern summer. Trenberth and Fasullo (2013) further estimated that latent energy is the dominant component of the annual mean energy transport from ocean to land, i.e. the moisture convergence over land. The required transport of 19 Wm−2 to compensate for the excess thermal emission compared to solar absorption over land according to CERES EBAF is illustrated in Fig. 2 (upper panel), and corresponds, when multiplied with the total land surface area of 149 × 1012 m−2, to a total annual energy transport of 2.8 × 10¹⁵ W (2.8 PW), as also determined by Trenberth and Fasullo (2013). This is somewhat higher than the corresponding transport in the ERA Interim reanalysis of 2.5 PW established by Trenberth and Fasullo (2013). Trenberth and Fasullo (2013) inferred the ocean to land energy transport also from a number of other reanalyses and show that they differ in a range close to 1 PW. We use this range to infer a corresponding uncertainty range of 7 Wm−2 for the transport in Fig. 2 (upper panel). The convergence of latent energy over land corresponds to the latent heat release of the excess precipitation formation compared to evaporation over land, which is transported in form of runoff back to the oceans (Trenberth and Fasullo 2013 and references therein). Thus, a net atmospheric transport of energy from oceans to land can be expected from hydrological considerations. The TOA land mean imbalance in the CMIP5 multimodel mean (19.8 Wm−2) differs by less than 1 W from CERES EBAF (Table 2), suggesting that the models overall adequately reproduce the net energy transport from oceans to land on an annual mean basis.
For the solar radiation incident at the land surface in Fig. 2 (upper panel), we take the best estimate of 184 Wm−2 with uncertainty range as defined and derived in Sect. 3.2. As pointed out in Sect. 3.2 the close agreement of recent estimates based on entirely independent approaches enhances our confidence in this estimate. The magnitude of the downward solar radiation traditionally has been a major source of uncertainty, and still shows the largest discrepancies of all energy balance components in the latest (CMIP5) climate model generation (Table 2; Fig. 6, upper panel, Sect. 3.1).
To obtain an estimate for the land mean absorbed solar radiation at the surface, we need in addition information on the (radiation weighted) land surface albedo. The satellite-derived radiation weighted land mean albedo taken from MODIS (Moderate-resolution Imaging Spectroradiometer) amounts to 0.24 (Zhang et al. 2010). The various validation exercises of this albedo product in the literature indicate that the MODIS albedo might be overall slightly too low on the order of 0.02 (see Discussion in Hakuba et al. (2014) and references therein). From the surface solar upward and downward fluxes in Table 2 we infer that the CMIP5 models calculate a multimodel mean radiation weighted land albedo of 0.264. Similarly, from the surface CERES EBAF Ed2.7 product we obtain a land mean albedo estimate of 0.255 (Table 3). From Berrisford et al. (2011) we deduce an albedo of 0.253 and 0.246 for the ERA-Interim and ERA-40 reanalyses, respectively. For the determination of the surface reflected and absorbed solar radiation in Fig. 2 (upper panel), we use a radiation weighted land mean albedo of 0.26 close to the surface CERES EBAF Ed2.7 product, which is near to the median of the different estimates, and currently considered best suited for large scale surface albedo estimates (Crystal Schaaf, personal communication 2014). This gives a (rounded) land mean surface reflected and absorbed solar radiation of 48 and 136 Wm−2, respectively (Fig. 2 upper panel). Uncertainties introduced by the surface albedo estimates, however, remain. Deducing a range of potentially realistic radiation weighted land mean albedo values between 0.24 and 0.27 from the above discussion results in an uncertainty range of 44–50 Wm−2 for the surface reflected solar radiation, and enlarges the uncertainty range of the absorbed compared to the downward surface solar radiation accordingly (Fig. 2, upper panel).
With an absorbed land-mean solar radiation of 136 Wm−2 at the surface and 213 Wm−2 in the total system (TOA solar net), this leaves 77 Wm−2 of solar radiation absorbed within the atmosphere over land surfaces (Table 3; Fig. 2, upper panel). The CMIP5 multi-model mean is, at 70.3 Wm−2, more than 6 Wm−2 lower than the best estimate inferred here. This suggests that in the majority of the models, the atmosphere over land surfaces is not absorptive enough for solar radiation, a feature common to several generations of GCMs.
For the land mean downward thermal radiation in Fig. 2 (upper panel), we use the value of 306 Wm−2 and the uncertainty range as discussed in Sect. 3.2. The predominant part of the downward thermal radiation is absorbed at the surface. However, since the Earth surface is not a perfect blackbody, with a surface absorptivity/emissivity ε somewhat lower than 1, a small part of the downward thermal radiation is reflected upward, namely (1 − ε) times the downward thermal flux. The Earth surface emits radiation according to the Stefan–Boltzman law at εσT 4skin , with Tskin representing the surface skin temperature, and σ the Stefan–Boltzman constant (5.67 × 10⁻⁸ Wm−2K−4). The total upward thermal flux as shown in Figs. 1 and 2 consists thus of the above-mentioned surface emission plus a small contribution from the reflected part of the downward thermal flux. The upward thermal flux is not overly sensitive to the exact specification of the surface emissivity ε, since compensational changes between reflected downward and surface emitted radiation apply in the upward thermal flux when ε is changed, leading to an only small sensitivity of 0.5 Wm−2 per percent emissivity change (e.g., Kato et al. 2013). Kato et al. (2013) estimated the uncertainty in land surface ε at 3 % based on different datasets, introducing thus an uncertainty of 1.5 Wm−2 in the upward thermal radiation due to the specification of ε alone. For the determination of the land mean surface upward thermal radiation, we consider reanalyses as a useful source. Reanalyses assimilate the observed state of the atmosphere several times per day and determine the fluxes with high temporal frequency to capture also the full diurnal cycle (atmospheric time step of 30 min in the case of ERA-Interim). The assimilation of screen-level temperature observations in the reanalyses further helps to reduce long-term biases in their simulated surface skin temperatures used in the determination of the surface upward thermal radiation (Simmons et al. 2004), although screen and skin temperatures can greatly differ during the course of a day (e.g., Jin and Dickinson 2010). In Berrisford et al. (2011) we note that four different reanalysis products vary in a range of no more than 3 Wm−2 with respect to the land mean surface upward thermal radiation. Specifically, Berrisford et al. (2011) give land mean values for ERA-Interim of 370.6 Wm−2 covering the period 1989–2008, and 371.0 Wm−2 for ERA-40 over the period 1989–2001. Considering an increase of 0.17 Wm−2/year in the land mean surface upward thermal radiation due to global warming (Wild et al. 2008), we apply an upward correction of 1 Wm−2 for the slight shift in the period means between the published ERA values and the early 2000s considered here as reference period. This results in a best estimate of 372 Wm−2 for the land mean surface upward thermal radiation. This value is in between the estimates of 374.4 Wm−2 determined from the surface EBAF Ed2.7 product (Table 3) and the CMIP5 multimodel mean estimate of 370.3 Wm−2 (Table 2), which also define the uncertainty range we attach to this flux in Fig. 2 (upper panel). The land surface temperatures simulated by the CMIP5 models show overall a slight cold bias in the annual mean (Mueller and Seneviratne 2014) which fits to the somewhat lower surface upward thermal radiation in the CMIP5 multimodel mean compared to the above estimates.
Together with the downward thermal radiation of 306 Wm−2 this leaves a best estimate for the land mean net surface thermal radiation (downward minus upward) of −66 Wm−2 (Table 3). Combining this estimate further with the above estimate for the land surface solar absorption of 136 Wm−2 results in a best estimate for the land surface net radiation (also known as land surface radiation balance) of 70 Wm−2. Thus, according to Fig. 2 (upper panel), about 70 Wm−2 of radiative energy is available for the nonradiative components of the terrestrial surface energy balance. The land surface net radiation as calculated in the 43 CMIP5 models is shown in Fig. 15 (upper panel). In their multimodel mean, the CMIP5 models calculate a somewhat higher land surface net radiation of 72.5 Wm−2 (Table 2; Fig. 15, upper panel) than estimated here. This may be due to the overestimated surface solar absorption over land and a slight underestimation of the upward thermal radiation in these models, which is only partly compensated by a slight overall underestimation of their downward thermal radiation (cf. Sect. 3.1). Quantitatively, according to Sect. 3.1, the overestimation in surface solar absorption over land in the multimodel mean amounts to 4–6 Wm−2 (based on the above determined overestimation in the downward solar radiation of 6–8 Wm−2 and a land albedo of 25 %), which is not fully compensated by the underestimation in downward thermal radiation on the order of 3 Wm−2. The excessive downward solar and lack of downward thermal radiation is a long-known phenomenon in the surface energy balance of climate models (e.g., Wild et al. 1995b).

Land mean surface net radiation (upper panel), latent heat flux (middle panel) and sensible heat flux (lower panel) at the Earth surface under present day climate as calculated by 43 CMIP5/IPCC AR5 models. Units Wm−2
3.3.2 Nonradiative components
Most of the radiative energy available at the land surface (70 Wm−2 as estimated above) is used for the terrestrial fluxes of sensible and latent heat. Compared to these fluxes, the additional non-radiative energy balance components, namely ground heat flux and melt, are small (below 1 %) over land on a multiyear average basis (Ohmura 2004). They can be neglected here. The partitioning of the surface net radiation into sensible and latent heat flux over land, largely controlled by the availability of soil water and vegetation characteristics, is afflicted with considerable uncertainties, since very limited reliable observational constraints from surface or spaceborne measurements are available for these fluxes. Accordingly, also the CMIP5 models vary greatly in their calculation of the land mean latent and sensible heat fluxes (Fig. 15, middle and lower panel; Table 2).
Jimenez et al. (2011) estimated the land mean latent heat flux at 45 Wm−2, based on an all-product land mean average of 12 latent heat flux products, including satellite‐based products and estimates from offline land surface models in addition to reanalyses. The spread amongst these estimates amounts to 20 Wm−2. However, their analysis covered only 70 % of the land surfaces, neglecting particularly areas over Greenland and Northern Africa with low latent heat fluxes. Similarly, Mueller et al. (2011) noted in their investigation of a variety of observation-based evaporation datasets as well as climate models from the former CMIP3 model intercomparison project that the land mean latent heat fluxes are scattered around 46 Wm−2 in the various products with a standard deviation of ±5 Wm−2, excluding also Greenland and the Sahara, where latent heat fluxes are generally low. More recently, Mueller et al. (2013) merged 40 datasets of estimated land surface evapotranspiration into different categories (diagnostic datasets, land surface models and reanalyses) and found the merged land mean estimates to vary between 423 mm/year (merged land surface model datasets, corresponding to a latent heat flux of 34 Wm−2) and 563 mm/year (merged reanalysis datasets, corresponding to a latent heat flux of 45 Wm−2). The merging of all available datasets into the LandFlux-EVAL synthesis product gave a land mean evapotranspiration of 493 mm/year, corresponding to a latent heat flux of 40 Wm−2 (Mueller et al. 2013), with a standard deviation of 12 Wm−2. This synthesis product does not include Antarctica. A best estimate of the land mean latent heat flux as defined in the present study (including Antarctica) based on the synthesis product should be therefore slightly below 40 Wm−2. A recent unpublished space-based estimate from the GEWEX LandFlux project uses four different retrieval algorithms for the period 1984–2006 and provides a multimodel mean and standard deviation estimate of 488.4 ± 38.3 mm/year (38.0 ± 3 Wm−2). We adopt this value of 38.0 Wm−2 in Fig. 2 (upper panel), also in line with the LandFlux-EVAL synthesis product estimate as discussed above. This is also close to the land mean latent heat flux estimate given by Trenberth et al. (2009) of 38.5 Wm−2 and near the 40 Wm−2 inferred from the water budget estimates in Trenberth et al. (2007, 2011). The ERA-Interim land mean latent heat flux is somewhat higher, at 44 Wm−2 (Table 3). Berrisford et al. (2011) note, however, that the latent heat flux in ERA-Interim may be overestimated by 9 %, which also favors a land mean latent heat flux in the vicinity of 40 Wm−2. Other reanalyses vary in a range from 38 up to 54 Wm−2 as can be deduced from the water budget analyses of Trenberth et al. (2011). Similarly to ERA-Interim, some of the CMIP5 models tend to overestimate the latent heat fluxes over terrestrial surfaces in the annual mean as evidenced by Mueller and Seneviratne (2014), related to excessive precipitation in these models. The uncertainty range given in Fig. 2 (upper panel) acknowledges the spread between the merged land surface model estimates (low end) and the merged reanalysis datasets (high end) given in Mueller et al. (2013). This range encompasses also most estimates of the CMIP5 models in Fig. 15 (middle panel).
With a land mean surface net radiation of 70 Wm−2 and latent heat flux slightly below 40 Wm−2, this leaves slightly more than 30 Wm−2 for the land mean sensible heat flux as a residual of the land surface energy balance. The estimated residual of 32 Wm−2 for the land mean sensible heat flux in Fig. 2 (upper panel) is close to the multimodel mean CMIP5 estimate of 31.3 Wm−2 (Table 2) which may be slightly biased low doe to excessive precipitation as pointed out above. The land mean sensible heat flux of 32 Wm−2 is higher than the ERA-Interim value of 28.2 Wm−2 (Table 3), but soil moisture is overestimated in ERA-Interim, particularly for dry land, as pointed out in Trenberth and Fasullo (2013) and Albergel et al. (2012), which may cause a low bias in the reanalysis sensible heat flux. The uncertainty in this component is, however, still particularly large, and the CMIP5 model estimates for the land mean sensible heat fluxes show larger ranges and standard deviations than for the corresponding latent heat fluxes, despite their lower absolute magnitudes (Table 2; Fig. 15). This justifies the above determination of the sensible heat flux as a residual in the surface energy balance. Excluding outliers outside two standard deviations, most land mean sensible heat fluxes simulated by the CMIP5 models lie between 25 and 36 Wm−2, which constitutes the uncertainty range attached to the land mean sensible heat flux in Fig. 2 (upper panel). This range encompasses also the various reanalysis estimates, which show a tendency to cluster towards the lower end of the range (Trenberth et al. 2009; Berrisford et al. 2011).
The reduction in the uncertainties related to the partitioning of the surface net radiation into sensible and latent heat over land surfaces remains a major challenge in global energy balance studies.
4 Energy balance over oceans
4.1 Assessment of ocean radiation budgets in CMIP5 models
4.1.1 Solar radiation
Ocean mean solar radiation budgets are displayed in Fig. 16 in terms of total (TOA), atmospheric and surface absorption. Their regional distributions can be inferred from Fig. 4. All model-calculated ocean budgets discussed in the following are again determined as averages over the years 2000–2004 in the historic “all forcings” experiments. Similar to the land mean budgets shown in Fig. 5, the models display a considerable spread in their solar budgets over ocean areas. From Table 2 we infer that the ranges and standard deviations of the model estimates are generally somewhat smaller than for the land budgets. This may partly be related to the more homogeneous surface boundary conditions as well as the larger averaging areas over ocean surfaces (covering 71 % of total area of the globe) than over the more heterogeneous land surfaces (covering 29 % of the globe), which tends to smooth out bias structures in the models more effectively over oceans than over land.

Annual mean solar radiation budgets over oceans calculated by 43 CMIP5/IPCC AR5 models for present day climate (baseline 2000–2004). Solar radiation absorbed at the ocean surface (lower panel), within the atmosphere (middle panel), and in the total climate system (TOA, uppermost panel). Units Wm−2
At the TOA, the net solar flux averaged over oceans in the CMIP5 multimodel mean (250.8 Wm−2) is again close to the CERES EBAF TOA reference which we determined at 251.7 Wm−2. As over land, no obvious bias in the simulated net solar flux at the TOA can be noted overall over oceans.
Again as over land, the differences between the solar budgets over oceans of the various CMIP5 models are larger at the surface (around 20 Wm−2) than at the TOA (around 16 Wm−2), despite the larger fluxes at the TOA (Figs. 16, 17; Table 2). Direct observations at the ocean surface to constrain the model-calculated surface downward solar fluxes are scarce. From BSRN, only 6 sites may be considered as representing to some extent maritime conditions, which at the same time provide records that are long enough to build representative climatologies. These are from West to East: Chesapeake Lighthouse, North Atlantic Ocean (36.9°N, 75.7°W); Bermuda Island, North Atlantic Ocean (32.3°N, 64.7°W); Cocos Island, Indian Ocean (12.1°S, 96.8°E); Manus Island, Central Pacific Ocean (2.0°S, 147.4°E); Nauru Island, Central Pacific Ocean (0.5°S, 166.9°E); Kwajalein, North Pacific Ocean (8.7°N, 167.7°E). Biases of the CMIP5 multimodel mean at these BSRN sites are shown in Fig. 18a. Although the biases vary largely, there is a general tendency for an overestimation of the downward surface solar radiation at these sites, as seen also over land surfaces. At individual stations, multimodel mean biases vary from strongly positive to close to zero. Specifically, biases are −0.4 Wm−2 (Chesapeake Lighthouse), 4.8 Wm−2 (Bermuda), 8.4 Wm−2 (Cocos Island), 17.9 Wm−2 (Manus), 14.6 Wm−2 (Nauru), −1.6 Wm−2 (Kwajalein). Averaged over all sites, 34 out of the 43 CMIP5 models (79 %) show an overestimation, while only 9 models (21 %) show an underestimation. Note that the Manus site has recently been shown to provide a representative set of measurements for the larger Tropical Western Pacific region (Riihimaki and Long 2014). This site is located very close to the coast, in a flat, near-sea level area of the island and is hardly affected by the local island meteorology, in contrast to a site more interior in the island.

Annual mean downward solar (upper panel) and thermal (lower panel) radiation over ocean surfaces under present day climate calculated by 43 CMIP5/IPCC AR5 models as listed in Table 2. Units Wm−2

Multimodel mean biases (model–observations) in a downward solar radiation and b downward thermal radiation at the surface with respect to 6 different BSRN sites in maritime environments. Sites are Bermuda Island (BER), North Atlantic Ocean (32.3°N, 64.7°W); Chesapeake Lighthouse (CHL), North Atlantic Ocean (36.9°N, 75.7°W); Cocos Island (COC), Indian Ocean (12.1°S, 96.8°E); Kwajalein (KWA), North Pacific Ocean (8.7°N, 167.7°E); Manus Island (MAN), Central Pacific Ocean (2.0°S, 147.4°E); Nauru Island (NAU), Central Pacific Ocean (0.5°S, 166.9°E). The distribution of individual model biases is further indicated with a vertical line covering ± one standard deviation. Units Wm−2
From GEBA, we used 20 sites with extended records in maritime environments. These sites include locations on various islands as shown in Fig. 3. Compared to these sites, the multimodel mean is higher by 4.2 Wm−2 on average.
In addition, buoy data are available in the tropical Atlantic, Pacific and Indian Ocean, albeit at the expense of a substantially lower quality at these unmanned sites (see Sect. 2). We used data from 43 buoys as described in Sect. 2. Multimodel mean biases with respect to the different buoy networks are given in Fig. 19a. Models tend to calculate higher fluxes than measured on average at the PIRATA buoys in the Eastern tropical Atlantic by 1.5 Wm−2, at the RAMA buoys in the Indian Ocean by 3.8 Wm−2, and at the 3 Woodshole buoys by 11.0 Wm−2, whereas the overall model bias is almost zero (−0.7 Wm−2) at the TAO/TRITON buoys in the Tropical Pacific (Fig. 19a). Thus, overall, radiation measurements representing maritime conditions still point towards an overestimation of the model calculated fluxes, as over land. Averaged over all 69 maritime GEBA, BSRN and buoy sites considered here, the CMIP5 multimodel mean overestimate amounts to 3.0 Wm−2. Due to the small number of sites with high quality measurements, and the arguable quality of the buoy data, the model overestimation over oceans is, however, quantitatively on a less solid basis than over land.

Multimodel mean biases (model–observations) in a downward solar radiation and b downward thermal radiation at the surface with respect to four different buoy networks, i.e. the Prediction and Research Moored Array in the Tropical Atlantic (PIRATA), the Tropical Atmosphere Ocean/Triangle Trans-Ocean Buoy Network (TAO/TRITON) in the Tropical Pacific, the Research Moored Array for African–Asian–Australian Monsoon Analysis and Prediction (RAMA) in the Indian Ocean, and three buoys from the Woods Hole Oceanographic Institution. The distribution of individual model biases is further indicated with a vertical line covering ± one standard deviation. Units Wm−2
4.1.2 Thermal radiation
Thermal radiation budgets averaged over global oceans as calculated by the 43 CMIP5 models are depicted in Fig. 20, with the outgoing thermal radiation at the TOA (upper panel), the net thermal radiation within the atmosphere (middle panel) and at the surface (lower panel). Their regional distributions are displayed in Fig. 9. As for the solar budgets, the spread amongst the thermal budgets of the CMIP5 models averaged over oceans is substantial, but smaller than the corresponding budgets over land.

Annual mean thermal radiation budgets over oceans calculated by 43 CMIP5/IPCC AR5 models for present day climate (baseline 2000–2004). Net thermal radiation at the ocean surface (lower panel), within the atmosphere (middle panel), and emitted to space (uppermost panel). Units Wm−2
From CERES EBAF, we determined an outgoing thermal radiation averaged over oceans at the TOA of 242.9 Wm−2 for the usual period 2001–2005. The associated multimodel mean of the CMIP5 models is 240.9 Wm−2 (Table 2), thus within 2 Wm−2 of the CERES EBAF estimate. At the ocean surface, the flux that can be compared with direct observations is again the downward thermal radiation, shown for the CMIP5 models in Fig. 17 (lower panel). We compared also these fluxes with the 6 BSRN sites considered as representing maritime conditions (Fig. 18b). The overall multimodel mean bias averaged over the 6 sites is marginal, at −0.3 Wm−2. The fluxes at 3 sites are underestimated by the multimodel mean (Bermuda −2.0 Wm−2, Cocos Island −3.1 Wm−2, Nauru −3.6 Wm−2), two sites show biases of less than 1 Wm−2 (Kwajalein 0.5 Wm−2, Manus 0.7 Wm−2), while one site (Chesapeake Lighthouse) shows an overestimation of 6.9 Wm−2. The comparison with the 17 buoy sites with useful thermal measurements (Sect. 2) gave an overall 3.0 Wm−2 lower value for the multimodel mean compared to observations. It has been argued that the lack of shading on the buoy measurements may cause an overestimation of the downward thermal measurements of a similar amount (Wang and Dickinson 2013 and references therein). This would reduce the overall bias similar to the one seen when compared to the BSRN sites. Thus, based on the limited observational evidence from BSRN and buoys, there seems no indication for a large bias of the model-calculated downward thermal fluxes over oceans, if anything, then a small underestimation. Regionally, the simulated multimodel mean fluxes show an almost zero bias at the TAO/TRITON buoys in the Tropical Pacific (Fig. 19b), as already noted with the simulated solar fluxes in this region (Fig. 19a). The simulated downward thermal fluxes overall are lower than the buoy observations in the Eastern Tropical Atlantic (PIRATA), at the RAMA buoys in the Indian Ocean, and at the 3 Woodshole buoys (Fig. 19b).
4.2 Best estimates for the downward solar and thermal radiation at the ocean surface
As done in Sect. 3.2 for the land mean estimates, in the following we make an attempt to derive best estimates for the ocean mean downward radiative fluxes, by constraining also the ocean mean values of the CMIP5 models with their respective model biases. Figure 21 shows the model biases in downward solar radiation averaged over the 26 sites from BSRN and GEBA against their respective ocean means. The correlation is surprisingly high, given the limited number of ocean stations (correlation coefficient 0.94). Thus, in the models, their overall differences at these sites reflect remarkably well the differences in their ocean mean values. Applying again the orthogonal linear regression approach to determine a best estimate for the ocean mean downward solar radiation results in 184.0 Wm−2 (±0.7 Wm−2, 2σ uncertainty). We again enlarge this uncertainty range to cover all ocean mean values from those CMIP5 models with marginal biases (c.f. Sect. 3.2). This leaves a conservative uncertainty range for the ocean mean downward solar radiation from 182 to 189 Wm−2 (rounded).

Ocean mean surface downward solar radiation of 43 CMIP5/IPCC AR5 models versus their respective biases compared to an average over 26 BSRN/GEBA surface sites. A “best estimate” for the ocean mean downward solar radiation is inferred at the intersection between the orthogonal linear regression line and the zero bias line (dotted lines). Units Wm−2
When the 43 buoy sites instead of the 26 BSRN/FGEBA sites are used as reference, the correlation between the model biases and their ocean means is much weaker (correlation coefficient 0.48), and the regression approach may not be applicable. This indicates, that model differences in downward surface solar radiation over the inner tropical oceans where the buoys are located are not very indicative of their respective ocean mean differences.
Alternatively, a best estimate may be obtained by applying a simple bias correction to the model-calculated ocean mean downward surface solar radiation, by correcting this value with the model bias as obtained when compared to observations. Specifically, taking the multimodel ocean mean downward surface solar radiation of 188.3 Wm−2 (c.f. Table 2), and correcting it with a multimodel mean bias of −3.0 Wm−2 (as obtained when compared to the 69 maritime sites, c.f. Sect. 4.1.1), this results in a best estimate of 185.3 Wm−2.
A best estimate near 185 Wm−2 for the ocean mean downward surface solar radiation seems therefore in least conflict with the limited observational references according to the above analyses. This estimate comes surprisingly close to the estimates given by Trenberth et al. (2009) of 184.4 Wm−2 and the estimate from the surface CERES EBAF dataset which we determined at 186.6 Wm−2 over ocean surfaces. The ocean mean downward surface solar radiation determined by the ERA-Interim reanalysis is 188.4 Wm−2 (Table 3). It is noteworthy that these recent estimates of ocean mean surface downward solar radiation are thus remarkably consistent despite being completely independently derived, and differ by no more than 4 Wm−2. Arguably all these different approaches have their own set of limitations and critically seen may provide no more than indications on the magnitude of this flux over oceans. Yet the sum of these independent lines of evidence and their close agreement overall increases our confidence in the derived flux magnitude.
As noted already in Sect. 3.2, a feature common to many estimates is the close agreement of the land mean, global mean, and thus also ocean mean downward surface solar radiation. The absolute difference between land and ocean mean downward solar radiation amounts to 0.1 Wm−2 in CERES EBAF and 0.3 Wm−2 in Trenberth et al. (2009) (Table 3). The ocean mean values in ERA-Interim and ERA-40 are only slightly higher than their land mean values by 1.2 and 1.5 Wm−2, respectively (Table 3, Berrisford et al. 2011). This applies also for the present study, where our best estimate over land (184 Wm−2, Sect. 3.2) also closely matches our above estimates over oceans. Given the confidence we have in the estimated land mean downward solar radiation with strong observational constraints (c.f. Sect. 3.2), and taking into account the seemingly robust indications for a flux of similar magnitude over oceans, this further adds plausibility to an ocean mean downward solar radiation near 185 Wm−2. A best estimate near 185 Wm−2 for the downward surface solar radiation over oceans is thus in line with several independent estimates and consistent with both the limited number of available direct observations in maritime environments as well as the criterion of closely matching the land mean value.
For best estimates of the downward thermal radiation at the ocean surface, we applied again the orthogonal linear regression approach between the model biases at the maritime sites and the models’ ocean mean values (Fig. 22). Here we have only the 6 BSRN sites and 17 buoy stations available with thermal records. Correlations between the overall model biases and the corresponding model ocean means are lower than over land [correlation coefficient 0.73 (Fig. 22) over oceans versus 0.89 over land (Fig. 14)], but still considered high enough to apply our regression approach. The best estimate obtained for the ocean mean downward thermal radiation by the linear regression at the intersection with zero bias against the 23 BSRN/buoy sites is 356.9 Wm−2 (±1.0 Wm−2, 2σ uncertainty). We enlarge also this uncertainty range to embrace all ocean means calculated by models with negligible (<1 Wm−2) bias. This gives an uncertainty range from 353 to 359 Wm−2.

As Fig. 19, but for surface downward thermal radiation compared to an average over 23 BSRN/buoy sites
When the reference dataset is reduced to consider only the biases against the maritime BSRN stations in the regression analysis, the correlation is somewhat lower (0.63), but the best estimate in downward thermal radiation remains, at 355.6 Wm−2, very similar (not shown).
These best estimates fit also well to the notion in Sect. 4.1.2, that the CMIP5 models over oceans only marginally underestimate the downward thermal radiation when compared to the direct observations. The CMIP5 multimodel ocean mean downward thermal radiation amounts to 355.6 Wm−2 (Table 2). A best estimate near 356 Wm−2 for the downward thermal radiation seems therefore most consistent with the limited observations. Ma et al. (2014) applied also the regression approach of Wild et al. (2013a) and obtained a similar estimate of 354.8 Wm−2. The ERA-Interim determines an ocean mean downward thermal radiation of 356.2 Wm−2, thus matching the above estimates (Table 3). As noted in Sect. 3.2, the ERA estimate profits from both an accurate radiation scheme and an optimal meteorological input to this scheme. This gives additional support for a best estimate near 356 Wm−2 for the downward thermal radiation over oceans as inferred above. The surface CERES EBAF dataset determines the downward surface thermal radiation somewhat higher at 358.9 Wm−2. As with the ocean mean downward solar radiation, it is again remarkable that the completely independently derived estimates for the ocean mean downward solar radiation discussed above (i.e. satellite-derived estimates (CERES EBAF), reanalysis estimates (ERA-Interim) and bias-corrected GCM estimates) vary by no more than 3 Wm−2 (Table 3). This increases confidence that we now have a fairly good handle also on the magnitude of the ocean-mean downward thermal radiation.
The downward thermal radiation over oceans indirectly determined by Trenberth et al. (2009) as a residual of the other energy balance components, is, at 343 Wm−2, more than 10 Wm−2 lower than the above estimates that take into account observations in different ways (Table 3). This points to remaining uncertainties, particularly in the estimates of the non-radiative components of the surface energy budget over oceans.
4.3 Discussion of the maritime energy balance
A schematic representation of the ocean-mean energy balance is shown in Fig. 2 (lower panel), which combines the above estimates of ocean-mean downward solar and thermal radiation with best estimates for the other ocean energy balance components as discussed below.
4.3.1 Radiative components
The best estimates for the TOA fluxes averaged over oceans inferred from CERES EBAF for the TOA solar incoming, reflected, and absorbed radiation amount to 346.6, −94.9 and 251.7 Wm−2 respectively, and for the outgoing thermal radiation to −242.9 Wm−2 (Table 3). They are displayed as rounded values in Fig. 2 (lower panel). Thus, 72.5 % of the corresponding TOA solar irradiance is absorbed in the ocean domain of the climate system, compared to a 65.7 % in the land domain (Fig. 2, upper panel), as might be expected from the higher surface albedo over land. Uncertainty ranges of these TOA fluxes are again as discussed in Wild et al. (2013a). The total solar absorption in the ocean domain is now larger than the thermal emission at the TOA, which compensates for the energy loss due to the net atmospheric energy transport away from the ocean domain onto land (c.f. Discussion in Sect. 3.3.1). Quantitatively, the excess absorption compared to thermal emission averaged over oceans amounts to 8.8 Wm−2 (Table 2). Since close to 1 Wm−2 is taken up by the oceans, 7.9 Wm−2 remain to be exported from ocean to land, as indicated in Fig. 2 (lower panel). Note that the actual value associated with the arrow of the transport term from ocean to land (8 Wm−2) as well as its uncertainty range in the ocean energy balance diagram (Fig. 2, lower panel) are less than half of the corresponding value in the land energy balance diagram (Fig. 2 upper panel), due to the larger ocean domain. Multiplied by the global ocean area of 361 × 1012 m−2, this corresponds to the same 2.8 PW of ocean land transport as discussed in Sect. 3.3.1.
While the TOA fluxes are equally well known over both land and oceans from satellites, surface fluxes over oceans are less well constrained than over land, since direct observations at the ocean surface are much more scarce. For the downward ocean mean solar and thermal fluxes we use in Fig. 2 (lower panel) the estimates of 185 and 356 Wm−2, derived together with their uncertainty ranges in Sect. 4.2. As outlined there, these estimates, inferred from GCMs and their biases with respect to direct observations, are remarkably close (within 4 Wm−2) to reanalysis (ERA-Interim) estimates and the CERES satellite derived products. This increases our confidence in the magnitude of the ocean mean surface downward solar and thermal fluxes, despite the limited availability of direct observations. As also noted above and evident from Fig. 2, the surface downward solar fluxes averaged over land and oceans are nearly identical, which seems a robust feature in various estimates (see Sect. 4.2). This is the case despite an insolation at the TOA which is higher by 22 Wm−2 over ocean than over land, indicative of a stronger attenuation of the solar beam over oceans than over land, in line with higher water vapor content and cloudiness in the ocean domain, leading to stronger atmospheric reflection.
To determine the solar radiation absorbed by the oceans we need, in addition to the surface downward solar fluxes, also information on the albedo of the ocean surfaces. The surface CERES EBAF dataset incorporates a radiation weighted ocean mean albedo of 0.078, as can be deduced from Table 3. The albedo in this dataset is inferred from a coupled atmosphere/ocean radiative transfer model that has been extensively validated with BSRN data (Jin et al. 2002). From Berrisford et al. (2011) we deduce a radiation weighted ocean mean surface albedo used in ERA-Interim and ERA-40 of 0.075 and 0.077 respectively, while the average over the 43 CMIP5 models gives an ocean mean albedo of 0.074 (with a standard deviation of 0.01), as can be inferred from Table 2. From Trenberth et al. (2009) we take a value of 0.09 for their estimate of ocean mean albedo, as well as a value of 0.86 from the satellite derived ISCCP FD satellite-derived product. Assuming an ocean mean surface albedo of 0.08 (closely following the CERES EBAF value as over land) and our best estimate near 185 Wm−2 for downward solar radiation, this implies a reflected solar radiation over oceans of around 15 Wm−2, and an ocean mean absorbed surface solar radiation around 170 Wm−2. As over land, an accurate determination of surface albedo remains a challenge and introduces additional uncertainties in the absorbed and reflected solar fluxes at ocean surfaces. The estimates of solar radiation reflected at ocean surfaces in the recent literature span a range from 13 to 18 Wm−2 (Table 3; Berrisford et al. 2011; Trenberth et al. 2009) which confine the associated uncertainty range applied in Fig. 2 (lower panel).
The TOA and surface absorption of 252 and 170 Wm−2 imply an average absorption of solar radiation in the atmosphere above oceans of 82 Wm−2. This is 5 Wm−2 more than in the CMIP5 multimodel mean. Thus we quantitatively find a similar underestimation of atmospheric absorption over land and oceans in the CMIP5 models (cf. Sect. 3.3.1). Percent wise, Fig. 2 (lower panel) and Table 3 suggest that 23.6 % of the incoming solar radiation at the TOA over oceans is absorbed within the atmosphere, while 49.0 % is absorbed at ocean surfaces. Over land 23.7 % of the TOA insolation is absorbed in the atmosphere, while 41.9 % is absorbed at land surfaces. Thus, the fraction of incoming solar radiation absorbed in the atmosphere is very similar over both land and oceans in Fig. 2. This is not in conflict with the abovementioned higher attenuation over oceans which is primarily caused by a higher atmospheric reflection from the increased cloudiness. On a more regional scale over Europe, Hakuba et al. (2014) estimated the atmospheric absorption at 23.1 % based on a dense network of surface observations collocated with CERES EBAF TOA fluxes, which is remarkably close to the large-scale estimates obtained here. They further noted the fraction of atmospheric absorption, near 23 %, to be a very robust estimate largely unaffected by variations in latitude and season.
With respect to the thermal fluxes, for the upward thermal radiation at the ocean surfaces, estimates from reanalyses should be superior to those from the CMIP5 models, as they use prescribed observed sea surface temperatures as an approximation of skin temperature in their calculation of the surface emission rather than interactively calculated sea surface temperatures as in the CMIP5 models which can be biased. Note that also reanalyses consider a surface emissivity/absorptivity ε slightly lower than 1, thus the surface upward thermal radiation consists of the surface emission plus a small contribution of the upward reflected part of the downward thermal radiation, as outlined in Sect. 3.3.1. As also emphasized in that section, the sensitivity of the surface upward thermal radiation to uncertainties in ε is small, due to compensational effects between the surface emission and reflected part of the downward thermal radiation. In addition, the range of ε changes, which can be induced by temperature and windspeed changes, is well less than 1 % (Kato et al. 2013). Indeed reanalysis products are very consistent in their ocean mean upward thermal radiation, with values of 408.6 Wm−2 over the period 1989–2008 (ERA-Interim), 408.5 Wm−2 over the period 1989–2001 (ERA-40), 407.9 Wm−2 over the period 1989–2008 (NRA2) and 409.6 Wm−2 over the period 1989–2008 (JRA-25) (Berrisford et al. 2011). Since the center years of these periods are shifted back in time by some years compared to the period considered here (2000–2004), requiring a slight upward correction for the additional warming on the order of 0.5 Wm−2, we take a best estimate towards the upper bound of these values (409 Wm−2) in Fig. 2 (lower panel). This value is also very close to the CMIP5 multimodel mean (409.6 Wm−2, Table 2), even though the simulated sea surface temperatures in these fully coupled atmosphere–ocean models are not observationally constrained, in contrast to the aforementioned reanalyses. Also the estimate given by CERES EBAF (408.3 Wm−2) for the period 2000–2005 is very close to the above values. The uncertainty range, defined by the range of these estimates in absence of uncertainty information on the individual estimates, is accordingly also fairly narrow. Combining the 409 Wm−2 upward thermal flux with the best estimate of 356 Wm−2 for the downward thermal radiation (Sect. 4.2) leaves an amount of −53 Wm−2 for the net thermal cooling (upward minus downward) at ocean surfaces. Together with an absorbed solar radiation at the ocean surface of 170 Wm−2, this adds up to 117 Wm−2 of radiative energy available for the non-radiative energy fluxes over oceans. This best estimate for the surface net radiation over oceans is 3 Wm−2 lower than calculated by the CMIP5 multimodel mean (Table 2; Fig. 23). The higher surface net radiation in the CMIP5 multimodel mean is in line with the evidence for an overestimation of the downward solar radiation at ocean surfaces in the CMIP5 multimodel mean, which is not fully compensated by the small biases in the downward thermal radiation in these models (Sect. 4.1).

Annual mean surface net radiation (upper panel), latent heat flux (middle panel) and sensible heat flux (lower panel) over ocean surfaces under present day climate as calculated by 43 CMIP5/IPCC AR5 models. Units Wm−2
4.3.2 Non-radiative components
As over land, there are very limited direct observational constraints for the sensible and latent heat fluxes over oceans. Accordingly, also the CMIP5 models show a substantial spread in their ocean mean surface sensible and latent heat fluxes (Fig. 23). However, in contrast to the land mean estimates in Sect. 3.3.2, the simulated ocean mean latent heat fluxes show now both larger ranges and standard deviations than the corresponding sensible heat fluxes, as can be expected from their larger absolute values. We therefore determine here the latent heat flux as a residual of the ocean surface energy balance.
The CMIP5 model-calculated ocean mean sensible heat flux values cover a range from 11 to 17 Wm−2, when outliers exceeding 2 times the standard deviation are neglected (Fig. 23 lower panel). Reanalysis products give for the same quantity a very similar range of 11–16 Wm−2 (Trenberth et al. 2009; Berrisford et al. 2011). However, Clayson et al. (2014) recently estimated a higher ocean sensible heat flux of 17.8 Wm−2 over the 10 years period 1998–2007, based on the Seaflux dataset, which relies almost exclusively on satellite observations. This suggests that values towards the upper end of the model and reanalysis estimates may be more realistic than towards the lower end. Therefore we use a value of 16 Wm−2, corresponding to the highest reanalysis estimate, for the ocean mean sensible heat flux in Fig. 2 (lower panel). At the same time we acknowledge the mostly lower reanalyses and CMIP5 values and the slightly higher Seaflux value by adjusting the associated uncertainty range in Fig. 2 (lower panel) so that it covers the different reanalysis estimates as well as the Seaflux estimate, in absence of more specific uncertainty information and direct observational constraints. We thereby also acknowledge that to date, the uncertainties in this flux component remain substantial, particularly in relative terms, with the different estimates covering a range of almost half the absolute flux magnitude.
With a surface net radiation of 117 Wm−2 over oceans, a sensible heat flux near 16 Wm−2, and a subsurface ocean heat flux of the order of 1 Wm−2 due to the current imbalance of the climate system (e.g., Hansen et al. 2011), this leaves around 100 Wm−2 as a residual for the latent heat flux over oceans. This value comes very close to the ERA-40 and ERA-Interim ocean mean latent heat flux values of 99.0 and 99.3 Wm−2, respectively (Berrisford et al. 2011), and is also not too far from the estimate given in Trenberth et al. (2009) of 97.1 Wm−2. The value adopted here is, however, substantially higher than the value of 90.3 Wm−2 estimated in Seaflux (Clayson et al. 2014). The Seaflux value is the lowest recently published latent heat flux estimate over oceans and therefore also confines the uncertainty range at the low end in Fig. 2 (lower panel). Estimates of ocean mean latent heat fluxes from eight different reanalyses cover a wide range from 90 to 109 Wm−2 as can be deduced from the water budget estimates given in Trenberth et al. (2011). Our best estimate for the ocean mean latent heat flux near 100 Wm−2 is still considerably lower than the multimodel mean of the CMIP5 models of 104.8 Wm−2 (Table 2; Fig. 23). The higher value of the CMIP5 multimodel mean is a consequence of a higher surface net radiation over oceans due to a higher (and likely overestimated) surface solar radiation (cf. Sect. 4.1.1), as well as a somewhat lower sensible heat flux than estimated here. Estimates of ocean mean latent heat flux exceeding the multimodel mean value are therefore considered unrealistic, as it would require either an unrealistically high surface net radiation, or an unrealistically low sensible heat flux. We therefore use the CMIP5 multimodel mean value of 105 Wm−2 to confine the uncertainty range of the ocean mean latent heat flux at the upper end, in absence of other more stringent observational constraints.
In summary, the energy balance over oceans as schematically displayed in Fig. 2 (lower panel) is derived in a framework that is consistent with the land energy balance in Fig. 2 (upper panel), and does not violate the limited observational constraints. Uncertainties remain, as over land, particularly also in the partitioning of the available radiative energy at the ocean surface between the sensible and latent heat flux components.
5 Revisiting the global mean energy balance
To check the consistency of the land and ocean mean energy balance diagrams derived here with the global mean energy balance diagrams we published earlier in Wild et al. (2013a, b) and IPCC-AR5 we finally combine the ocean and land mean energy budget estimates in Fig. 2 into a global mean budget. The numbers displayed in Fig. 1 and Table 3 are thus derived by adding the land mean numbers in Fig. 2 (upper panel) multiplied by the global land fraction of 0.292, with the ocean mean numbers in Fig. 2 (lower panel) multiplied by the global land fraction of 0.708. The global mean radiative components obtained this way in Fig. 1 and Table 3 are nearly identical to the estimates in Wild et al. (2013a, b). Uncertainty ranges in Fig. 1 correspond to those in Wild et al. (2013b). Compared to Wild et al. (2013b) we obtain a global mean latent heat flux which, at 82 Wm−2, is lower by 2 Wm−2, due to emerging lower estimates of the land evaporation (c.f. Sect. 3.3.2), at the expense of a slightly higher global mean sensible heat flux required to close the surface energy balance. This lower global mean latent heat flux is more compatible with global precipitation estimates which may be used to constrain the magnitude of the global mean evaporation and their energy equivalent, the global mean latent heat flux. At 82 Wm−2, the estimated global mean latent heat flux is close to the estimate of Trenberth et al. (2009) at 80 Wm−2. The 82 Wm−2 are still somewhat higher than the energy equivalent of the precipitation estimates given in given in the Global Precipitation Climatology Project (GPCP, Adler et al. 2012) of 76 Wm−2, yet within their uncertainty range, and clearly below the 85 Wm−2 considered by Trenberth and Fasullo (2012) as upper limit of current uncertainties in precipitation retrieval. We adopt the 85 Wm−2 as upper bound of the uncertainty range specified for the latent heat flux in Fig. 1, and 70 Wm−2 as lower bound, corresponding to the lower limit given in GPCP. This range has been exceeded by Stephens et al. (2012) who determined the global mean latent heat at 88 Wm−2 (with a considerable uncertainty range of ±10 Wm−2). The higher latent heat flux in Stephens et al. (2012) is a consequence of their use of higher solar and thermal downward radiation fluxes from satellite products than estimated here.
The apparent discrepancy between the global mean latent heat flux estimate as inferred from global precipitation observations on the one hand, and as inferred from the available surface radiative energy as given by some of the satellite products on the other hand, has lead to controversial discussions on potential inconsistencies between the global energy and water cycles (e.g., Wild 2012). The estimates presented in Fig. 1 may be able to reconcile the observational constraints imposed on the global latent heat flux and associated intensity of the global water cycle from both the precipitation and surface radiation observation perspective.
6 Conclusions
In this study we assessed the energy budgets separated over land and oceans in state-of-the-art climate models (CMIP5) considered in the latest IPCC report (AR5), using to the extent possible direct observations from both surface and space. Based on these analyses and a literature review we made an attempt to establish reference estimates for the magnitude of the components of the Earth’s energy balance separately averaged over land and oceans, along with a validation of these components in the CMIP5 models. This study is thus an extension of the study of Wild et al. (2013a) who focused on the global mean energy balance.
The magnitudes of TOA fluxes over land and oceans can now well be determined from the CERES satellite observations. The CMIP5 multimodel mean solar and thermal fluxes closely match these observations when averaged over land and oceans. More substantial biases remain in individual models. Compared to the TOA fluxes, the magnitudes of the surface fluxes are much less well established, as they are not directly measurable by satellites. Historically, this has lead to an unsatisfactory large spread in the surface flux estimates already on global or land/ocean averaged-scales, and has prevented the establishment of firm agreed-upon reference values for the magnitudes of the ocean and land surface energy balance components. This is still evident in the significant spread in the land and ocean surface budgets of the CMIP5 models. Compared to direct surface observations, the majority of these models tend to overestimate the downward solar radiation over land and oceans, and underestimate the downward thermal radiation particularly over land.
We used the information contained in the direct surface observations to constrain the model-calculated surface radiative fluxes and to derive reference estimates for surface radiation over land and oceans. We infered these estimates by relating the surface radiation biases in the various CMIP5 models to their respective land and ocean mean values through orthogonal linear regressions, and evaluating the regression function at the zero bias intersect. The estimates determined this way are remarkably consistent with other recent estimates based on reanalysis and satellite-products, which were completely independently derived. This is particularly true for the land mean budget where we can rely on a comprehensive database of radiation measurements, but also to some extent over oceans with weaker observational constraints, where our downward solar and thermal radiation estimates are within 4 Wm−2 of the independently derived reanalysis and satellite estimates. While the different approaches undeniably have their individual limitations, the agreement of their independently derived estimates is remarkable, even over oceans with limited observational constraints.
This suggests that we are approaching a stage where we are not only confident in the magnitudes of the radiation budgets at the TOA, but increasingly also at the surface, when considered on a global or land/ocean mean basis. Remaining challenges include the accurate determination of large-scale surface albedo estimates, and the adequate representation of the surface skin temperatures in the estimation of the surface upward thermal radiation. Considerable uncertainties remain also in the magnitudes of the non-radiative fluxes of sensible and latent heat and their partitioning over both land and oceans. The more reliable estimates of the land and ocean surface radiation balance may be able to impose additional constraints on the non-radiative components of the surface energy balance, and thereby for example also on the intensity of the water cycles over land and oceans. Future steps will require a further regionalization of observationally-constrained energy budgets beyond global, land, and ocean means. An attempt is currently underway to constrain the solar radiation budgets over Europe, making full use of both surface and spaceborne observations (Hakuba et al. 2014).
References
Adler RF, Gu GJ, Huffman GJ (2012) Estimating climatological bias errors for the global precipitation climatology project (GPCP). J Appl Meteorol Clim 51(1):84–99. doi:10.1175/Jamc-D-11-052.1
Albergel C, de Rosnay P, Gruhier C, Munoz-Sabater J, Hasenauer S, Isaksen L, Kerr Y, Wagner W (2012) Evaluation of remotely sensed and modelled soil moisture products using global ground-based in situ observations. Remote Sens Environ 118:215–226. doi:10.1016/J.Rse.2011.017
Berrisford P, Kallberg P, Kobayashi S, Dee D, Uppala S, Simmons AJ, Poli P, Sato H (2011) Atmospheric conservation properties in era-interim. Q J R Meteorol Soc 137(659):1381–1399. doi:10.1002/Qj.864
Bourles B, Lumpkin R, McPhaden MJ, Hernandez F, Nobre P, Campos E, Yu LS, Planton S, Busalacchi A, Moura AD, Servain J, Trotte J (2008) The PIRATA program: history, accomplishments, and future directions. Bull Am Meteorol Soc 89(8):1111–1125. doi:10.1175/2008bams2462.1
Budyko MI (1956) The heat balance of the Earth’s surface (1958) (Teplovoi balans zemnoi poverkhnosti). US Department of Commerce; Gidrometeorologicheskoe iz datel’stovo, Leningrad
Clayson CA, Roberts JB, Bogdanoff A (2014) Seaflux version 1: a new satellite based ocean atmosphere turbulent flux dataset. Int J Climatol (submitted)
Colbo K, Weller RA (2009) Accuracy of the IMET sensor package in the subtropics. J Atmos Ocean Tech 26(9):1867–1890. doi:10.1175/2009jtecho667.1
Dolinar E, Dong X, Xi B, Jiang J, Su H (2014) Evaluation of CMIP5 simulated clouds and TOA radiation budgets using NASA satellite observations. Clim Dyn. doi:10.1007/s00382-014-2158-9
Fasullo JT, Trenberth KE (2008a) The annual cycle of the energy budget. Part I: global mean and land-ocean exchanges. J Clim 21(10):2297–2312. doi:10.1175/2007jcli1935.1
Fasullo JT, Trenberth KE (2008b) The annual cycle of the energy budget. Part II: meridional structures and poleward transports. J Clim 21(10):2313–2325. doi:10.1175/2007jcli1936.1
Foltz GR, Evan AT, Freitag HP, Brown S, McPhaden MJ (2013) Dust accumulation biases in PIRATA shortwave radiation records. J Atmos Ocean Tech 30(7):1414–1432. doi:10.1175/Jtech-D-12-00169.1
Gilgen H, Wild M, Ohmura A (1998) Means and trends of shortwave irradiance at the surface estimated from global energy balance archive data. J Clim 11(8):2042–2061
Hakuba MZ, Folini D, Sanchez-Lorenzo A, Wild M (2013) Spatial representativeness of ground-based solar radiation measurements. J Geophys Res 118:8585–8597. doi:10.1002/jgrd.50673
Hakuba MZ, Folini D, Schaepman-Strub G, Wild M (2014) Solar absorption over Europe from collocated surface and satellite observations. J Geophys Res 119:3420–3437. doi:10.1002/2013JD021421
Hansen J, Sato M, Kharecha P, von Schuckmann K (2011) Earth’s energy imbalance and implications. Atmos Chem Phys 11(24):13421–13449. doi:10.5194/Acp-11-13421-2011
Hartmann DL, Ramanathan V, Berroir A, Hunt GE (1986) Earth radiation budget data and climate research. Rev Geophys 24(2):439–468
Hatzianastassiou N, Matsoukas C, Fotiadi A, Pavlakis KG, Drakakis E, Hatzidimitriou D, Vardavas I (2005) Global distribution of earth’s surface shortwave radiation budget. Atmos Chem Phys 5:2847–2867
Iacono MJ, Mlawer EJ, Clough SA, Morcrette JJ (2000) Impact of an improved longwave radiation model, RRTM, on the energy budget and thermodynamic properties of the NCAR community climate model, CCM3. J Geophys Res-Atmos 105(D11):14873–14890
Jimenez C, Prigent C, Mueller B, Seneviratne SI, McCabe MF, Wood EF, Rossow WB, Balsamo G, Betts AK, Dirmeyer PA, Fisher JB, Jung M, Kanamitsu M, Reichle RH, Reichstein M, Rodell M, Sheffield J, Tu K, Wang K (2011) Global intercomparison of 12 land surface heat flux estimates. J Geophys Res-Atmos 116. doi:10.1029/2010jd014545
Jin ML, Dickinson RE (2010) Land surface skin temperature climatology: benefitting from the strengths of satellite observations. Environ Res Lett 5(4). doi:10.1088/1748-9326/5/4/044004
Jin ZH, Charlock TP, Rutledge K (2002) Analysis of broadband solar radiation and albedo over the ocean surface at cove. J Atmos Ocean Tech 19(10):1585–1601. doi:10.1175/1520-0426(2002)019<1585:Aobsra>2.0.Co;2
Kato S, Rose F, Sun-Mack S, Miller W, Chen Y, Rutan D, Stephens G, Loeb N, Minnis P, Wielicki B, Winker D, Charlock T, Stackhouse P, Xu K, Collins W (2011) Improvements of top-of-atmosphere and surface irradiance computations with calipso-, cloudsat-, and modis-derived cloud and aerosol properties. J Geophys Res 116:D19209. doi:10.1029/2011JD016050
Kato S, Loeb NG, Rose FG, Doelling DR, Rutan DA, Caldwell TE, Yu LS, Weller RA (2013) Surface irradiances consistent with CERES-derived top-of-atmosphere shortwave and longwave irradiances. J Clim 26(9):2719–2740. doi:10.1175/Jcli-D-12-00436.1
Kiehl JT, Trenberth KE (1997) Earth’s annual global mean energy budget. Bull Am Meteorol Soc 78(2):197–208
Kim DY, Ramanathan V (2008) Solar radiation budget and radiative forcing due to aerosols and clouds. J Geophys Res-Atmos 113(D2):D02203. doi:10.1029/2007jd008434
König-Langlo G, Sieger R, Schmithüsen H, Bücker A, Richter F, Dutton EG (2013) The baseline surface radiation network and its world radiation monitoring centre at the Alfred Wegener Institute. GCOS Report 174: update of the technical plan for BSRN data management. World Meteorological Organization (WMO). http://www.wmo.int/pages/prog/gcos/Publications/gcos-174.pdf
Li JLF, Waliser DE, Stephens G, Lee S, L’Ecuyer T, Kato S, Loeb N, Ma HY (2013) Characterizing and understanding radiation budget biases in CMIP3/CMIP5 GCMs, contemporary GCM, and reanalysis. J Geophys Res-Atmos 118(15):8166–8184. doi:10.1002/Jgrd.50378
Loeb NG, Wielicki BA, Doelling DR, Smith GL, Keyes DF, Kato S, Manalo-Smith N, Wong T (2009) Toward optimal closure of the earth’s top-of-atmosphere radiation budget. J Clim 22(3):748–766. doi:10.1175/2008jcli2637.1
Loeb NG, Kato S, Su WY, Wong TM, Rose FG, Doelling DR, Norris JR, Huang XL (2012) Advances in understanding top-of-atmosphere radiation variability from satellite observations. Surv Geophys 33(3–4):359–385. doi:10.1007/S10712-012-9175-1
Ma Q, Wang K, Wild M (2014) Evaluations of atmospheric downward longwave radiation from 44 coupled general circulation models of CMIP5. J Geophys Res Atmos 119:4486–4497. doi:10.1002/2013JD021427
McPhaden MJ, Busalacchi AJ, Cheney R, Donguy JR, Gage KS, Halpern D, Ji M, Julian P, Meyers G, Mitchum GT, Niiler PP, Picaut J, Reynolds RW, Smith N, Takeuchi K (1998) The tropical ocean global atmosphere observing system: a decade of progress. J Geophys Res-Oceans 103(C7):14169–14240. doi:10.1029/97jc02906
McPhaden MJ, Meyers G, Ando K, Masumoto Y, Murty VSN, Ravichandran M, Syamsudin F, Vialard J, Yu L, Yu W (2009) Rama the research moored array for African–Asian–Australian monsoon analysis and prediction. Bull Am Meteorol Soc 90(4):459–480. doi:10.1175/2008bams2608.1
Mlawer EJ, Taubman SJ, Brown PD, Iacono MJ, Clough SA (1997) Radiative transfer for inhomogeneous atmospheres: RRTM, a validated correlated-k model for the longwave. J Geophys Res-Atmos 102(D14):16663–16682
Mueller B, Seneviratne SI (2014) Systematic land climate and evapotranspiration biases in CMIP5 simulations. Geophys Res Lett 41. doi:10.1002/2013GL058055
Mueller B, Seneviratne SI, Jimenez C, Corti T, Hirschi M, Balsamo G, Ciais P, Dirmeyer P, Fisher JB, Guo Z, Jung M, Maignan F, McCabe MF, Reichle R, Reichstein M, Rodell M, Sheffield J, Teuling AJ, Wang K, Wood EF, Zhang Y (2011) Evaluation of global observations-based evapotranspiration datasets and IPCC AR4 simulations. Geophys Res Lett 38. doi:10.1029/2010gl046230
Mueller B, Hirschi M, Jimenez C, Ciais P, Dirmeyer PA, Dolman AJ, Fisher JB, Jung M, Ludwig F, Maignan F, Miralles DG, McCabe MF, Reichstein M, Sheffield J, Wang K, Wood EF, Zhang Y, Seneviratne SI (2013) Benchmark products for land evapotranspiration: landflux-eval multi-data set synthesis. Hydrol Earth Syst Sci 17(10):3707–3720. doi:10.5194/Hess-17-3707-2013
Neely RR, Toon OB, Solomon S, Vernier JP, Alvarez C, English JM, Rosenlof KH, Mills MJ, Bardeen CG, Daniel JS, Thayer JP (2013) Recent anthropogenic increases in SO2 from Asia have minimal impact on stratospheric aerosol. Geophys Res Lett 40(5):999–1004. doi:10.1002/Grl.50263
Ohmura A (2004) Cryosphere during the twentieth century. State Planet: Front Challenges Geophys 150:239–257. doi:10.1029/150gm19
Ohmura A, Gilgen H (1993) Reevaluation of the global energy-balance. Interact Global Clim Subsyst 75:93–110
Ohmura A, Gilgen H, Wild M (1989) Global energy balance archive GEBA, world climate program—water project a7. Zuercher Geografische Schriften, vol 34, Zurich
Ohmura A, Dutton EG, Forgan B, Frohlich C, Gilgen H, Hegner H, Heimo A, König-Langlo G, McArthur B, Muller G, Philipona R, Pinker R, Whitlock CH, Dehne K, Wild M (1998) Baseline surface radiation network (BSRN/WCRP): new precision radiometry for climate research. Bull Am Meteorol Soc 79(10):2115–2136
Potter GL, Cess RD (2004) Testing the impact of clouds on the radiation budgets of 19 atmospheric general circulation models. J Geophys Res-Atmos 109(D2):D02106. doi:10.1029/2003jd004018
Ramanathan V (1987) The role of earth radiation budget studies in climate and general-circulation research. J Geophys Res-Atmos 92(D4):4075–4095. doi:10.1029/Jd092id04p04075
Riihimaki LD, Long CN (2014) Spatial variability of surface irradiance measurements at the Manus arm site. J Geophys Res 119:5475–5491. doi:10.1002/2013JD021187
Rutan D, Kato S, Doelling D, Rose FG, Nguyen C, Caldwell T, Loeb NG (2014) CERES synoptic (syn) surface radiant flux product: methodology and validation. J Atmos Oceanic Technol (submitted)
Santer BD, Bonfils C, Painter JF, Zelinka MD, Mears C, Solomon S, Schmidt GA, Fyfe JC, Cole JNS, Nazarenko L, Taylor KE, Wentz FJ (2014) Volcanic contribution to decadal changes in tropospheric temperature. Nat Geosci 7(3):185–189. doi:10.1038/Ngeo2098
Seneviratne SI, Corti T, Davin EL, Hirschi M, Jaeger EB, Lehner I, Orlowsky B, Teuling AJ (2010) Investigating soil moisture–climate interactions in a changing climate: a review. Earth-Sci Rev 99(3–4):125–161. doi:10.1016/J.Earscirev.02.004
Simmons AJ, Jones PD, Bechtold VD, Beljaars ACM, Kallberg PW, Saarinen S, Uppala SM, Viterbo P, Wedi N (2004) Comparison of trends and low-frequency variability in cru, era-40, and ncep/NCAR analyses of surface air temperature. J Geophys Res-Atmos 109(D24):D24115. doi:10.1029/2004jd005306
Stephens GL, Li JL, Wild M, Clayson CA, Loeb N, Kato S, L’Ecuyer T, Stackhouse PW, Lebsock M, Andrews T (2012) An update on earth’s energy balance in light of the latest global observations. Nat Geosci 5(10):691–696. doi:10.1038/Ngeo1580
Stevens B, Schwartz SE (2012) Observing and modeling earth’s energy flows. Surv Geophys 33(3–4):779–816. doi:10.1007/S10712-012-9184-0
Trenberth KE, Caron JM (2001) Estimates of meridional atmosphere and ocean heat transports. J Clim 14(16):3433–3443. doi:10.1175/1520-0442(2001)014<3433:Eomaao>2.0.Co;2
Trenberth KE, Fasullo JT (2008) An observational estimate of inferred ocean energy divergence. J Phys Oceanogr 38(5):984–999. doi:10.1175/2007jpo3833.1
Trenberth KE, Fasullo JT (2010) Simulation of present-day and twenty-first-century energy budgets of the southern oceans. J Clim 23(2):440–454. doi:10.1175/2009jcli3152.1
Trenberth KE, Fasullo JT (2012) Tracking earth’s energy: from El Nino to global warming. Surv Geophys 33(3–4):413–426. doi:10.1007/S10712-011-9150-2
Trenberth KE, Fasullo JT (2013) Regional energy and water cycles: transports from ocean to land. J Clim 26(20):7837–7851. doi:10.1175/Jcli-D-13-00008.1
Trenberth KE, Smith L, Qian TT, Dai A, Fasullo J (2007) Estimates of the global water budget and its annual cycle using observational and model data. J Hydrometeorol 8(4):758–769. doi:10.1175/Jhm600.1
Trenberth KE, Fasullo JT, Kiehl J (2009) Earth’s global energy budget. Bull Am Meteorol Soc 90(3):311. doi:10.1175/2008bams2634.1
Trenberth KE, Fasullo JT, Mackaro J (2011) Atmospheric moisture transports from ocean to land and global energy flows in reanalyses. J Clim 24(18):4907–4924. doi:10.1175/2011jcli4171.1
Trenberth KE, Fasullo JT, Balmaseda MA (2014) Earth’s energy imbalance. J Clim 27(9):3129–3144. doi:10.1175/Jcli-D-13-00294.1
Wang KC, Dickinson RE (2013) Global atmospheric downward longwave radiation at the surface from ground-based observations, satellite retrievals, and reanalyses. Rev Geophys 51(2):150–185. doi:10.1002/Rog.20009
Wang HL, Su WY (2013) Evaluating and understanding top of the atmosphere cloud radiative effects in intergovernmental panel on climate change (IPCC) fifth assessment report (AR5) coupled model intercomparison project phase 5 (CMIP5) models using satellite observations. J Geophys Res-Atmos 118(2):683–699. doi:10.1029/2012jd018619
Wielicki BA, Barkstrom BR, Harrison EF, Lee RB, Smith GL, Cooper JE (1996) Clouds and the earth’s radiant energy system (ceres): an earth observing system experiment. Bull Am Meteorol Soc 77(5):853–868
Wild M (2005) Solar radiation budgets in atmospheric model intercomparisons from a surface perspective. Geophys Res Lett 32(7):L07704. doi:10.1029/2005gl022421
Wild M (2008) Short-wave and long-wave surface radiation budgets in GCMs: a review based on the IPCC-AR4/CMIP3 models. Tellus A 60(5):932–945. doi:10.1111/J.1600-0870.2008.00342.X
Wild M (2012) New directions: a facelift for the picture of the global energy balance. Atmos Environ 55:366–367
Wild M, Roeckner E (2006) Radiative fluxes in the ECHAM5 general circulation model. J Clim 19(16):3792–3809
Wild M, Ohmura A, Gilgen H, Roeckner E (1995a) Regional climate simulation with a high-resolution GCM—surface radiative fluxes. Clim Dyn 11(8):469–486
Wild M, Ohmura A, Gilgen H, Roeckner E (1995b) Validation of general-circulation model radiative fluxes using surface observations. J Clim 8(5):1309–1324
Wild M, Ohmura A, Gilgen H, Roeckner E, Giorgetta M, Morcrette JJ (1998) The disposition of radiative energy in the global climate system: GCM-calculated versus observational estimates. Clim Dyn 14(12):853–869
Wild M, Ohmura A, Gilgen H, Morcrette JJ, Slingo A (2001) Evaluation of downward longwave radiation in general circulation models. J Clim 14(15):3227–3239
Wild M, Grieser J, Schaer C (2008) Combined surface solar brightening and increasing greenhouse effect support recent intensification of the global land-based hydrological cycle. Geophys Res Lett 35(17):L17706. doi:10.1029/2008gl034842
Wild M, Folini D, Schar C, Loeb N, Dutton EG, König-Langlo G (2013a) The global energy balance from a surface perspective. Clim Dyn 40(11–12):3107–3134. doi:10.1007/S00382-012-1569-8
Wild M, Folini D, Schar C, Loeb N, Dutton EG, König-Langlo G (2013b) A new diagram of the global energy balance. AIP Conf Proc 1531:628–631. doi:10.1063/1.4804848
Zhang XT, Liang SL, Wang KC, Li L, Gui S (2010) Analysis of global land surface shortwave broadband albedo from multiple data sources. IEEE J-Stars 3(3):296–305. doi:10.1109/Jstars.2010.2049342
Acknowledgments
This study got support from the Swiss National Science Foundation Grant No. 135395 “Towards an improved understanding of the global energy balance: absorption of solar radiation” and from the National Centre for Competence in Climate Research (NCCR Climate) of the Swiss National Science Foundation as part of the NCCR Project HyClim. We highly appreciate the valuable review comments of Dr. Kevin Trenberth on this manuscript. We are grateful to Prof. Atsumu Ohmura for numerous discussions and for his leadership in the establishment of GEBA and BSRN. We would like to thank Dr. Guido Mueller for processing the BSRN data, Dr. Urs Beyerle and Prof. Reto Knutti for their efforts to download the immense CMIP5 dataset and Dr. Gabriela Schaepmann-Strub for advice on the albedo issues. We highly acknowledge Barbara Schär for the design of the global energy balance figures, and an anonymous reviewer for useful comments. We acknowledge the international modeling groups for providing their data for analysis, the Program for Climate Model Diagnosis and Intercomparison (PCMDI) for collecting and archiving the model data, the JSC/CLIVAR Working Group on Coupled Modeling (WGCM) and their Coupled Model Intercomparison Project (CMIP) and Climate Simulation Panel for organizing the model data analysis activity, and the IPCC WG1 TSU for technical support. The IPCC Data Archive at Lawrence Livermore National Laboratory is supported by the Office of Science, U.S. Department of Energy.
Author information
Authors and Affiliations
Corresponding author
Rights and permissions
Open Access This article is distributed under the terms of the Creative Commons Attribution License which permits any use, distribution, and reproduction in any medium, provided the original author(s) and the source are credited.
About this article

Cite this article
Wild, M., Folini, D., Hakuba, M.Z. et al. The energy balance over land and oceans: an assessment based on direct observations and CMIP5 climate models. Clim Dyn 44, 3393–3429 (2015). https://doi.org/10.1007/s00382-014-2430-z
Received:
Accepted:
Published:
Issue Date:
DOI: https://doi.org/10.1007/s00382-014-2430-z