
Abstract
Accelerated life tests (ALTs) play a pivotal role in life testing experiments as they significantly reduce costs and testing time. Hence, this paper investigates the statistical inference issue for the Weibull inverted exponential distribution (WIED) under the progressive first-failure censoring (PFFC) data with the constant-stress partially ALT (CSPALT) under progressive first-failure censoring (PFFC) data for Weibull inverted exponential distribution (WIED). For classical inference, maximum likelihood (ML) estimates for both the parameters and the acceleration factor are derived. Making use of the Fisher information matrix (FIM), asymptotic confidence intervals (ACIs) are constructed for all parameters. Besides, two parametric bootstrap techniques are implemented. For Bayesian inference based on a proposed technique for eliciting the hyperparameters, the Markov chain Monte Carlo (MCMC) technique is provided to acquire Bayesian estimates. In this context, the Bayesian estimates are obtained under symmetric and asymmetric loss functions, and the corresponding credible intervals (CRIs) are constructed. A simulation study is carried out to assay the performance of the ML, bootstrap, and Bayesian estimates, as well as to compare the performance of the corresponding confidence intervals (CIs). Finally, real-life engineering data is analyzed for illustrative purposes.
1 Introduction
Undoubtedly, several statisticians seek information about the lifetimes of products and materials to improve and develop them, and it may be difficult to obtain it during testing under normal conditions, as lifetime testing is costly and time-consuming. So, to access failure data in the shortest possible time in fields such as manufacturing industries, it is preferable to use ALTs. In ALTs, the experiment items are tested by exposing them to higher stress levels than normal ones, which could be temperature, vibration, voltage, pressure, etc., and continue under these conditions to induce early failure or start them up under normal conditions, hence exposing the units that did not fail by pre-specified time to higher stress levels. Therefore, we can divide ALTs into two types, the first one is fully ALTs which is based on the major assumption that the relationship between life and stress is known while the second one is partially ALTs in which the previous relationship is unknown or cannot be assumed. It is worth noting that in such accelerated conditions, the collected data is extrapolated by a physically appropriate statistical model to estimate the lifetime distribution under normal conditions of use.
In accordance with Nelson (2009), fully ALTs are divided mainly into three types. The first one is constant-stress ALT which is considered the most common stress. In this kind of stress, the sample items are exposed to continuous stress until failure or censoring whichever occurs first. Many authors studied that type, see, for instance, Lin et al. (2019) and Dey and Nassar (2020). Sometimes there is a large variation in failure times, so constant-stress may take too much time. Hence, an alternative approach is needed to ensure failure occurs faster. As a result, step-stress testing appeared to overcome this obstacle and to be more efficient and practical than constant stress. Under this type, the test item is exposed to a level of stress for a pre-specified period until it fails but if it does not fail, the level of stress to which it is exposed is raised and increases repeatedly until the test item fails or the censored condition is reached. Several authors studied step-stress ALT, see for example (Wang 2006 and Hakamipour 2021). The third type is considered progressive-stress ALT in which the test items are exposed to continuously increasing stress with time, see (Abdel-Hamid and Al-Hussaini 2007; Mahto et al. 2020) and (Mahto et al. 2021).
In some cases, the data of fully ALTs cannot be extrapolated to normal use conditions because the nature of the life-stress relationship is unknown, so partially accelerated life tests (PALTs) are a good option to use in such cases in estimating the acceleration factor, thus extrapolating the accelerated data to normal use conditions. Just like fully ALTs, PALTs are also mainly divided into three types. The first one is CSPALT where the sample items are run at either normal or accelerated conditions, i.e. each test item is run at a constant stress level until the test is terminated. Several authors have studied this type under various censoring schemes, see (Abushal and Soliman 2015) and (Hassan et al. 2020). In the second one, step-stress PALT, the test item is firstly run at normal stress with a pre-specified time (stress change time) until failing but if it does not fail, the test condition is switched to a higher stress level in which the item is exposed to steady stress until failure occurs or censoring reaches, that is, the total lifetime of the test item goes through two stages, normal use condition and accelerated condition, respectively, see (Ismail 2016) and (Akgul et al. 2020). The third one is considered progressive-stress PALT, see (Ismail and Al-Babtain 2015).
In life testing experiments, complete data on failure times for all test items may not be obtained and this leads us to what is known as censoring, where the data obtained from these tests are called censored data. The most common censoring types are Type-I and Type-II censoring. In the first type, the units are run simultaneously in the test for a pre-specified period. During this period, if not all test units fail, the surviving units are removed when the period expires, see (Ali and Aslam 2013) and (Algarni et al. 2020), while in the second type, the units are run simultaneously in the test until a pre-fixed number of items fail, thus the remaining items are removed, see (Balakrishnan and Han 2008) and (Kundu and Howlader 2010). In such previous types, there is no flexibility in withdrawing test items during the test. Hence, a more general censoring scheme is proposed which is known as a progressive type-II censoring scheme to overcome this obstacle. In this type, pre-specified items are withdrawn from the test at an individual item failure and the test continues at this pace until a pre-fixed number of items fail, at which stage the remaining surviving items are removed, see for example (EL-Sagheer 2018; Guo and Gui 2018), and (Mingjie and Gui 2021). At present, the most general flexible censoring scheme for withdrawing and saving the largest number of test units without failure, thus reducing time and cost, is the PFFC scheme proposed by Shuo-Jye and Kuş (2009), and will be highlighted in the next section. Several authors studied this scheme under different distributions, see (Sukhdev and Yogesh 2015; Xie and Gui 2020; Shi and Shi 2021), and (Lin et al. 2023).
Chandrakant et al. (2018) proposed WIED as an extension of the inverted exponential distribution. WIED is highly flexible and can take several shapes such as J-reversed, positively skewed, and symmetric as well. Besides, WIED in terms of the hazard rate function can acquire several forms such as constant, increasing, decreasing, unimodal, and j-shaped. In accordance with the previous features, WIED can be used in several sectors such as industry and medicine to fit different reliability data.
The probability density function (PDF), cumulative distribution function (CDF), reliability function (RF), and hazard rate function (HRF) can be written, respectively, as follows:
and
This article aims to discuss the statistical inference issue for the WIED in the presence of CSPALT under the PFFC scheme. To this end, point and interval estimates are discussed by implementing classical and Bayesian approaches. Besides, two bootstrap techniques are proposed. The paper layout is arranged as follows. Section 2 discusses the characterization of the CSPALT procedure within the framework of the PFFC scheme. In Sect. 3, ML estimates are highlighted, and the observed FIM is obtained. In Sect. 4, bootstrap-p (Boot-p), and bootstrap-t (Boot-t) are discussed. In accordance with the squared error (SE) and linear exponential (LX) loss functions, Bayesian estimates are obtained in Sect. 5. In Sect. 6, a simulation study is conducted using the Monte Carlo method. A real engineering illustrative example is discussed in Sect. 7. Finally, Sect. 8 summarizes the paper.
2 Model characterization
2.1 Test procedure
-
1.
Suppose u test items are divided in accordance with a certain proportion p into two groups: up items among u items are chosen at random for use condition, while the remaining items \(u(1-p)\) are chosen for accelerated condition.
-
2.
The PFFC scheme is implemented as follows:
-
i.
The test items under use and accelerated conditions are divided into several groups \(n_{j},j=1,2\) of the same size \(k_{j},j=1,2\).
-
ii.
Let \(X_{ji:m_{j}:n_{j}:k_{j}}^{R_{ji}},j=1,2,i=1,2,\ldots ,m_{j}\) refer to two PFFC samples with censoring schemes \(R_{ji},j=1,2,i=1,2...,m_{j}\) from WIED.
-
iii.
As soon as the first failure item \(X_{j1:m_{j}:n_{j}:k_{j}}^{R_{j1}}\) in a group occurs, the group which includes that failure item, as well as \(R_{j1}\) groups are withdrawn at random from the \(n_{j}\) groups and as soon as the second failure item \(x_{j2:m_{j}:n_{j}:k_{j}}^{R_{j2}}\) in a group occurs, the group which includes that failure item, as well as \(R_{j2}\) groups are withdrawn at random from the remaining groups \(n_{j}-R_{j1}-1\) and so on until the \(m_{j}\)-th failure item \(x_{jmj:m_{j}:n_{j}:k_{j}}^{R_{jmj}}\) in a group occurs, the group which includes that failure item, as well as the remaining groups \(R_{jmj}\) are withdrawn and the test is terminated. It is noteworthy that in our study, \(m_{j}<n_{j}\), and additionally, \(R_{ji}\) are predetermined.
-
iv.
According to PFFC order statistics \(x_{j1:m_{j}:n_{j}:k_{j}}^{R_{j1}}<x_{j2:m_{j}:n_{j}:k_{j}}^{R_{j2}}<...<x_{jmj:m_{j}:n_{j}:k_{j}}^{R_{jmj}}\) with censoring schemes \(R_{ji}\) under CSPALT, the joint PDF for \(x_{j1:m_{j}:n_{j}:k_{j}}^{R_{j1}},x_{j2:m_{j}:n_{j}:k_{j}}^{R_{j2}},\ldots ,X_{j1:m_{j}:n_{j}:k_{j}}^{R_{j1}}\), \(j=1,2\) is given by
$$\begin{aligned}&f_{x_{j1:m_{j}:n_{j}:k_{j}}^{R_{j1}},x_{j2:m_{j}:n_{j}:k_{j}}^{R_{j2}},\ldots ,x_{jmj:m_{j}:n_{j}:k_{j}}^{R_{jmj}}}(x_{j1:m_{j}:n_{j}:k_{j}}^{R_{j1}},x_{j2:m_{j}:n_{j}:k_{j}}^{R_{j2}},\ldots ,x_{jmj:m_{j}:n_{j}:k_{j}}^{R_{jmj}})\nonumber \\&\quad = \prod \limits _{j=1}^{2}c_{j}k_{j}^{m_{j}}\prod \limits _{i=1}^{m_{j}}f_{j}\left( X_{ji:m_{j}:n_{j}:k_{j}}^{R_{ji}}\right) \left( 1-F_{j}\left( X_{ji:m_{j}:n_{j}:k_{j}}^{R_{ji}}\right) \right) ^{k_{j}\left( R_{ji}+1\right) -1}. \end{aligned}$$(5)
-
i.
It is clear that Eq. (5) can devolve into type-II censoring, progressive type-II censoring, first failure censoring, and complete sample as special cases.
2.2 Assumptions
-
1.
Under use conditions, the lifetimes of the items \(X_{j1:m_{j}:n_{j}:k_{j}}^{R_{j1}},i=1,2,\ldots ,m_{1}\) follow WIED with the Equations given in (1)-(4).
-
2.
Under accelerated conditions, the tested item hazard rate is increased to \( \mu H_{1}(x)\), where \(\mu \) is the acceleration factor satisfying \(\mu >1\). Consequently, the HRF, RF, CDF, and PDF can be written, respectively, as:
$$\begin{aligned} H_{2}(x)=\frac{\alpha \beta \lambda \mu }{x^{2}}\exp \left\{ \frac{\lambda }{x}\right\} \left( \exp \left\{ \frac{\lambda }{x}\right\} -1\right) ^{- \left( \beta +1\right) }, \end{aligned}$$(6)$$\begin{aligned} S_{2}(x)=\exp \left\{ -\int \limits _{0}^{x}H_{2}(z)\right\} dz=\exp \left\{ -\alpha \mu \left( \exp \left\{ \frac{\lambda }{x}\right\} -1\right) ^{-\beta }\right\} , \end{aligned}$$(7)$$\begin{aligned} F_{2}(x)=1-\exp \left\{ -\alpha \mu \left( \exp \left\{ \frac{\lambda }{x} \right\} -1\right) ^{-\beta }\right\} , \end{aligned}$$(8)and
$$\begin{aligned} f_{2}(x)=\frac{\alpha \beta \lambda \mu }{x^{2}}\left( \exp \left\{ \frac{ \lambda }{x}\right\} -1\right) ^{-\left( \beta +1\right) }\exp \left\{ \frac{ \lambda }{x}-\alpha \mu \left( \exp \left\{ \frac{\lambda }{x}\right\} -1\right) ^{-\beta }\right\} . \end{aligned}$$(9) -
3.
The lifetimes of the items \(X_{ji:m_{j}:n_{j}:k_{j}}^{R_{ji}},j=1,2,i=1,2,\ldots ,m_{j}\) are statistically independent and identically distributed.
3 Maximum likelihood estimation
In this section, our interest is in obtaining ML estimators of the parameters in accordance with the data \(X_{ji:m_{j}:n_{j}:k_{j}}^{R_{ji}},j=1,2,i=1,2,\ldots ,m_{j}\) obtained under the PFFC scheme with CSPALT. To this end, the natural logarithm of the likelihood function without normalized constant can be reduced to the following expression:
where \(x_{ji}\) is used instead of \(X_{ji:m_{j}:n_{j}:k_{j}}^{R_{ji}}.\)
By setting the partial derivatives of Eq. (10) with respective to \(\alpha ,\beta ,\lambda ,\) and \(\mu \) to zero, the ML estimators can be obtained by solving the following likelihood equations:
and
It is noted that the non-linear Eqs. (11)–(14) cannot be solved analytically. Therefore, numerical methods such as the Newton–Raphson method are used.
3.1 Interval estimation
Making use of the asymptotic normality of the ML estimates, the ACIs of the parameters can be constructed via asymptotic variances that can be acquired from the inverse of the FIM which can be established according to the likelihood equations through the following form:
At times it is difficult to figure out an exact expression of Eq. (15), so the inverse of the FIM will be used without taking the expectation. Correspondingly, the asymptotic variance-covariance matrix (observed FIM) is expressed as
The required asymptotic variances for \(\hat{\alpha },\hat{\beta },\hat{\lambda },\) and \(\hat{\mu }\) can be extracted from the matrix (16). Hence, \(( \hat{\alpha },\hat{\beta },\hat{\lambda },\hat{\mu })\sim N[(\alpha ,\beta ,\lambda ,\mu ),\hat{I}^{-1}\left( \alpha ,\beta ,\lambda ,\mu \right) ]\) and it can be figured out \((1-\gamma )100\%,\) \((0<\gamma <1)\) two-sided ACIs for \(\psi =(\alpha ,\beta ,\lambda ,\mu )\) as
where \(Z_{\gamma /2}\) is the percentile of the standard normal distribution with right-tailed probability \(\gamma /2\).
Occasionally, the ACIs yield a negative lower bound even though the parameters are strictly non-negative. To conquer this obstacle, we used the delta method proposed by Greene (2000) and the logarithmic transformation discussed in Meeker and Escobar (1998) and Ren and Gui (2021). The asymptotic distribution of \(\ln \hat{\psi }\) is
where \(\overset{D}{\longrightarrow }\) indicates convergence in distribution and \(var(\ln \hat{\psi })=\frac{var(\hat{\psi })}{\hat{\psi }^{2}}= \frac{ \widehat{var(\hat{\psi })}}{\hat{\psi }^{2}}\)
Hence, the ACIs based on log-transformed ML estimates are
The accuracy and efficiency of the normal approximation of ML estimates may decrease if the sample size is not large enough. Therefore, in the next section, a resampling technique is provided to overcome the issue of constructing ACIs of the parameters in the presence of small sample sizes.
4 Bootstrap confidence intervals
Traditional statistical methods may struggle with small sample sizes, and therefore CIs based on the asymptotic results may not perform well. Parametric bootstrap addresses this issue by resampling from the estimated parametric distribution of the data, allowing for the generation of a large number of bootstrap samples. This process provides a means to estimate the sampling distribution of a statistic of interest. Consequently, CIs constructed using parametric bootstrap tend to be more reliable and accurate, especially when dealing with small samples. Two parametric bootstrap techniques are provided, one is Boot-p which is proposed by Efron (1982) and the other is Boot-t which is proposed by Hall (1988).
4.1 Parametric Boot-p
-
1.
Through the original data \(x_{j1:m_{j}:n_{j}:k_{j}}^{R_{j1}},x_{j2:m_{j}:n_{j}:k_{j}}^{R_{j2}},\ldots ,x_{jmj:m_{j}:n_{j}:k_{j}}^{R_{jmj}},j=1,2, \) compute \(\hat{\alpha },\hat{\beta },\hat{\lambda },\) and \(\hat{\mu }\) by maximizing the Eqs. (11–14).
-
2.
Utilize the censoring plan \((n_{j},m_{j},k_{j},R_{ji})\) and \((\hat{\alpha },\hat{\beta },\hat{\lambda },\hat{\mu })\) to generate a PFFC bootstrap sample \(x_{j1:m_{j}:n_{j}:k_{j}}^{*R_{j1}},x_{j2:m_{j}:n_{j}:k_{j}}^{*R_{j2}},\ldots ,x_{jmj:m_{j}:n_{j}:k_{j}}^{*R_{jmj}}.\)
-
3.
From \(x_{j1:m_{j}:n_{j}:k_{j}}^{*R_{j1}},x_{j2:m_{j}:n_{j}:k_{j}}^{*R_{j2}},\ldots ,x_{jmj:m_{j}:n_{j}:k_{j}}^{*R_{jmj}},\) compute bootstrap estimates which can be denoted by \(\hat{\varsigma }^{*}\) where \(\varsigma \) stands for \(\alpha ,\beta ,\lambda ,\)and \(\mu \) .
-
4.
Do steps (2) and (3) repeatedly for Nboot times to obtain \(\hat{\varsigma }_{1}^{*},\hat{\varsigma }_{2}^{*},\ldots ,\hat{\varsigma }_{Nboot}^{*}\).
-
5.
Sort \(\hat{\varsigma }_{j}^{*}\), \(j=1,2,\ldots ,Nboot\) ascendingly as \(\hat{\varsigma }_{(j)}^{*}\), \(j=1,2,\ldots ,Nboot\).
Let \(\psi _{1}(z)=P\) \((\hat{\varsigma }^{*}\le z)\) be the CDF of \(\hat{\varsigma }^{*}\). Define \(\hat{\varsigma }_{Boot-p}=\psi _{1}^{-1}(z)\) for given z. The approximate \(100(1-\gamma )\%\) Boot-p CI of \(\hat{\varsigma }\) is given by
4.2 Parametric Boot-t
1-3 Same as in parametric Boot-p.
-
4.
Compute \(I^{-1*}(\hat{\alpha }^{*},\hat{\beta }^{*},\hat{ \lambda }^{*},\hat{\mu }^{*})\) based on the asymptotic variance-covariance matrix (16).
-
5.
Compute the statistic \(\vartheta ^{*\varsigma }\) as:
$$\begin{aligned} \vartheta ^{*\varsigma }=\frac{(\hat{\varsigma }^{*}-\hat{\varsigma }) }{\sqrt{\widehat{var(\hat{\varsigma }^{*})}}}. \end{aligned}$$(21) -
6.
Reiterate Steps \(2-5\) Nboot times and obtain \(\vartheta _{1}^{*\varsigma },\vartheta _{2}^{*\varsigma },\ldots ,\vartheta _{Nboot}^{*\varsigma }.\)
-
7.
In ascending order, sort \(\vartheta _{j}^{*\varsigma },j=1,2,\ldots ,Nboot\) and obtain \(\vartheta _{(j)}^{*\varsigma },j=1,2,\ldots ,Nboot\).
Let \(\psi _{2}(z)=P\) \((\vartheta ^{*}\le z)\) be the CDF of \(\vartheta ^{*}\). For a given z, define
Thus, the approximate \(100(1-\gamma )\%\) Boot-t CI of \(\hat{\varsigma }\) is given by:
5 Bayesian estimation
In the inferential procedure, the Bayesian approach is distinguished from the frequentist approach in that it allows the incorporation of subjective prior information about life parameters which plays a pivotal and effective role in reliability analysis; additionally, it tends to use fewer sample data which makes it of great importance in expensive life tests. Now, we have to determine the appropriate prior distributions for the unknown parameters. Assume that \(\alpha \), \(\beta \), \(\gamma \), and \(\mu \) follow independent gamma prior distributions G1(a1, b1), G2(a2, b2), G3(a3, b3), and G4(a4, b4), respectively, because they have more flexibility in covering a large variety of prior beliefs. Since there is no prior information about the acceleration factor \(\mu \), the hyperparameters will be set to zero. Hence, the PDFs of the prior distributions can be formulated as:
The above positive hyperparameters \(a_{1},a_{2},a_{3},b_{1},b_{2},\) and \( b_{3}\) are selected to reflect prior knowledge about the unknown parameters. Hence, a technique to elicit the values of the hyperparameters is presented in in Subsect. 5.3. Now, the joint prior density can be formulated as follows:
Consequently, the joint posterior density can be formulated as follows:
Thus, the Bayesian estimate for a given function can be constructed through a given loss function.
5.1 Loss functions
Within the framework of Bayesian approach, the loss function plays a pivotal role in evaluating the degree of difference between the true and estimated values. Let \(\hat{\varkappa }\) refer to the estimation of \( \varkappa \). Thus, the loss function denoted by \(L(\hat{\varkappa },\varkappa )\) can be defined as a real-valued function satisfying \(L(\hat{\varkappa } ,\varkappa )\ge 0\) for all possible estimates \(\hat{\varkappa }\) and all \( \varkappa \). In other words, it can be said that the loss function equals the loss incurred if one of the estimates is \(\hat{\varkappa }\) when \(\varkappa \) is the true value of the parameter. The loss function can be divided into two types, symmetric and asymmetric.
5.1.1 Symmetric loss function
In practice, when the loss resulting from overestimation and underestimation is just as important, symmetric loss functions are preferred among which the SE loss function is well-known for its good mathematical properties which can be defined as
The Bayesian estimate of \(\varkappa \) under SE loss function is
Hence, the Bayesian estimate for a given function \(\varphi (\alpha ,\beta ,\lambda ,\mu )\) under SE loss function can be expressed as:
5.1.2 Asymmetric loss function
Sometimes, overestimation and underestimation can lead to various losses. Therefore, it is not appropriate in such cases to use symmetric loss functions; instead, asymmetric loss functions are used for the sake of making the Bayesian approach more practical and applicable. Among the asymmetric loss functions, the LX loss function is the dominant one, defined as:
The sign and size of c represent the orientation and degree of asymmetry, respectively. When \(c>0\), overestimation is more costly than underestimation and vice versa. As for c approaching zero, the LX loss function behaves approximately like the SE loss function and is therefore almost symmetric, for more details, see (Zellner 1986).
The Bayesian estimate for \(\varkappa \) under LX loss function is
Hence, the Bayesian estimate for a given function \(\varphi (\alpha ,\beta ,\lambda ,\mu )\) under LX loss function can be expressed as:
Obviously, the Bayesian estimates in the previous types of loss functions involve four integrals and cannot be constructed in closed forms. Therefore, the MCMC technique will be applied to derive such estimates.
5.2 MCMC technique
In realistic and complex statistical modeling, MCMC methodology provides valuable tools for Bayesian computations. One such tool that is considered to be the simplest and most widely used is the Gibbs sampling algorithm which was originally proposed by Geman and Geman (1984). The idea of this procedure is to draw samples from the conditional density of each variable. A more general procedure than Gibbs sampling is the Metropolis-Hastings (M-H) algorithm, originally presented by Metropolis et al. (1953) and Hastings (1970). In this procedure, samples can be drawn by making use of the conditional density and proposal distributions for each parameter of interest. Thereafter, by making use of drawn samples, Bayesian estimates can be computed and corresponding CRIs can also be established.
From (26), the joint posterior density can be reformulated as follows:
where \(\Upsilon _{j}=\left\{ \begin{array}{c} 1,\text { if }j=1, \\ \mu ,\text { if }j=2. \end{array} \right. \)
Thus, the conditional densities can be expressed as follows:
It is clear that Eqs. (34) and (37) represent gamma density. Thus, samples of \(\alpha \) and \(\mu \) can be easily drawn using any gamma-generating routines. On the other hand, Eqs. (35) and (36) do not represent well-known distributions. Consequently, employing the Gibbs sampler to generate samples is not appropriate; instead, the M-H algorithm is utilized to implement the MCMC methodology. The hybrid procedure involving Gibbs sampling and the M-H algorithm will be run in the following steps:
-
1.
Initialize with \((\alpha ^{(0)}=\hat{\alpha }_{ML},\beta ^{(0)}= \hat{\beta }_{ML},\lambda ^{(0)}=\hat{\lambda }_{ML},\mu ^{(0)}=\hat{\mu } _{ML}) \) as an initial guess and set \(J=1\).
-
2.
Generate \(\alpha ^{(J)}\) from Gamma distribution \({\pi } _{1}^{*}{(\alpha |\beta }^{(J-1)}{,\lambda }^{(J-1)} {,\mu }^{(J-1)}{,}\underline{x}{).}\)
-
3.
Generate \(\mu ^{(J)}\) from Gamma distribution \({\pi } _{4}^{*}{(\mu |\alpha }^{(J)}{,\beta }^{(J-1)}{,\lambda }^{(J-1)}{,}\underline{x}{).}\)
-
4.
Activating the M-H algorithm, generate \(\beta ^{(J)}\) and \( \lambda ^{(J)}\) from Eqs. (35) and (36) with normal proposal distributions \(N( \beta ^{( J-1) },Var( \hat{\beta })) \) and \(N( \lambda ^{( J-1) },Var( \hat{\lambda }) ) \), respectively.
-
5.
Record \(\alpha ^{(J)},\beta ^{(J)},\lambda ^{(J)}\) and \(\mu ^{(J)}.\)
-
6.
Set \(J=J+1\).
-
7.
Reiterate steps \(2-6\) N times.
-
8.
Remove B (the number of iterative values before achieving the stationary distribution) as burn-in period and derive the Bayesian estimates \(\hat{\Omega }_{SE}\) and \(\hat{\Omega }_{LX}\) of \(\Omega \) under SE and LX loss functions, respectively, by
$$\begin{aligned} \ \hat{\Omega }_{SE}= & {} \frac{1}{N-B}\sum _{J=B+1}^{N}\Omega ^{\left( J\right) }. \end{aligned}$$(38)$$\begin{aligned} \hat{\Omega }_{LX}= & {} \frac{-1}{c}Log\left( \frac{1}{N-B}\sum _{J=B+1}^{N}e^{-c \Omega ^{\left( J\right) }}\right) ,\text { where }c\ne 0. \end{aligned}$$(39)where \(\Omega \) stands for \(\alpha ,\beta ,\lambda ,\) and \(\mu .\)
-
9.
To establish two-sided CRIs of \(\Omega ,\) sort \(\hat{\Omega } ^{(J)},J=B+1,B+2,\ldots ,N\) in ascending order as \(\left\{ \hat{\Omega }^{(1)}< \hat{\Omega }^{(2)}<...<\hat{\Omega }^{(N-B)}\right\} \). Hence, \((1-\gamma )100\%\) Bayesian two-sided CRIs of \(\Omega \) can be constructed as:
$$\begin{aligned} \left[ \Omega _{((N-B)\gamma /2)},\Omega _{((N-B)(1-\gamma /2))}\right] . \end{aligned}$$(40)
5.3 Hyperparameters elicitation technique
In Bayesian inference, prior distributions are generally classified as informative and non-informative according to the values of the hyperparameters. In terms of non-informative prior distributions, the hyperparameters are selected to be equal or approach zero while regarding informative prior distributions, the hyperparameters can be elicitated from the following technique:
-
1.
Obtain n number of samples from WIED under normal and accelerated conditions.
-
2.
Calculate the associated ML estimates \((\hat{\alpha }^{j},\hat{ \beta }^{j},\hat{\lambda }^{j}),j=1,2,\ldots ,n.\)
-
3.
Calculate the mean and variance of \((\hat{\alpha }^{j},\hat{\beta }^{j},\hat{\lambda }^{j}),j=1,2,\ldots ,n\) as
$$\begin{aligned} \frac{1}{n}\sum _{j=1}^{n}\hat{\Theta }^{j},\quad \frac{1}{n-1}\sum _{j=1}^{n}\left( \hat{\Theta }^{j}-\frac{1}{n} \sum \limits _{i=1}^{n}\hat{\Theta }^{i}\right) ^{2}. \end{aligned}$$(41)where \(\Theta \) stands for \(\alpha ,\beta ,\) and \(\lambda \).
-
4.
Calculate the mean and variance of the considered priors, which, in our case, are the gamma prior \(\pi (\Theta )\propto \Theta ^{h_{1}-1}\exp \left\{ -h_{2}\Theta \right\} \) where for \(\Theta =\alpha \) we have \( h_{1}=a_{1},h_{2}=b_{1},\) for \(\Theta =\beta \) we have \( h_{1}=a_{2},h_{2}=b_{2},\) and for \(\Theta =\lambda \) we have \( h_{1}=a_{3},h_{2}=b_{3}.\)
-
5.
Equate the mean and variance of \(\hat{\Theta }^{j},j=1,2,\ldots ,n\) with the mean and variance of the gamma priors and solve the equations, hence, the estimated hyperparameters can be derived from the following forms:
$$\begin{aligned} h_{1}=\frac{\left( \frac{1}{n}\sum _{j=1}^{n}\hat{\Theta }^{j}\right) ^{2}}{ \text {\ }\frac{1}{n-1}\sum _{j=1}^{n}\left( \hat{\Theta }^{j}-\frac{1}{n} \sum \limits _{i=1}^{n}\hat{\Theta }^{i}\right) ^{2}}, \quad h_{2}=\frac{\frac{1}{n}\sum _{j=1}^{n}\hat{\Theta }^{j}}{\text { } \frac{1}{n-1}\sum _{j=1}^{n}\left( \hat{\Theta }^{j}-\frac{1}{n} \sum \limits _{i=1}^{n}\hat{\Theta }^{i}\right) ^{2}}. \end{aligned}$$(42)
Such a technique has been used by Dey et al. (2016).
6 Simulation study
In attempts to evaluate the performance of the proposed methods, some computations are performed in accordance with Monte Carlo simulation experiments utilizing (MATHEMATICA ver. 12.0). In light of the proposed algorithm mentioned in Balakrishnan and Sandhu (1995) with the distribution function \(1-\left( 1-F(x)\right) ^{k},\) 1000 PFFC samples were generated under both normal and acceleration conditions from WIED with the parameters \( \alpha =0.5,\beta =1,\lambda =0.6,\) and \(\mu =1.5\). The performance of the estimates derived for \(\alpha ,\beta ,\lambda ,\) and \(\mu \) from different proposed methods (ML estimation, two parametric bootstraps, and MCMC technique) is compared in terms of point and interval estimates. To this end, the average estimate (AE) and mean square error (MSE) are considered for point estimates while the average width (AW) and coverage probability (CP) are considered for interval estimates.
In order to conduct our study, distinct combinations of \(k_{1}=k_{2}=k\) (group size), different values of \(n_{1}=n_{2}=n\) (number of groups), and \( m_{j},j=1,2\) (observed data) are taken into account with different censoring schemes (CSs) \(R_{j},j=1,2\). For convenience, three types of CSs are considered:
CS I: \(\ R_{j}=\left( n-m_{j},0^{*m_{j}-1}\right) .\)
CS II: \(R_{j(m_{j}/2)}=n-m_{j},\) \(R_{ji}=0\) for\(\ i\ne m_{j}/2\) if \(m_{j}\) even; \(R_{j((m_{j}+1)/2)}=n-m_{j},\) \(R_{ji}=0\) for \(i\ne (m_{j}+1)/2\) if \(m_{j}\) odd.
CS III: \(R_{j}=\left( 0^{*m_{j}-1},n-m_{j}\right) .\)
In this work, informative priors are adopted in which the hyperparameters are selected in accordance with the mentioned technique in Subsect. 5.3 as \(a_{1}=8.2750,\) \(b_{1}=13.0085,a_{2}=59.1713,\) \(b_{2}=62.5731,\) \( a_{3}=18.3662\), and \(b_{3}=26.1601\) and inserted to compute the required estimates. Besides, the MCMC technique is reiterated 30, 000 times with the first 5, 000 times discarded as a sufficient burn-in period to erase the effect of the initial values. The simulation results are shown in Tables 1, 2, 3, 4, 5, 6, 7 and 8 , according to which we note the following:
-
1.
For fixed n, the MSEs and AWs of all parameters tend to decrease as the effective sample size \(m_{j}\) gets larger.
-
2.
With n and \(m_j\) keeping invariant but k increases, the MSEs have no obvious trend on the whole.
-
3.
MCMC technique has the best performance compared to the rest methods in terms of MSEs.
-
4.
Between two loss functions, LX loss function with \(c=0.5\) is the best mode for \( \alpha ,\lambda \), and \(\mu \), in contrast, LX loss function with \(c=-0.5\) is the best mode for \(\beta \), all based on the smallest MSEs.
-
5.
Overall, MCMC CRIs are the most satisfactory because they have the narrowest width.
-
6.
Scheme I often performs better than the rest schemes with regard to the MSEs and AWs.
7 Practical data analysis
In this part, authentic data sets that represent observed failure times in life testing of a light-emitting diode (LED) are used to display and illustrate the performance of the proposed inferential methods. These data were originally analyzed by Cheng and Wang (2012) and recently by Dey et al. (2022). Table 9 shows the complete observed failure samples generated under normal and accelerated conditions.
To test the degree of fit between WIED and the data mentioned in Table 9, the Kolmogorov-Smirnov (K-S) test statistic is used. Through computations, the K–S distances and their corresponding p-value (.) under normal use and accelerated conditions are obtained, respectively, as 0.0934(0.6564) and 0.0921(0.6738). Based on the calculated p-values, we can conclude that the WIED fits perfectly with these data. For further illustration, Figures 2 and 3 display the empirical cumulative distributions with the fitted survival functions. By implementing the procedure characterized in Sect. 2 on the original data mentioned in Table 9, PFFC samples are obtained within the CSPALT framework. All details are provided in Table 10. Besides, Figure 1 shows the PDFs under both normal use and accelerated stress conditions. The ML, Boot-p, and Boot-t point estimates, along with their corresponding CIs, are obtained. For Bayesian estimation, informative priors are adopted where the hyperparameters are selected as \( a_{1}=14.3403,b_{1}=85.5635,a_{2}=165.31,b_{2}=141.36,a_{3}=35.1201,\) and \( b_{3}=82.4022\) based on the mentioned technique in Subsect. 5.3. Furthermore, the chain was run for 30, 000 iterations, with the initial 5, 000 values discarded as ’burn-in’, which is deemed adequate for eliminating the influence of the initial values. Bayesian point estimates are computed under both SE and LX loss functions with various values of the parameter c; moreover, \(95\%\) CRIs are also constructed. All results of point and interval estimates are presented in Tables 11 and 12. It is clear that Boot-t CIs and CRIs are the narrowest, while ACIs and Boot-p CIs are the widest, and therefore the worst in terms of interval lengths. Figures 4 and 5 display trace plots of the parameters generated by the MCMC approach and the associated histograms, respectively.

PDFs under normal and accelerated conditions

Fitness of real data obtained under normal condition

Fitness of real data obtained under accelerated condition
8 Conclusive remarks
In this article, the statistical inference of WIED in the presence of CSPALT under the PFFC is highlighted. This combination makes our research more practical and applied in industrial and engineering fields by saving time, the number of test units and thus cost. Throughout this paper, several methods are developed to estimate the interested parameters of WIED. For classical estimation, ML estimates are acquired and the associated ACIs are established by making use of the observed FIM. Besides, two parametric bootstrap models (Boot-p and Boot-t) for point and interval estimates are also presented for comparison purposes. For Bayesian estimation, point and interval estimates are constructed with the help of the MCMC technique due to the difficulty of producing Bayesian estimates in closed form. Via extensive Monte Carlo simulations, the performance of the proposed methods is investigated. According to the results, Boot-t and Bayesian estimates demonstrate superior performance and accuracy compared to conventional likelihood and Boot-p estimates. Furthermore, employing the proposed hyperparameters elicitation technique enhances the efficiency and effectiveness of Bayesian estimates relative to other methods. Finally, one set of real engineering data is analyzed to demonstrate the applicability of the study.

Trance plots of \(\alpha \), \(\beta \), \(\lambda \) and \(\mu \) obtained from MCMC approach
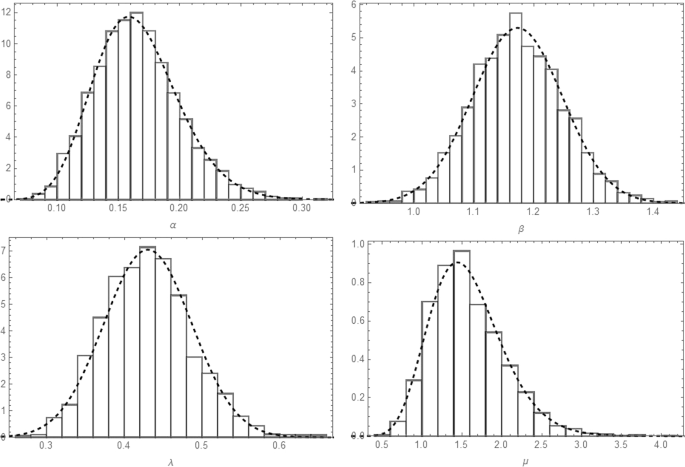
Histograms of \(\alpha \), \(\beta \), \(\lambda \) and \(\mu \) obtained from MCMC approach
Abbreviations
- ACIs:
-
Asymptotic confidence intervals
- AE:
-
Average estimate
- ALTs:
-
Accelerated life tests
- AW:
-
Average width
- Boot-p:
-
Bootstrap-p
- Boot-t:
-
Bootstrap-t
- CDF:
-
Cumulative distribution function
- CIs:
-
Confidence intervals
- CP:
-
Coverage probability
- CRIs:
-
Credible intervals
- CSPALT:
-
Constant-stress partially accelerated life test
- CSs:
-
Censoring schemes
- FIM:
-
Fisher information matrix
- HRF:
-
Hazard rate function
- K-S:
-
Kolmogorov-Smirnov
- LED:
-
Light-emitting diode
- LX:
-
Linear exponential
- MCMC:
-
Markov chain Monte Carlo
- M-H:
-
Metropolis-Hastings
- ML:
-
Maximum likelihood
- MSE:
-
Mean square error
- PALTs:
-
Partially accelerated life tests
- PDF:
-
Probability density function
- PFFC:
-
Progressive first-failure censoring
- RF:
-
Reliability function
- SE:
-
Squared error
- WIED:
-
Weibull inverted exponential distribution
References
Abdel-Hamid Alaa H, Al-Hussaini Essam K (2007) Progressive stress accelerated life tests under finite mixture models. Metrika 66(2):213–231
Abushal Tahani A, Soliman Ahmed A (2015) Estimating the pareto parameters under progressive censoring data for constant-partially accelerated life tests. J Stat Comput Simul 85(5):917–934
Akgul FG, Keming Yu, Senoglu B (2020) Classical and bayesian inferences in step-stress partially accelerated life tests for inverse weibull distribution under type-i censoring. Strength Mater 52(3):480–496
Ali A, Almarashi Abdullah M, Hassan O, Tony NHK (2020) E-bayesian estimation of chen distribution based on type-i censoring scheme. Entropy 22(6):636
Arnold Z (1986) Bayesian estimation and prediction using asymmetric loss functions. J Am Stat Assoc 81(394):446–451
Balakrishnan N, Donghoon H (2008) Exact inference for a simple step-stress model with competing risks for failure from exponential distribution under type-ii censoring. J Stat Plann Inference 138(12):4172–4186
Balakrishnan N, Sandhu RA (1995) A simple simulational algorithm for generating progressive type-ii censored samples. Am Stat 49(2):229–230
Bingxing W (2006) Unbiased estimations for the exponential distribution based on step-stress accelerated life-testing data. Appl Math Comput 173(2):1227–1237
Bradley E (1982) The jackknife, the bootstrap and other resampling plans. SIAM, Philadelphia
Chandrakant RMK, Tripathi YM (2018) On a weibull-inverse exponential distribution. Annal Data Sci 5(2):209–234
Chien-Tai L, Yao-Yu H, Siao-Yu L, Balakrishnan N (2019) Inference on constant stress accelerated life tests for log-location-scale lifetime distributions with type-i hybrid censoring. J Stat Comput Simul 89(4):720–749
Debasis K, Hatem H (2010) Bayesian inference and prediction of the inverse weibull distribution for type-ii censored data. Comput Stat Data Anal 54(6):1547–1558
Greene William H (2000) Econometric analysis, 4th edn. Prentice Hall, International edition, New Jersey, pp 201–215
Hassan Amal S, Nassr Said G, Sukanta P, Maiti Sudhansu S (2020) Estimation in constant stress partially accelerated life tests for weibull distribution based on censored competing risks data. Annal Data Sci 7(1):45–62
Huizhong L, Liang W, Yuhlong L, Sanku D (2023) Estimation of matusita measure between generalized inverted exponential distributions under progressive first-failure censored data. J Comput Appl Math 421:114836
Ismail Ali A (2016) Statistical inference for a step-stress partially-accelerated life test model with an adaptive type-i progressively hybrid censored data from weibull distribution. Stat Papers 57(2):271–301
Ismail Ali A, Al-Babtain AA (2015) On studying partially accelerated life tests under progressive stress. J Test Eval 43(4):897–905
Junru R, Wenhao G (2021) Inference and optimal censoring scheme for progressively type-ii censored competing risks model for generalized rayleigh distribution. Comput Stat 36(1):479–513
Keith HW (1970) Monte carlo sampling metho ds using markov chains and their applications. Biometrika 57(1):97–109
Kumar MA, Sanku D, Mani TY (2020) Statistical inference on progressive-stress accelerated life testing for the logistic exponential distribution under progressive type-ii censoring. Qual Reliab Eng Int 36(1):112–124
Kumar MA, Mani TY, Wu S-J (2021) Statistical inference based on progressively type-ii censored data from the burr x distribution under progressive-stress accelerated life test. J Stat Comput Simul 91(2):368–382
Lei G, Wenhao G (2018) Statistical inference of the reliability for generalized exponential distribution under progressive type-ii censoring schemes. IEEE Trans Reliab 67(2):470–480
Meeker William Q, Escobar Luis A (1998) Statistical methods for reliability data. Wiley, New York
Nelson Wayne B (2009) Accelerated testing: statistical models, test plans, and data analysis. John Wiley & Sons
Nicholas M, Rosenbluth Arianna W, Rosenbluth Marshall N, Teller Augusta H, Edward T (1953) Equation of state calculations by fast computing machines. J Chem Phys 21(6):1087–1092
Nooshin H (2021) Comparison between constant-stress and step-stress accelerated life tests under a cost constraint for progressive type i censoring. Sequent Anal 40(1):17–31
Peter H (1988) Theoretical comparison of bootstrap confidence intervals. Annal Stat 16(3):927–953
Rashad E-SM (2018) Estimation of parameters of weibull-gamma distribution based on progressively censored data. Stat Papers 59(2):725–757
Sajid A, Muhammad A (2013) Choice of suitable informative prior for the scale parameter of mixture of laplace distribution using type-i censoring scheme under different loss function. Electron J Appl Stat Anal 6(1):32–56
Sanku D, Mazen N (2020) Generalized inverted exponential distribution under constant stress accelerated life test: Different estimation methods with application. Qual Reliab Eng Int 36(4):1296–1312
Sanku D, Sukhdev S, Mani TY, Asgharzadeh A (2016) Estimation and prediction for a progressively censored generalized inverted exponential distribution. Stat Methodol 32:185–202
Sanku D, Liang W, Mazen N (2022) Inference on nadarajah-haghighi distribution with constant stress partially accelerated life tests under progressive type-ii censoring. J Appl Stat 49(11):2891–2912
Singh S, Tripathi YM (2015) Reliability sampling plans for a lognormal distribution under progressive first-failure censoring with cost constraint. Stat Papers 56:773–817
Stuart G, Donald G (1984) Stochastic relaxation, gibbs distributions, and the bayesian restoration of images. IEEE Trans Pattern Anal Mach Intell 6:721–741
Wu S-J, Coşkun K (2009) On estimation based on progressive first-failure-censored sampling. Comput Stat Data Anal 53(10):3659–3670
Wu M, Wenhao G (2021) Estimation and prediction for nadarajah-haghighi distribution under progressive type-ii censoring. Symmetry 13(6):999
Xiaolin S, Yimin S (2021) Inference for inverse power lomax distribution with progressive first-failure censoring. Entropy 23(9):1099
Ying X, Wenhao G (2020) Statistical inference of the lifetime performance index with the log-logistic distribution based on progressive first-failure-censored data. Symmetry 12(6):937
Yung-Fu C, Fu-Kwun W (2012) Estimating the burr xii parameters in constant-stress partially accelerated life tests under multiple censored data. Commun Stat Simul Comput 41(9):1711–1727
Acknowledgements
The authors would like to express their thanks to the editors and referees for their valuable comments and suggestions that significantly improved the paper.
Funding
Open access funding provided by The Science, Technology & Innovation Funding Authority (STDF) in cooperation with The Egyptian Knowledge Bank (EKB).
Author information
Authors and Affiliations
Corresponding author
Additional information
Publisher's Note
Springer Nature remains neutral with regard to jurisdictional claims in published maps and institutional affiliations.
Rights and permissions
Open Access This article is licensed under a Creative Commons Attribution 4.0 International License, which permits use, sharing, adaptation, distribution and reproduction in any medium or format, as long as you give appropriate credit to the original author(s) and the source, provide a link to the Creative Commons licence, and indicate if changes were made. The images or other third party material in this article are included in the article's Creative Commons licence, unless indicated otherwise in a credit line to the material. If material is not included in the article's Creative Commons licence and your intended use is not permitted by statutory regulation or exceeds the permitted use, you will need to obtain permission directly from the copyright holder. To view a copy of this licence, visit http://creativecommons.org/licenses/by/4.0/.
About this article

Cite this article
Fathi, A., Farghal, AW.A. & Soliman, A.A. Inference on Weibull inverted exponential distribution under progressive first-failure censoring with constant-stress partially accelerated life test. Stat Papers (2024). https://doi.org/10.1007/s00362-024-01583-9
Received:
Revised:
Published:
DOI: https://doi.org/10.1007/s00362-024-01583-9