
Abstract
Purpose
To identify independent imaging features and establish a diagnostic algorithm for diagnosis of cystic fibrosis (CF)-associated liver disease (CFLD) in CF patients compared to controls using gadoxetic acid-enhanced MRI.
Methods
A total of 90 adult patients were enrolled: 50 with CF, 40 controls. The CF group was composed of two subgroups: a retrospective test subgroup (n = 33) and a prospective validation subgroup (n = 17). Controls (patients with normal liver enzymes and only benign focal liver lesions) were divided accordingly (27:13). MRI variables, including quantitative and qualitative parameters, were used to distinguish CFLD from controls using clinical symptoms, laboratory tests and Debray criteria. Disease severity was classified according to Child-Pugh and Albumin-Bilirubin (ALBI) scores. Fifteen qualitative single-lesion CF descriptors were defined. Two readers independently evaluated the images. Univariate statistical analysis was performed to obtain significant imaging features that differentiate CF patients from controls. Through multivariate analysis using chi-squared automatic interaction detector (CHAID) methodology the most important descriptors were identified. Diagnostic performance was assessed by receiver-operating characteristic (ROC) analysis.
Results
Three independent imaging descriptors distinguished CFLD from controls: (1) presence of altered gallbladder morphology; (2) periportal tracking; and (3) periportal fat deposition. Prospective validation of the classification algorithm demonstrated a sensitivity of 94.1% and specificity of 84.6% for discriminating CFLD from controls. Disease severity was well associated with the imaging features.
Conclusions
A short unenhanced MRI protocol can identify the three cardinal imaging features of CFLD. The hepatobiliary phase of gadoxetic acid-enhanced MRI can define CFLD progression.
Key Points
• Using a multivariate classification analysis, we identified three independent imaging features, altered gallbladder morphology (GBAM), periportal tracking (PPT) and periportal fat deposition (PPFD), that could diagnose CFLD with high sensitivity, 94.1 % (95% CI: 71.3–99.9) and moderate specificity, 84.6 % (95% CI: 54.6–98.1).
• Based upon the results of this study, gadoxetic acid-enhanced MRI with DWI is able to diagnose early-stage CFLD, as well as its progression.
Introduction
Cystic fibrosis (CF) is one of the most common, lethal, autosomal recessive diseases of the Caucasian population. CF may affect any mucous-dependent organ, primarily the respiratory and digestive tracts [1]. So-called cystic fibrosis-associated liver disease (CFLD) may progress to end-stage liver cirrhosis, requiring curative liver transplantation [2]. CFLD, one of the cholestatic liver diseases, has been observed in up to 35% of CF patients during long-term follow-up [3]. Due to lung transplantation and optimised medical care, the survival of CF patients has improved [4, 5], such that CFLD is now considered the third leading cause of death, after primary lung disease and post-transplantation complications [6]. Therefore, early diagnosis of CFLD is crucial as some centres may initiate UDCA treatment as early as possible to improve liver function [7]. Unfortunately, both clinical and biochemical findings have low sensitivity and specificity for CFLD [8]. Likewise, data on the features of early-stage CFLD are still in rudimentary development. Ultrasound (US) or computed tomography (CT) can depict only the morphologic features of CFLD at very advanced stages [9]. Conventional magnetic resonance imaging (MRI), including MR cholangiopancreaticography (MRCP), is useful for assessing the hepatobiliary complications of CF. In previous studies, a wide range of hepatobiliary manifestations from hepatomegaly and diffuse fatty liver infiltration to severe cirrhosis with portal hypertension have been described [10]. Furthermore, biliary manifestations including strictures of intra- and extrahepatic bile ducts [11], as well as altered gallbladder morphology, such as cholelithiasis, sludge, micro- and macro-gallbladder have also been reported [9]. More recently, MRI techniques have been introduced, such as diffusion-weighted imaging (DWI) and hepatobiliary gadoxetic acid-enhanced MRI, which are increasingly used in hepatobiliary imaging [12]. Gadoxetic acid-enhanced MRI detects focal liver lesions and also provides information about regional and global function of the hepatobiliary system [13]. DWI, because of its inherent ability to detect subtle changes in hepatobiliary tissue [14], would be expected to detect CFLD at very early stages.
Our study aim was to identify independent imaging features and establish a diagnostic algorithm for the diagnosis of CFLD as compared with a control group using gadoxetic acid-enhanced MRI.
Patients and methods
The ethics review board of our institution approved the prospective and retrospective data collection and analysis. However, informed consent was obtained only from the prospective group patients. The requirement for informed consent was waived for the retrospective group. The study cohort was determined from our institutional database as shown in the flow chart (Fig. 1).
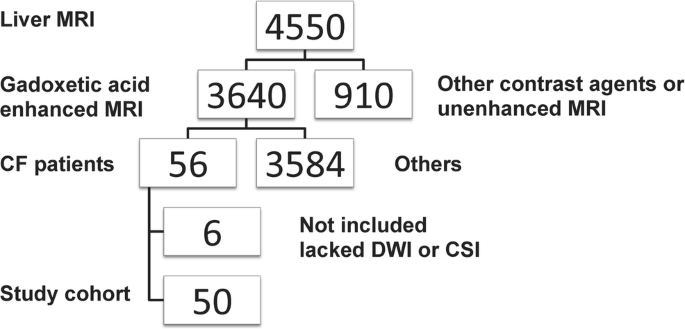
Flowchart: between 2011 and 2015, 3,640 patients underwent a standardized 3.0-Tesla gadoxetic acid-enhanced MRI of the liver. Fifty-six patients with cystic fibrosis (CF) were enrolled. Due to lack of diffusion-weighted imaging (DWI) or chemical shift imaging (CSI) we excluded six patients. Therefore, the final study cohort consisted of 50 patients
A total of 90 adult patients were included, 50 with CF and 40 controls who were examined using identical parameters. From October 2011 to November 2013 we retrospectively enrolled 33 consecutive patients with CF, at any stage. We then gathered 27 consecutively liver-healthy controls who had an MRI for the diagnostic work-up of benign focal liver lesions. The controls had no further hepatobiliary abnormalities or elevated liver enzymes. These 60 patients from the retrospective CF group and controls were used as a training cohort.
From February 2014 to March 2015, we enrolled another 17 CF patients and 13 consecutive liver-healthy controls prospectively to validate the classification algorithm established with the training cohort. All control patients were gathered between March 2010 and December 2014. The retrospective and prospective CF groups were selected by the hepatologists after excluding other liver diseases.
They were sent to MRI due to inconclusive ultrasound screening. In all patients an identical gadoxetic acid-enhanced MRI protocol with DWI was applied. CFLD was defined by our hepatologists according to clinical symptoms, laboratory tests and Debray criteria [15].
In all patients, diagnosis of CF was definitively confirmed by our hepatologists. CF was diagnosed according to international criteria [16]. In addition, the majority of study patients had already had a double lung transplant for CF-associated lung disease at the time of study inclusion.
To estimate the severity of liver disease we used the Child-Pugh Score (CPS) for patients with cirrhosis [17], and the Albumin-Bilirubin (ALBI) score [18] for all patients.
Liver function tests, including serum bilirubin level, alkaline phosphatase (ALP), gamma-glutamyltransferase (GGT), aspartate aminotransferase (AST), alanine aminotransferase (ALT) and thrombocytes, were evaluated within 3 months of the MRI investigations. Clinical data for CF and controls were documented.
MRI examination protocol
All MRI examinations were performed on a single 3-T MRI system (Magnetom TrioTim, Siemens Medical Systems, Erlangen, Germany). The MR imaging protocol is depicted on Table 1.
All patients received a bolus injection of 0.025 mmol/kg/body weight gadoxetic acid (gadolinium ethoxybenzyl diethylenetriaminepentaacetic acid, Gd-EOB-DTPA, Primovist® Bayer) into a cubital or antecubital vein at 1 ml/s, followed by a 20-ml saline flush using a power injector.
Image analysis
All MR images were reviewed on a commercial PACS system independently by two observers. Two radiologists, one with more than 20 years of experience in abdominal MR imaging (AB), the other in the sixth training year (SP), randomly evaluated the retrospective and prospective CF and control group patient images. Both observers were blinded to the subgroup, the pathological diagnosis and the clinical data. For training purposes, the readers jointly reviewed 20 sample MRI cases of patients with CF (n=10) and control patients (n=10) who were not included in this cohort study. The inter-observer variability was calculated.
Quantitative and qualitative assessment was performed.
Quantitative assessment
Liver and spleen volumes were calculated by measuring the maximum dimension of the liver and spleen in three perpendicular axes: craniocaudal (CC), latero-lateral (LL) and antero-posterior (AP) [19]. In addition, the portal vein diameter was measured for each patient and a diameter above 12 mm was defined as abnormal [20].
The signal intensity (SI) in the left liver lobe, and in liver segments VI, VII and VIII were obtained and the relative liver enhancement (RLE) was calculated by measuring the SI in the left liver lobe and in segments VI, VII and VIII in unenhanced T1-weighted images, as well as the T1-weighted images, 20 min after the administration of gadoxetic acid in the HBP using the following formula:
Furthermore, the SI of the spleen on in- and opposed-phase images was measured to calculate the corrected chemical shift imaging (CSI) hepatic fat fraction [21].
All quantitative assessments were performed by both readers in consensus.
Qualitative assessment
For the qualitative assessment, we scored the presence or absence of distinct qualitative MRI features, some taken from the literature [22, 23], as well as those from our longstanding clinical experience in MRI liver imaging.
A total of 15 qualitative features representing diffuse and focal liver changes on distinct MR-sequences were rated as present =1 or absent =0, including: 1 – diffuse steatosis, 2 – periportal fat deposition (PPFD) (a linear periportal SI decrease on opposed-phase compared to in- phase), 3 – periportal tracking (PPT) on DWI (a linear periportal increase in signal intensity), 4/5 – bile duct abnormalities (BDA) on T2-weighted/MRCP images and T1-weighted post-contrast images (irregularities of either stenosis or segmental dilatation or both), 6 /7 – heterogeneous liver parenchyma on DWI or and T1-weighted post contrast images, 8 – the degree of hepatobiliary uptake (this was evaluated both quantitatively by measuring the relative liver enhancement and qualitatively by visual impression in comparison to the kidney – brighter, equal or less bright), 9 – timely hepatobiliary excretion (presence of the contrast media in the common bile duct or even in the duodenum within 20 min after administration of contrast media (CM) was defined as timely excretion), 10 – altered gallbladder morphology (GBAM) (this includes micro-, macro-gallbladder, sludge and/or the presence of stones), 11 – periportal fibrosis (PPF) (means linear periportal decrease in signal intensity on DWI), 12 – the presence of regenerative nodular hyperplasia (RNH), 13 – widening of the fissures and hilum [24], 14 – portal vein dilatation (the portal vein diameter was measured on the pv post-contrast images), and 15 – the presence of lymph nodes in the hepatoduodenal ligament.
Statistical analysis
Statistical analysis was performed using the IBM SPSS version 22.0 and the MedCalc statistical software version 15.4 for Windows.
Descriptive statistics were calculated to describe the study sample and were expressed as mean, range and absolute numbers. Categorical univariate variables (15 single-feature descriptors) were expressed as count and proportions and analysed using univariate Chi-square and Fisher’s exact tests. Count variables were analysed and compared between groups using non-parametric Whitney-Mann-U tests.
Levels of interobserver agreement were assessed using Cohen's kappa statistics, as defined in a study by Landis and Koch. Significant variables (p < 0.05) at univariate analysis were used as input variables for Bonferroni-corrected, ten-fold, cross-validated multivariate classification analysis (Chi-squared Automated Interaction Detection Algorithm - CHAID) [25]. The minimal case number for parent nodes was set to ten, for child nodes to five. All CHAID analyses were performed using standard proprietary SPSS procedures.
First, the results of the retrospective cohort were obtained and then tested for the prospective cohort. The diagnostic accuracy of the classification tree was evaluated by receiver-operating characteristics (ROC) curve (AUC) analysis with 95% confidence intervals (Cis) using Medcalc.
Results
Demographic data
A total of 90 adult patients were enrolled, 50 with CF and 40 without liver disease (controls). The retrospective (test) CF subgroup (n = 33, mean age 30.3 ± 9.7 years) consisted of 15 male and 18 female patients. The prospective (validation) group (n = 17, mean age 35.8 ± 11.2 years) consisted of nine male and eight female patients (Table 2).
Clinical and laboratory parameters
Comparing the two CF subgroups to the controls, only the cholestatic parameters, i.e. ALP and GGT, were significantly higher in the CF groups (p< 0.05; CF vs. controls). The remaining liver function parameters were not significantly different between the two groups (Table 2).
From the 50 CF patients only eight patients showed liver cirrhosis according to the Child-Pugh score. There were three CPS A and three CPS B in the retrospective CF group and two CPS A in the prospective CF group. The remaining patients had no clinical evidence of liver cirrhosis. In the retrospective CF group, 25 patients were ALBI 1 and eight patients ALBI 2. In the prospective CF group, 13 patients had an ALBI 1 score, and four patients had an ALBI 2 score (Table 3).
Imaging parameters
Quantitative features univariate analysis
Our results showed that splenic volume was significantly higher in the two CF subgroups, as compared to the controls (p<0.05). The portal vein diameter (p=0.43) and liver volume (p=0.18) did not differ significantly. Likewise, the degree of hepatic steatosis (p=0.90) and the RLE (p=0.91) were not significantly different in either CF group compared to the controls (Table 4).
The MR imaging features of cirrhosis including periportal fibrosis, irregular liver margins and bile duct abnormalities in the hepatobiliary phase associated well with CPS. The CM-uptake as a functional parameter associated significantly with the ALBI score, which, again, was indicative of advanced liver disease (Table 3).
Qualitative features univariate analysis
As there was a very high inter-reader agreement using Cohen’s kappa (κ= 0.8), the qualitative assessment of the MR images of the more experienced reader was taken for further analysis. These showed significantly more patients with several distinct MR features in both the retrospective and prospective CF groups compared to the controls p < 0.001 (Table 5), but there were no essential differences between the CF subgroups p > 0.05.
Qualitative features multivariate analysis
Among the classification features, the resulting CHAID tree flow chart for the retrospective CF group (Fig. 5) determined three imaging descriptors that had highly statistically significant differences between CFLD patients and controls, namely: (1) the presence of altered gallbladder morphology (GBAM) (Fig. 2); (2) periportal tracking (PPT) seen on DWI (Fig. 3); and (3) periportal fat deposition (PPFD) seen on T1 chemical shift imaging (Fig. 4). Furthermore, GBAM was the initial splitting predictor, separating those with a high probability of CFLD from the control group (p= 0.001).

A 32-year-old male cystic fibrosis (CF) patient: axial and coronal T2-weighted images show an example of altered gallbladder morphology (GBAM), illustrated by a micro-gallbladder. The altered, distinctly shrunken gallbladder is well depicted on the T2-weighted axial and coronal images

In this 25-year-old male cystic fibrosis (CF) patient periportal tracking (PPT) is shown on the diffusion-weighted images, demonstrating a band-like hyperintense signal alteration along the portal triad. Bile duct abnormalities (BDA) are shown in the T2-weighted magnetic resonance cholangiopancreaticography images and in T1-weighted images, in the hepatobiliary phase (20 min after the administration of gadoxetic acid) by contour irregularities of the intrahepatic bile ducts

A 23-year-old male cystic fibrosis (CF) patient: T1-weighted in- and opposed-phase images demonstrate the periportal fat deposition (PPFD) as a band-like signal intensity loss on the opposed phase image compared to the in-phase image along the fissure of the porta hepatis
For the retrospective group, GBAM had a 96% PPV for CFLD. The PPV was 100% in those CF patients who had normal gallbladder morphology but PPT. The NPV was 96% for CFLD in those patients who did not have GBAM, PPT or PPFD. These three imaging predictors had a sensitivity of 97.0 % (95% CI: 84.2–99.9) and a specificity of 81.5 % (95% CI: 61.9–93.7) for the discrimination of CFLD from controls.
The prospective CF group confirmed the results of the retrospective CF group (Fig. 5). Likewise, GBAM was also the initial splitting predictor in the validation group, according to the CHAID tree flow chart. Fourteen of 17 CF patients had evidence of GBAM, as opposed to two of 13 in the control group (p = 0.0001). Two-thirds of CF patients with normal gallbladder morphology showed PPT whereas no control patients did. For the prospective/validation group, the PPV of GBAM for CFLD was 88%. Furthermore, the PPV was 100% if gallbladder morphology was normal but there were signs of PPT. The NPV was 92% for the diagnosis of CFLD if patients did not have GBAM, PPT or PPFD. In the validation group, these three imaging predictors had a sensitivity of 94.1 % (95% CI: 71.3–99.9) and a specificity of 84.6 % (95% CI: 54.6–98.1) for the discrimination of CFLD from normal patients.

(a) The results, obtained from the multivariate (CHAID-Chi-Squared Automated Interaction Detection Algorithm) analysis for the retrospective cystic fibrosis (CF) group, show three independent MR imaging predictors of cystic fibrosis-associated liver disease (CFLD): the presence of altered gallbladder morphology (GBAM), periportal tracking (PPT) on diffusion-weighted imaging (DWI), and periportal fat deposition (PPFD) on chemical shift imaging (CSI) in a tree flow chart. (b) The tree flow chart for the prospective group confirmed the results obtained from the retrospective group
Furthermore, the area under the ROC curves used to evaluate the diagnostic efficacy in distinguishing CFLD from the controls was 0.96 and 0.90 (Fig. 6) for the test and validation groups, respectively.
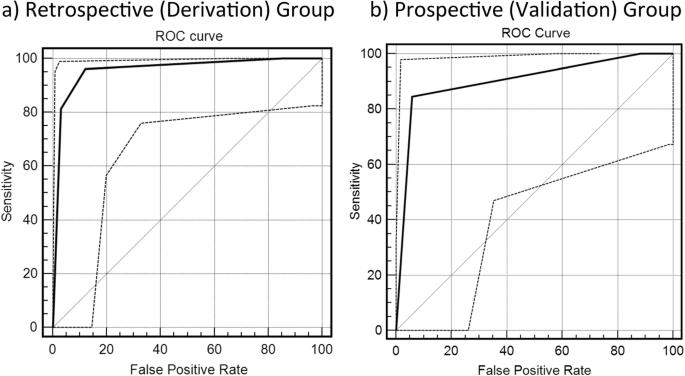
The area under the receiver-operating characteristic (ROC) curve used to evaluate the diagnostic efficacy in distinguishing cystic fibrosis-associated liver disease (CFLD) from the control group is 0.96 for the retrospective cystic fibrosis (CF) group (a) and 0.90 for the prospective/validation CF group (b)
Discussion
Our results obtained from the multivariate (CHAID) analysis showed that the most important and independent MR imaging predictors of CFLD are: (1) the presence of altered gallbladder morphology (GBAM); (2) periportal tracking (PPT) on DWI; and (3) periportal fat deposition (PPFD) on CSI. Using the CHAID statistical method, these three features, i.e. 1–3, also cited in previous studies [26,27,28,29], emphasise the fact that CFLD belongs to the group of cholestatic liver diseases [30]. Furthermore, the results from the retrospective cohort were validated by the prospective CF group.
GBAM, as described in the classic cholestatic liver disease PSC, turned out to be the highest-order discriminator between patients with CFLD and controls [32, 33].
In CFLD, the GB alterations have been considered to be due to defects in gallbladder motility and emptying [26, 27, 31]. We assume that CFLD patients have dysfunctional mucosa, which causes these changes either due to increased bile production and decreased biliary hydrophobicity or disrupted enterohepatic circulation of bile acids [31, 32].
The second-order predictors were PPT on DWI and the third PPFD on chemical shift imaging, respectively. Ductopenia, due to inflammation and oedema along the bile ducts or portal triad, results in wall thickening and fibrosis, which leads to vanishing duct syndrome, a pathognomonic feature of cholestatic liver diseases [33, 34]. Indeed, correlation of US with MR findings showed that periportal echogenicity is more often due to fat rather than fibrosis, as our findings confirmed (i.e. PPFD) [35]. Periportal tracking and periportal fat deposition are probably caused by geographic inflammation and oedema along the portal triad, again, characteristic for cholestatic liver diseases. As in PSC, the literature describes a range of intra- and extrahepatic biliary abnormalities for CFLD, including sludge, cholelithiasis, strictures, with or without cholangitis, and periductal fibrosis [36]. Although our results showed a high sensitivity (94.1%), the specificity was rather moderate (84.6 %), likely due to the fact that sludge and gallstones are so non-specific, and are also likely to be found in asymptomatic controls. Even by entering the statistically significant laboratory markers from the univariate analysis (ALP and GGT) to the multivariate analysis, there was no incremental value with regard to sensitivity and specificity.
However, in clinical practice, the presence of these imaging features (GBAM, PPT and PPFD), in combination with elevated ALP and GGT is extremely rare in healthy patients and highly suggestive of CFLD in CF patients.
Furthermore, these imaging features correlated well with ALP and GGT levels (p < 0.05) but not with the ALT and AST levels (p > 0.05), again underlining the cholestatic nature of CFLD. The lack of correlation of imaging findings with serum bilirubin levels (p > 0.05) is not surprising as bilirubin levels rise late in cholestatic liver diseases. This is, again, our explanation for the dissociation between the quantitative parameters, including liver volume, portal vein diameter and RLE. As for bilirubin, we would expect an increase in portal diameter or a decrease in RLE and liver volume only in very advanced CFLD. In early disease, the liver can still compensate. On the contrary, the splenic volume was the sole quantitative parameter that demonstrated significance (p < 0.05) [37]. We attribute this to either inflammatory/immunological changes or incipient, rather than significant, portal hypertension.
Although steatosis has been reported in up to 60% of CF patients [29] and is included in the Debray classification as one of the diagnostic criteria of CFLD, we found no significant hepatic fat fraction measured on CSI (p =0.30). This was expected, as there has been no proven relationship between steatosis and CFLD. When present, steatosis is likely a concomitant finding, either due to diabetes or medications [38]. Similarly, according to our results, hepatomegaly was not confirmed as a criterion of CFLD, which was not surprising since hepatomegaly as judged by clinical examination is known to be imprecise.
In general, CFLD is felt to be an emerging entity, Koh C. et al recently emphasized [39] the lack of sufficient characterisation and diagnostic tools for the diagnosis of adult-onset CFLD. They found that only 22% of CF patients had CFLD, based upon the Debray criteria, which they felt was likely an underestimation of actual disease.
Beyond finding an excellent sensitivity of MRCP [40] for depicting CFLD, we observed that none of the three imaging features (i.e. GBAM, PPT and PPFD) required CM administration for detection. However, gadoxetic acid-enhanced MRI simply improved detection of bile duct abnormalities and allowed us to evaluate liver function impairment based upon liver parenchymal enhancement in the hepatobiliary phase, i.e. 20 min after the injection of CM [41, 42].
The ALBI score associated well with the biomarkers of liver function derived from the uni- and multivariate analyses with regard to the severity of the disease, whereas the Child-Pugh score was associated only with the morphological changes including periportal fibrosis, bile duct abnormalities and liver contour irregularity, but not with contrast media uptake in the hepatobiliary phase. This is in keeping with the subjective nature of the CPS. The presence of altered liver morphology and decreased uptake of CM in the HBP were found in patients with more advanced disease, i.e. CPS B or ALBI grade 2. These findings can be explained by the fact that the ALBI score seems to be more sensitive in estimating disease severity than CPS, a fact already recognized in the literature [43, 44].
Our study’s limitations include, firstly, the retrospective nature of the majority of the cohort with the inherent limitations of a retrospective study. However, the results derived from this retrospective group were confirmed in the prospective group, which validated the applicability of the established classification algorithm. Another potential bias is that most of the patients had undergone lung transplantation and were therefore on immunosuppressants and other drugs, which are potential confounders of liver function results. However, our results were well in line with other clinical publications [7]. Furthermore, although our cohorts were not subject to histopathology staging, clinical, laboratory and MR features strongly suggest that the majority had early-stage CFLD. The lack of elevated serum bilirubin, as well as the absence of impaired uptake or excretion on hepatobiliary imaging support this conclusion [45].
There is no gold standard for CFLD diagnosis; even the universally-accepted Debray criteria, which may appear simpler and cheaper than liver MRI, is based largely on clinical signs, laboratory tests and ultrasound. Therefore, we feel that the integration of MRI in CFLD screening and follow-up might improve diagnosis of CFLD, when laboratory tests and/or clinical signs fail to do so.
In conclusion, a short unenhanced MRI protocol can identify the three cardinal imaging features of CFLD, namely altered gallbladder morphology, periportal tracking and periportal fat deposition. The hepatobiliary phase of gadoxetic acid-enhanced MRI can define the progression of CFLD.
Abbreviations
- 3-T:
-
3-Tesla
- ALBI:
-
Albumin-bilirubin score
- ALT:
-
Alanine aminotransferase
- ALP:
-
Alkaline phosphatase
- AP:
-
Antero-posterior
- AST:
-
Aspartate aminotransferase
- BDA:
-
Bile duct abnormalities
- CC:
-
Craniocaudal
- CF:
-
Cystic fibrosis
- CFLD:
-
Cystic fibrosis-associated liver disease
- CFTR:
-
Cystic fibrosis transmembrane conductance regulator
- CHAID:
-
Chi-squared automatic interaction detector
- CM:
-
Contrast media
- CPS:
-
Child-Pugh score
- CSI:
-
Chemical shift imaging
- CT:
-
Computed tomography
- DWI:
-
Diffusion-weighted imaging
- GBAM:
-
Altered gallbladder morphology
- Gd-EOB-DTPA:
-
Gadolinium ethoxybenzyl diethylenetriaminepentaacetic acid
- GGT:
-
Gamma-glutamyltransferase
- HBP:
-
Hepatobiliary phase
- LL:
-
Latero-lateral
- MRCP:
-
Magnetic resonance cholangiopancreaticography
- MRI:
-
Magnetic resonance imaging
- NPV:
-
Negative predictive value
- PACS:
-
Picture Archiving and Communication System
- PPF:
-
Periportal fibrosis
- PPFD:
-
Periportal fat deposition
- PPT:
-
Periportal tracking
- PPV:
-
Positive predictive value
- PSC:
-
Primary sclerosing cholangitis
- pv:
-
Portal venous
- RLE:
-
Relative liver enhancement
- RNH:
-
Regenerative nodular hyperplasia
- ROC:
-
Receiver-operating characteristic
- SI:
-
Signal intensity
- UDCA:
-
Ursodeoxycholic acid
- US:
-
Ultrasound
References
Stoltz DA, Meyerholz DK, Welsh MJ (2015) Origins of cystic fibrosis lung disease. N Engl J Med 372:1574–1575
Harring TR, Nguyen NT, Liu H, Karpen SJ, Goss JA, O'Mahony CA (2013) Liver transplantation in cystic fibrosis: a report from Baylor College of Medicine and the Texas Children's Hospital. Pediatr Transplant 17:271–277
Chryssostalis A, Hubert D, Coste J et al (2011) Liver disease in adult patients with cystic fibrosis: a frequent and independent prognostic factor associated with death or lung transplantation. J Hepatol 55:1377–1382
Leeuwen L, Fitzgerald DA, Gaskin KJ (2014) Liver disease in cystic fibrosis. Paediatr Respir Rev 15:69–74
Parisi GF, Di Dio G, Franzonello C et al (2013) Liver disease in cystic fibrosis: an update. Hepat Mon 13:e11215
Nash EF, Volling C, Gutierrez CA et al (2012) Outcomes of patients with cystic fibrosis undergoing lung transplantation with and without cystic fibrosis-associated liver cirrhosis. Clin Transplant 26:34–41
Staufer K, Halilbasic E, Trauner M, Kazemi-Shirazi L (2014) Cystic fibrosis related liver disease--another black box in hepatology. Int J Mol Sci 15:13529–13549
Bhardwaj S, Canlas K, Kahi C et al (2009) Hepatobiliary abnormalities and disease in cystic fibrosis: epidemiology and outcomes through adulthood. J Clin Gastroenterol 43:858–864
Kobelska-Dubiel N, Klincewicz B, Cichy W (2014) Liver disease in cystic fibrosis. Prz Gastroenterol 9:136–141
Stonebraker JR, Ooi CY, Pace RG et al (2016) Features of Severe Liver Disease With Portal Hypertension in Patients with Cystic Fibrosis. Clin Gastroenterol Hepatol. https://doi.org/10.1016/j.cgh.2016.03.041
Lewindon PJ, Pereira TN, Hoskins AC et al (2002) The role of hepatic stellate cells and transforming growth factor-beta(1) in cystic fibrosis liver disease. Am J Pathol 160:1705–1715
Asayama Y, Nishie A, Ishigami K et al (2016) Heterogeneity of non-cancerous liver parenchyma on gadoxetic acid-enhanced MRI: an imaging biomarker for hepatocellular carcinoma development in chronic liver disease. Clin Radiol 71:432–437
Nakayama T, Yoshiura T, Nishie A et al (2016) Balanced MR cholangiopancreatography with motion-sensitised driven-equilibrium (MSDE) preparation: feasibility of Gd-EOB-DTPA-enhanced biliary examination. Clin Radiol. https://doi.org/10.1016/j.crad.2016.03.019
Lee NK, Kim S, Kim DU et al (2015) Diffusion-weighted magnetic resonance imaging for non-neoplastic conditions in the hepatobiliary and pancreatic regions: pearls and potential pitfalls in imaging interpretation. Abdom Imaging 40:643–662
Debray D, Kelly D, Houwen R, Strandvik B, Colombo C (2011) Best practice guidance for the diagnosis and management of cystic fibrosis-associated liver disease. J Cyst Fibros 10(Suppl 2):S29–S36
Boyle MP (2003) Nonclassic cystic fibrosis and CFTR-related diseases. Curr Opin Pulm Med 9:498–503
Pugh RN, Murray-Lyon IM, Dawson JL, Pietroni MC, Williams R (1973) Transection of the oesophagus for bleeding oesophageal varices. Br J Surg 60:646–649
Johnson PJ, Berhane S, Kagebayashi C et al (2015) Assessment of liver function in patients with hepatocellular carcinoma: a new evidence-based approach-the ALBI grade. J Clin Oncol 33:550–558
Muggli D, Muller MA, Karlo C, Fornaro J, Marincek B, Frauenfelder T (2009) A simple method to approximate liver size on cross-sectional images using living liver models. Clin Radiol 64:682–689
Lemaitre C, Dominique S, Billoud E et al (2016) Relevance of 3D Cholangiography and Transient Elastography to Assess Cystic Fibrosis-Associated Liver Disease? Can Respir J 2016:4592702
Koelblinger C, Krssak M, Maresch J et al (2012) Hepatic steatosis assessment with 1H-spectroscopy and chemical shift imaging at 3.0 T before hepatic surgery: reliable enough for making clinical decisions? Eur J Radiol 81:2990–2995
Tran VT, Vasanawala S (2013) Pediatric hepatobiliary magnetic resonance imaging. Radiol Clin North Am 51:599–614
Van Beers BE, Daire JL, Garteiser P (2015) New imaging techniques for liver diseases. J Hepatol 62:690–700
Gupta AA, Kim DC, Krinsky GA, Lee VS (2004) CT and MRI of cirrhosis and its mimics. AJR Am J Roentgenol 183:1595–1601
Baltzer PA, Dietzel M, Kaiser WA (2013) A simple and robust classification tree for differentiation between benign and malignant lesions in MR-mammography. Eur Radiol 23:2051–2060
Jebbink MC, Heijerman HG, Masclee AA, Lamers CB (1992) Gallbladder disease in cystic fibrosis. Neth J Med 41:123–126
Curry MP, Hegarty JE (2005) The gallbladder and biliary tract in cystic fibrosis. Curr Gastroenterol Rep 7:147–153
Durieu I, Pellet O, Simonot L et al (1999) Sclerosing cholangitis in adults with cystic fibrosis: a magnetic resonance cholangiographic prospective study. J Hepatol 30:1052–1056
Lavelle LP, McEvoy SH, Ni Mhurchu E et al (2015) Cystic Fibrosis below the Diaphragm: Abdominal Findings in Adult Patients. Radiographics 35:680–695
Robertson MB, Choe KA, Joseph PM (2006) Review of the abdominal manifestations of cystic fibrosis in the adult patient. Radiographics 26:679–690
Debray D, Rainteau D, Barbu V et al (2012) Defects in gallbladder emptying and bile Acid homeostasis in mice with cystic fibrosis transmembrane conductance regulator deficiencies. Gastroenterology 142(1581-1591):e1586
Bodewes FA, van der Wulp MY, Beharry S et al (2015) Altered intestinal bile salt biotransformation in a cystic fibrosis (Cftr-/-) mouse model with hepato-biliary pathology. J Cyst Fibros 14:440–446
Desmet VJ (1998) Histopathology of chronic cholestasis and adult ductopenic syndrome. Clin Liver Dis 2:249–264 viii
Burt AD (2002) Primary biliary cirrhosis and other ductopenic diseases. Clin Liver Dis 6(363-380):vi
King LJ, Scurr ED, Murugan N, Williams SG, Westaby D, Healy JC (2000) Hepatobiliary and pancreatic manifestations of cystic fibrosis: MR imaging appearances. Radiographics 20:767–777
Ruiz A, Lemoinne S, Carrat F, Corpechot C, Chazouilleres O, Arrive L (2014) Radiologic course of primary sclerosing cholangitis: assessment by three-dimensional magnetic resonance cholangiography and predictive features of progression. Hepatology 59:242–250
Van Biervliet S, Robberecht E (2007) Splenectomy in cystic fibrosis. Arch Dis Child 92:277–278
Fotbolcu H, Zorlu E (2016) Nonalcoholic fatty liver disease as a multi-systemic disease. World J Gastroenterol 22:4079–4090
Koh C, Sakiani S, Surana P et al (2017) Adult-onset cystic fibrosis liver disease: Diagnosis and characterization of an underappreciated entity. Hepatology 66:591–601
Yam BL, Siegelman ES (2014) MR imaging of the biliary system. Radiol Clin North Am 52:725–755
Wibmer A, Nolz R, Trauner M, Ba-Ssalamah A (2015) Functional MR imaging of the liver. Radiologe 55:1057–1066
Neri E, Bali MA, Ba-Ssalamah A et al (2016) ESGAR consensus statement on liver MR imaging and clinical use of liver-specific contrast agents. Eur Radiol 26:921–931
Zou H, Yang X, Li QL, Zhou QX, Xiong L, Wen Y (2018) A Comparative Study of Albumin-Bilirubin Score with Child-Pugh Score, Model for End-Stage Liver Disease Score and Indocyanine Green R15 in Predicting Posthepatectomy Liver Failure for Hepatocellular Carcinoma Patients. Dig Dis 36:236–243
Cui E, Long W, Luo L, Hu M, Huang L, Chen X (2017) Development and validation of a predictor of insufficient enhancement during the hepatobiliary phase of Gd-EOB-DTPA-enhanced magnetic resonance imaging. Acta Radiol 58:1174–1181
Tschirch FT, Struwe A, Petrowsky H, Kakales I, Marincek B, Weishaupt D (2008) Contrast-enhanced MR cholangiography with Gd-EOB-DTPA in patients with liver cirrhosis: visualization of the biliary ducts in comparison with patients with normal liver parenchyma. Eur Radiol 18:1577–1586
Acknowledgements
Open access funding provided by Medical University of Vienna.
Funding
Only one of the authors has received funding (supported by funds of the Austrian National Bank/Oesterreichische Nationalbank, Anniversary Fund, project number: AP15711ONB). The remaining authors have not received any funding.
Author information
Authors and Affiliations
Corresponding author
Ethics declarations
Guarantor
The scientific guarantor of this publication is Ahmed Ba-Ssalamah.
Conflict of interest
Ahmed Ba-Ssalamah received honoraria for lectures and consultancy from Bayer but disclosed no relation to the present article.
The other authors of this manuscript declare no relationships with any companies whose products or services may be related to the subject matter of the article.
Statistics and biometry
Michael Weber kindly provided statistical advice for this manuscript.
Additionally, one of the authors has significant statistical expertise (Pascal Baltzer).
Informed consent
Written informed consent was waived by the Institutional Review Board.
Ethical approval
Institutional Review Board approval was obtained.
Methodology
• Prospective/retrospective
• Observational study
• Performed at one institution
Rights and permissions
Open Access This article is distributed under the terms of the Creative Commons Attribution 4.0 International License (http://creativecommons.org/licenses/by/4.0/), which permits unrestricted use, distribution, and reproduction in any medium, provided you give appropriate credit to the original author(s) and the source, provide a link to the Creative Commons license, and indicate if changes were made.
About this article

Cite this article
Poetter-Lang, S., Staufer, K., Baltzer, P. et al. The Efficacy of MRI in the diagnostic workup of cystic fibrosis-associated liver disease: A clinical observational cohort study. Eur Radiol 29, 1048–1058 (2019). https://doi.org/10.1007/s00330-018-5650-5
Received:
Revised:
Accepted:
Published:
Issue Date:
DOI: https://doi.org/10.1007/s00330-018-5650-5