
Abstract
Six types of γ-polyglutamic acid (γ-PGA)/cold water-soluble starch (St) composite film models were constructed using molecular dynamics simulation, and their properties were investigated and compared with the corresponding experimental values. The compatibility between the composite film components was analyzed using the radial distribution function and mean square displacement (MSD). The hydrogen-bond number and bond energy were used to track the film-formation process. The mechanical property data of the films were extracted, and MSD was used to analyze the permeability of the film to carbon dioxide, oxygen, water vapor, and carbon-16 saturated fatty acids. Finally, the simulated values of mechanical properties and permeability were compared with the experimental values. The results demonstrated that γ-PGA is well compatible with St. The intramolecular and intermolecular hydrogen bonds of γ-PGA and St did not change considerably during the film-formation process. The simulated values of the mechanical properties exhibited a similar trend as the experimental values; however, in terms of permeability, a difference was observed between the initial values of the simulated design and actual material parameters, as well as the complexity of the experiment.
Introduction
Starch, which is one of the most abundant polysaccharides on Earth, can be converted into different biobased materials through physical and chemical modifications, e.g., pharmaceutical excipients [1, 2] and packaging plastics [3, 4]. These materials can be applied in pharmaceutical [5] and environmental industries, and if the materials meet people’s dietary needs, they can be used in the food industry [6, 7]. The physicochemical properties of starch differ according to its amylose and amylopectin content, and the solubility characteristics of starch in water differ according to the number of glucose units. Raw starch cannot be dissolved in water; it can only form a suspension or colloid. When the raw starch is processed and its molecular weight drops to thousands to tens or hundreds of thousands, it can be dissolved in hot water (referred to as soluble starch) [8, 9] or cold water (referred to as cold water-soluble starch) [8,9,10,11,12]. Studies have shown that starch-based products obtained by different treatment methods have a wide application range [13, 14].
Industrial γ-polyglutamic acid (γ-PGA) products can be obtained using the fermentation methods of different genetically engineered strains [15, 16]. After separation and purification, γ-PGA can be used to prepare environmentally compatible products, e.g., hydrogels, nanoparticles, and packaging films [17,18,19]. γ-PGA with different molecular weights can be obtained by modifying genetically engineered bacteria and changing the fermentation conditions, which expand its applicability and enhance its application value [9, 20, 21].
Starch-based films are relatively inexpensive and environmentally friendly. Their poor mechanical and nonthermoplastic properties can be modified and improved via blending or copolymerization to enhance their application. In addition, the known antibacterial properties and intelligent manifestations of these films can broaden the application range of starch in the packaging field [22,23,24,25]. γ-PGA films are also receiving increased research interest in food packaging [19], medical materials [26], and heavy-metal adsorption [27] applications.
The molecular simulation technology developed in recent years can be used to investigate the interactions and mechanisms of various components at the molecular level, predict material properties, reduce experimental costs and time, and accelerate the development of new materials [28, 29]. The compatibility [30], glass transition temperature [31], mechanical properties [32], and gas diffusion [33] of blend films can be effectively predicted using molecular dynamics (MD) techniques. Researchers have used MD for designing the preparation methods and determining the properties of biobased macromolecules, e.g., polysaccharides and proteins [34, 35]. In this study, the complex starch molecule was simplified into cold water-soluble starch to prepare γ-PGA blends and obtain composite films with different mass ratios. The compatibility, mechanical properties, and permeability of the composite films were estimated via molecular simulation. The experimental results agreed with the simulated values, and comprehensive data were obtained from micro and macro perspectives. Meanwhile, it provided a reference for molecular dynamics simulation of biological macromolecules.
Methodology
Model and simulation methodology
Modeling and relaxation
In this study, first, molecular structures of γ-PGA, starch, and glycerol were constructed through the modeling function of Materials Studio 7.0 (Figs. 1a, b, and d), and the degree of polymerization of γ-PGA and starch molecules was 10. Then, three types of molecular chains of the amorphous system were constructed using the Amorphous Cell module. The mass ratios of γ-PGA and starch in the amorphous system were 10:0, 8:2, 6:4, 4:6, 2:8, and 0:10, and the mass of glycerol was 10% of the total mass. (The six composite films are referred to as P10S0, P8S2, P6S4, P4S6, P2S8, and P0S10, respectively.) To preserve appropriate space between the molecules in the subsequent relaxation process of the system, the initial density of the model was set to 0.8 g/cm3, the summation method of electrostatic energy in nonbonding interaction energy was group-based, the summation method of van der Waals interaction energy was atom-based, and the truncation radius was 12.5 Å. Further, the COMPASSII force field was used, and the atomic charge was automatically allocated to the force field. After the model was constructed, the structure was optimized using the Forcite Plus module in Materials Studio. The optimization method was efficient enough to obtain a lower energy system.

Simulation model of low energy monomer molecules and their blends with different water content: a starch; b glycerin; c water; d γ-polyglutamic acid; e, f, g, and h blend systems containing 100, 20, 10, and 1 g of water, respectively
Finally, the kinetic method was used to fully relax the model. To quickly eliminate the internal stress in the system, the total simulation time was set to 300 ps, and the system comprised a constant number of atoms at normal pressure and temperature (NPT). The pressure was 1 atm, and the temperature was 600 K. After relaxation, an NPT system was used in the model, where the temperature was 300 K, the pressure was 1 atm, the simulation time was 3 ns, and the time step of the two dynamics was 1 fs. A single frame was output every 1000 steps, the force field was COMPASSII, and the summation method of electrostatic energy was group-based. In addition, the summation method of van der Waals interaction energy was atom-based, and the truncation radius was 18.5 Å.
Film-formation mechanism
The P6S4 sample was selected as the simulation object. The Amorphous Cell tool in Materials Studio was used to set up four types of film liquids or film model structures with different water contents (100, 20, 10, and 1 g), from the initial film liquid to dry film-formation process. The MD parameters of the film-formation process were then analyzed. Note that the conditions of the MD simulation were the same as those described in Sect. "Modeling and relaxation". Particularly, the model size ranges from 30 to 40 Å. The systems characterized by different water contents (obtained through experiments) are investigated from a simulation perspective. The simulation method indirectly represents the water content based on a specific number of water molecules and utilizes a dominant solution model. The temperature was changed from normal temperature to 333 K, the total simulation time was 1 ns, the time step was 1 fs, and the deterministic Nosé–Hoover Langevin algorithm was the temperature-control method. After the dynamics were completed, the trajectory file was analyzed to obtain the total number of hydrogen bonds in each system. Here, to further investigate the contribution of each component to the hydrogen bonds, the number of hydrogen bonds between each component was also extracted. In this study, the maximum length of the hydrogen bond was set to 2.5 Å and the minimum angle of the hydrogen bond was set to 90°.
Mechanical properties
The tensile mechanical properties of the systems were investigated. Equilibrium calculations for MD were conducted across all systems. Subsequently, 100 frames were selected from the model at the equilibrium stage to calculate the mechanical properties. The calculation method involved altering the strain of the model and calculating the stress of the system. Six strains, comprising three stretches and three compressions, were calculated for each structure, with a maximum deformation of 0.5%. In addition, the stress–strain curve was obtained by submitting the stress and strain data during the stretching process.
Permeability
The permeation effect of different molecules in six composite film systems was investigated. During the investigation, oxygen, carbon dioxide (CO2), water, and carbon-16 saturated fatty acid molecules were separately added to the model. The MD simulation process was the same as that described in Sect. "Modeling and relaxation". In the diffusion–penetration–simulation process, the dynamics were integrated into microcanonical ensemble (NVT), the time step was 1 fs, and the total simulation time was 1000 ps.
Experimental verification
To validate the guiding significance of the simulation method, the corresponding simulation blending films with different proportions were prepared. The simulation and experimental results regarding rheological properties, mechanical properties, and permeability of the membrane toward four types of substances were compared.
Film preparation
The films were prepared using γ-PGA (70 KDa) (Nanjing Shineking Biotech, Co., Nanjing, China) and starch (96–100% solubility in water) (Shanghai Aladdin Biochemical Technology Co., Ltd., Shanghai, China) as the main substrates and glycerol as the additive, and the formula was as follows in Sect. "Modeling and relaxation". In the specific experimental methods, the P6S4 sample was taken as an example. Here, 4 g of starch and a certain amount of water were stirred evenly and poured into a three-neck flask and then gelatinized by heating at 85 °C for 30 min. In a separate flask, 6 g of γ-PGA, 1 g of glycerol (Sinopharm Group Chemical Reagent Co. Ltd., Shanghai, China), and 100 mL of water were stirred and dissolved. This mixture was then added to the three-neck flask containing gelatinized starch and stirred for 10 min. After degassing, the resulting film liquid was cast on a glass plate and dried in an oven at 60 ℃ to form a film (with a moisture content of ~ 10% of the total mass). The mechanical properties and permeability values were tested after 48 h.
Rheology
The storage modulus and shear rate curves of the film liquids were determined using a rheometer (MCR 102, Anton-Paar, Shanghai, China). The measurements were performed at a constant temperature of 80 °C using a conical plate with a diameter of 50 mm and an angle of 1° using the flow curve measurement mode. The shear rate was considered a variable with a range of 0.1–100 s−1, the mode was linear scan, and 50 variable points were selected.
Mechanical properties
The sample was cut into strips with a length of 5 cm and a width of 0.5 cm. The tensile modulus (T) of the films was measured (TA.XT Plus, Stable Micro System, London, UK) along the vertical and horizontal directions using three strips. In total, six parallel samples were measured. The standard distance was 50 mm, and the sampling speed was 100 mm/min.
Permeability
A strong alkali absorption method was used to determine CO2 permeability [36, 37]. A weighing bottle containing 200 mL of a 1-N KOH solution was sealed with the film to be tested and placed in a desiccator with a 10% relative humidity (RH) saturated salt solution. The system was balanced in a nitrogen (N2) environment for 24 h, and then N2 was replaced with CO2 to maintain the partial pressure of CO2 outside the film at 101 kPa. CO2 was absorbed by the KOH solution through the film. The absorption time and weight gain of the weighing bottle were recorded, and the CO2 transmittance was calculated as follows.
where \({\text{P}}_{{{\text{CO}}_{2} }}\) is the CO2 permeation rate of the film (mg/(cm2·d)), Δm is the mass of CO2 absorbed by the KOH solution (mg), d is the number of days, and S is the effective area of the film (cm2).
GB/T 16928–1997 and the ASTM material moisture permeability test method with slight modifications were used to determine water vapor permeability (WVP). In the test, 50 g of anhydrous calcium chloride (particle size = 2 mm) was placed in a 100-mL beaker at 25 °C. After measuring the thickness of the film, the mouth of the beaker was sealed with melted paraffin and placed in a desiccator at 100% RH. The sample bottles were removed from the desiccator and weighed every 24 h. Three parallel tests were conducted, and the bottles were measured continuously for one week. The results were calculated according to a process reported in the literature [38].
Unsaturated fat absorption method was used to determine oxygen permeability [36, 37]. A 50-mL beaker containing 20 mL of oleic acid was sealed with the film to be tested and placed in a desiccator with a 10% RH saturated salt solution. The system was balanced under N2 atmosphere for 24 h, and then, N2 was replaced with O2 to maintain the O2 partial pressure outside the film at 101 kPa. O2 was consumed via the oxidation of vegetable oil through the film. The weight gain of the beaker was recorded at intervals, and the O2 penetration was calculated as follows:
where \({\text{P}}_{{{\text{O}}_{2} }}\) is the O2 permeation rate of the film (mg/(cm2·d)) and Δm is the mass of O2 absorbed by oleic acid (mg).
To evaluate the vegetable oil permeability (Poil) [39], 5 mL of vegetable oil was poured into a test tube and sealed with the film. The test tube was placed upside down on filter paper for one week. The filter paper was weighed every 24 h to calculate the Poil of the samples.
Statistical analysis
Note that the data from the experiments are expressed as the mean ± standard deviation. The statistical differences were analyzed according to variance and LSD analysis using the SPSS software (SPSS Inc., Chicago, Illinois, USA). In this evaluation, P < 0.05 was considered statistically significant.
Results and discussion
Equilibrium configuration
Two criteria were used to distinguish the MD simulations to achieve equilibrium: (1) temperature fluctuation < 10 °C and (2) energy fluctuation < 100 fs. Note that these criteria must be constant or fluctuate (increase or decrease) slightly along a constant value. Generally, the system is considered to have reached equilibrium when the temperature and energy fluctuations are between 5 and 10% [40]. The temperature change is minor in the simulation of the composite film model (Fig. 2), and the energy change is shown in Fig. 3. At the beginning of the MD simulation, the fluctuation gradually weakened within 10–15 ps (10000–15000 fs), and the energy increased gradually. Under the action of shear force, the molecular chain untangled, and the molecules broke free from the binding, resulting in an increase in the energy of the molecular system. Then, it stabilized quickly to a constant value. These results demonstrate that the system reached a thermodynamic equilibrium structure, and then, the energy and instantaneous temperature of the system fluctuated slowly around the equilibrium value, forming a relatively stable curve according to the equilibrium criterion. This indicates that all the mixed systems reached equilibrium via MD simulation.

Temperature curves of composite films with simulation time

Energy curves of composite films with simulation time: a nonbond energy; b potential energy; and c total energy
Compatibility
The radial distribution function (g(r)) is performed on an atom as a characteristic physical quantity that reflects the microstructure of materials. It represents the ratio of the probability density of a molecule to the probability density of random distribution at distance r around another molecule. Thus, a larger g(r) value indicates better compatibility of the blend system. The intermolecular g(r) is used to reveal the interaction mode and nature between nonbonded atoms. Note that the hydrogen-bond interaction range is 2.6–3.1 Å, and the van der Waals interaction range is 3.1–5.0 Å [41].
Figure 4(a) shows the g(r) values of the separate γ-PGA, St, and glycerol molecules. This figure shows that none of these three pure substances exhibits a strong peak at > 3 Å, verifying that the constructed molecular structure is amorphous [42]. However, no peak is observed, and the g(r) value approaches 1 at radial distances of > 4 Å, proving that the blend system has amorphous characteristics [43]. As shown in Figs. 4b–g, the g(r) values of all the blends peak at ~ 5 Å. Thus, the main mode of interaction between the blends is considered as the van der Waals force. By comparing the g(r) values of the C–C bond between the γ-PGA/St molecules (Fig. 4h), we found that the peak-height order of the blends was as follows: P6S4 > P4S6 > P2S8 > P8S2. This trend indicates that the blend system exhibits good compatibility, and when the quality of the two substances is equivalent, the compatibility is better. In addition, by comparing the nonbond energies of their respective systems (Fig. 3a), the bonding energies of the blends are observed to follow the order of P6S4 > P8S2 > P4S6 > P2S8.

Radial distribution function (RDF) of C–C atoms in composite films and monomers: a RDF of γ-PGA, St, and Gly; b–g: RDF between molecules in P10S0, P8S2, P6S4, P4S6, P2S8, and P0S10, respectively; and h RDF comparison of γ-PGA/St in composite films
In this study, the mean square displacement (MSD) was considered to characterize the thermal motion displacement of the γ-PGA, St, and glycerol chains. Therefore, it was used to explore the mutual influence of motion ability in the films; a larger MSD value indicates a more intense thermal motion of molecules. The thermal motion of the glycerol molecules was the most intense, followed by γ-PGA and then St (Fig. 5 and Table 1). A comparison of different composite films indicates that the thermal motion of γ-PGA and St molecular chains was the most intense in P10S0 and P0S10. In the other composite films, the movements of the γ-PGA molecular chains were more intense than those of St, and the change trend of γ-PGA and St was opposite. These findings indicate that the movement ability of the molecular chains in the mixing system was affected by the change in the blending ratio. In the composite films with different mixing ratios, the force on the molecular chain of the system differed. The change in the mass ratio of γ-PGA/St can cause considerable changes in the secondary bond force, e.g., the hydrogen-bond force, affecting the spatial structure of the molecule and in turn affecting the movement activity of the molecule.

MSD of different molecules in composite films: a P10S0; b P8S2; c P6S4; d P4S6; e P2S8; and f P0S10
Film processing
Using P6S4 as an example, the hydrogen bonds within and between each molecule under the simulated conditions are shown in Fig. 6. When various substances reached equilibrium after addition (Fig. 6a), the numbers of hydrogen bonds between γ-PGA and water, St and water, and γ-PGA and St were the highest at approximately 250, 241, and 228, respectively. The numbers of intramolecular hydrogen bonds in St, γ-PGA, and water molecules were approximately 182, 171, and 123, respectively. In addition, the number of hydrogen bonds formed by glycerol was consistently the lowest. With the evaporation of water, the concentration of γ-PGA and St and the probability of their contact increased. The number of hydrogen bonds within and between the molecules increased gradually (Fig. 6b), accounting for the majority of their total number of hydrogen bonds. The hydrogen bond between γ-PGA and St was the most evident, indicating that PGA and St can be mixed evenly and are well compatible in the film-formation process. The secondary bonds represented by hydrogen bonds between PGA and St exhibit microscopic changes. Table 2 shows that the changes in bond energy (i.e., the bond stretching energy (Ebond), bond angle bending energy (Eagle), dihedral angle torsion energy (Etorsion), and inversion energy (Einversion)) of the four composite films during the film-formation process were not significant because these processes were unaffected by external forces. Considerable changes occurred in the nonbonding energy (i.e., the van der Waals interaction energy (Evdw), electrostatic energy (Ecoulomb), and hydrogen bonding energy (Ehbond)). Although the reduction of water mass was one factor, the increased interaction between γ-PGA and St decreased the reduction rate of the nonbond energy.

Number of intermolecular and intramolecular hydrogen bonds in film liquids or films with different water content: a 100; b 20; c 10; and d 1 g
Mechanical properties
The elastic modulus (E), shear modulus (G), and bulk modulus (K) are used to indicate the rigidity of the material under different force conditions. Note that the elastoplastic properties of a material are associated with E, and the hardness and tensile strength (T) are proportional to G. A positive Cauchy pressure value indicates good ductility of the material, whereas a higher value indicates better ductility of the system [44].
The mechanical properties of γ-PGA, St, and their composite films at four proportions obtained through MD simulation calculations are listed in Table 3, including the E, K, G, and Poisson’s ratio (ν; the ratio of the transverse strain to the longitudinal strain) values. The values of the elastic constants of the C11, C22, C33, C44, C55, and C66 groups, as well as the C12, C13, and C23 groups, were similar, indicating that γ-PGA and St had good solubility. The ν value of the composite films was ~ 0.28, and the ν value of plastics is typically between 0.2 and 0.4, indicating that the mixed system exhibits some properties of plastics [45]. The Cauchy pressure values (C12–C44) of various films were all positive, indicating that the composite films exhibit toughness. The Cauchy pressure values of the P0S10 and P10S0 samples were lower than those of the blend films, indicating that the ductility of the single principal component was poorer than that of the composite principal component and the brittleness was stronger. In addition, depending on the proportion of the components, the number of hydrogen bonds formed by the composite film varied. We found that the P4S6 sample exhibited the highest K value, the P0S10 sample showed the highest G value, and the P2S8 sample demonstrated the highest Young’s modulus (Y) value.
Permeability
According to the MSD slope, the ability of gas to escape from the interface can be determined [46]. Figures 7a–d shows that the diffusion of CO2, water vapor, O2, and vegetable oil in the composite films did not exhibit regular changes. The MSD of gas diffusion can also be converted into the diffusion coefficient to illustrate the molecular permeability (Fig. 8) [47]. The P10S0 sample exhibited the highest \({\text{P}}_{{{\text{CO}}_{2} }}\). The P2S8 sample exhibited the highest WVP, and the P2S8 sample demonstrated the highest Poil. The P10S0 sample demonstrated the lowest \({\text{P}}_{{{\text{O}}_{2} }}\). Note that the small molecules exhibited jumping diffusion in the polymer films, which was affected by the intermolecular force of the film. The small molecules were confined in the polymer film holes and caused small local vibrations most of the time. In addition, with the continuous movement of the polymer chain end, small molecules could jump from one hole to another [48, 49]. The difference in the energy barrier, electrostatic interaction, and free volume fraction on the molecular chains of the membranes resulted in the difference in the diffusion coefficient of the gas through the films [50].

Permeability of composite films to four substances: a CO2, b water vapor, c O2, and d oil
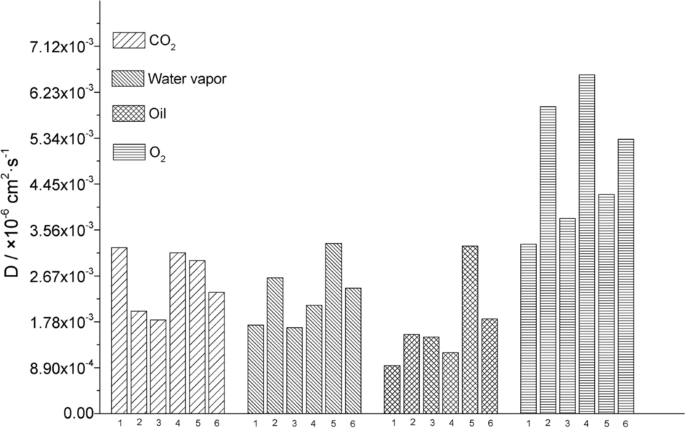
Diffusion coefficients of composite films to four substances: (1) P10S0, (2) P8S2, (3) P6S4, (4) P4S6, (5) P2S8, and (6) P0S10
Experimental data
The P0S10 sample exhibited the highest storage modulus (G′) (Fig. 9), and with an increasing mass ratio of γ-PGA, the G′ of the composite film liquid decreased gradually, and shear thinning occurred. We found that the G′ values of the P8S2 and P10S0 samples were similar. The variation trend of the G′ values was similar to that observed for the E values. Owing to the proportional relationship between G and G′, they exhibited the same variation pattern as the simulated G values (Table 3). As the mass ratio of St increased, the T initially decreased and then increased, which is closely related to the molecular interaction between γ-PGA and St, as well as their molecular weights.

Storage modulus of composite film liquids
The experimental data validation for permeability (Table 4) showed that as the mass ratio of St increased, P2S8 exhibited the highest \({\text{P}}_{{{\text{CO}}_{2} }}\), which was equivalent to that of P4S6 and consistent with the simulation results. However, the WVP of P0S10 was much lower than that of the other composite films; similarly, the data for \({\text{P}}_{{{\text{O}}_{2} }}\) and Poil were not consistent with the simulated values. In the simulation design, the molecular weights of the two macromolecular substances were considered to be close to the weight of only 10 monomers, while in the experiment, the molecular weight of γ-PGA was 70 KDa and the molecular weight of St was 100–200 glucose units. Thus, the difference between the simulated and experimental values was significant.
Conclusion
In this study, six mass ratios of γ-PGA/St composite films were simulated using MD. First, the energy-difference relationship of each composite film was compared when they reached their steady states. Owing to the secondary bond interaction between γ-PGA and St, their energy states changed in different ways. The solubility of γ-PGA and St was investigated based on their g(r) and MSD values, and the results demonstrated good compatibility. According to the film-formation process of the P6S4 sample, in the absence of an external force, the hydrogen-bond interaction between γ-PGA and St in the composite system was always the maximum with decreasing water mass. A comparison of the simulated and experimental values corresponding to the mechanical properties revealed similar variation trends between these values, indicating that the simulation method can be used for reference. However, when comparing the simulation and experimental values of permeability, the experimental settings for real substances could not be achieved due to the limitations of the simulation software conditions; therefore, the simulation values can only serve as guidance to a certain extent.
Data Availability
The data used in this study are confidential.
References
Labelle MA, Ispas-Szabo P, Tajer S, Xiao Y, Barbeau B, Mateescu MA (2023) Anionic and ampholytic high-amylose starch derivatives as excipients for pharmaceutical and biopharmaceutical applications: structure-properties correlations. Pharmaceutics 15:834
Kalita P, Ahmed AB, Sen S, Chakraborty R (2023) Citric acid esterified Glutinous Assam bora rice starch enhances disintegration and dissolution efficiency of model drug. Int J Biol Macromol 227:424–436
Rahardiyan D, Moko EM, Tan JS, Lee CK (2023) Thermoplastic starch (TPS) bioplastic, the green solution for single-use petroleum plastic food packaging—A review. Enzyme Microb Tech 168:110260
Siqueira LDV, Arias CILF, Maniglia BC, Tadini CC (2021) Starch-based biodegradable plastics: methods of production, challenges and future perspectives. Curr Opin Food Sci 38:122–130
Saraf P, Movaghar MA, Montazer M, Rad MM (2023) Bio and photoactive starch/MnO2 and starch/MnO2/cotton hydrogel nanocomposite. Int J Biol Macromol 193:681–692
Asharuddin SM, Othman N, Altowayti WAH, Bakar NA, Hassan A (2021) Recent advancement in starch modification and its application as water treatment agent. Environ Technol Inno 23:101637
Wang JP, Yuan SJ, Wang Y, Yu HQ (2013) Synthesis, characterization and application of a novel starch-based flocculant with high flocculation and dewatering properties. Water Res 47:2643–2648
Kusunoki K, Kawakami K, Shiraishi F, Kato K, Kai M (1982) A kinetic expression for hydrolysis of soluble starch by glucoamylase. Biotechnol Bioeng 24:347–354
Aboubacar A, Hamaker BR (2000) Low molecular weight soluble starch and its relationship with sorghum couscous stickiness. J Cereal Sci 31:119–126
Ma WP, Robyt JF (1987) Preparation and characterization of soluble starches having different molecular sizes and composition, by acid hydrolysis in different alcohols. Carbohyd Res 166:283–297
Jivan MJ, Yarmand M, Madadlou A (2004) Preparation of cold water-soluble potato starch and its characterization. J Food Sci Tech Mys 51:601–605
Choi YJ, Baik MY, Kim BY (2017) Characteristics of granular cold-water-soluble potato starch treated with alcohol and alkali. Food Sci Biotechnol 26:1263–1270
Anwar M, Birch EJ, Ding Y, Bekhit AED (2022) Water-soluble non-starch polysaccharides of root and tuber crops: extraction, characteristics, properties, bioactivities, and applications. Crit Rev Food Sci 62:2309–2341
Pascu B, Negrea A, Ciopec M, Duteanu N, Negrea P, Nemeş NS, Seiman C, Marian E, Micle O (2021) A green, simple and facile way to synthesize silver nanoparticles using soluble starch. ph studies and antimicrobial applications. Materials 14:4765
Yokoigawa K, Sato M, Soda K (2006) Simple improvement in freeze-tolerance of bakers’ yeast with poly-gamma-glutamate. J Biosci Bioeng 102:215–219
Xu J, Chen SW, Yu ZN (2005) Optimization of process parameters for poly gamma-glutamate production under solid state fermentation from Bacillus subtilis CCTCC202048. Process Biochem 40:3075–3081
Kim MH, Lee JN, Lee J, Lee H, Park WH (2020) Enzymatically cross-linked poly (gamma-glutamic acid) hydrogel with enhanced tissue adhesive property. ACS Biomater Sci Eng 6:3103–3113
Ikeda M, Akagi T, Yasuoka T, Nagao M, Akashi M (2008) Characterization and analytical development for amphiphilic poly (gamma-glutamic acid) as raw material of nanoparticle adjuvants. J Pharmaceut Biomed 150:460–468
Yu ZL, Wei YX, Fu CC, Sablani SS, Huang ZE, Han C, Li DN, Sun ZJ, Qin HZ (2023) Antimicrobial activity of gamma-poly (glutamic acid), a preservative coating for cherries. Colloid Surfaces B 225:113272
Sha Y, Zhang Y, Qiu Y, Xu Z, Li S, Feng X, Wang M, Xu H (2019) Efficient biosynthesis of low-molecular-weight poly-gamma-glutamic acid by stable overexpression of pgds hydrolase in bacillus amyloliquefaciens nb. J Agric Food Chem 67:282–290
Poo H, Park C, Kwak MS, Choi DY, Hong SP, Lee IH, Lim YT, Choi YK, Bae SR, Uyama H, Kim CJ, Sung MH (2010) New biological functions and applications of high-molecular-mass poly-gamma-glutamic acid. Chem Biodivers 7:1555–1562
He Y, Kong W, Wang W, Liu T, Yu L, Gong Q, Gao J (2012) Modified natural halloysite/potato starch composite films. Carbohyd Polym 87:2706–2711
Zhou P, Luo Y, Lv Z, Sun X, Zhang X (2021) Melt-processed poly (vinyl alcohol)/corn starch/nanocellulose composites with improved mechanical properties. Int J Biol Macromol 183:1903–1910
Yuan YL, Chen HY (2021) Preparation and characterization of a biodegradable starch-based antibacterial film containing nanocellulose and polyhexamethylene biguanide. Food Packaging Shelf 30:100718
Cui C, Ji N, Wang Y, Xiong L, Sun Q (2021) Bioactive and intelligent starch-based films: a review. Trends Food Sci Tech 116:854–869
Tong Z, Yang J, Lin L, Wang R, Cheng B, Chen Y, Tang L, Chen J, Ma X (2019) In situ synthesis of poly (gamma- glutamic acid)/alginate/AgNP composite microspheres with antibacterial and hemostatic properties. Carbohyd Polym 221:21–28
Bhattacharyya D, Hestekin JA, Brushaber P, Cullen L, Sikdar SK (1998) Novel poly-glutamic acid functionalized microfiltration membranes for sorption of heavy metals at high capacity. J Membrane Sci 141:121–135
Arenaza IMD, Meaurio E, Coto B, Sarasua JR (2010) Molecular dynamics modelling for the analysis and prediction of miscibility in polylactide/polyvinilphenol blends. Polymer 51:4431–4438
Rakkapao N, Vao-soongnern V (2014) Molecular simulation and experimental studies of the miscibility of chitosan/poly (ethylene oxide) blends. J Polym Res 21:606
Amini M, Mobli M, Khalili M, Ebadi-Dehaghani H (2018) Assessment of compatibility in Polypropylene/Poly (lactic acid)/Ethylene vinyl alcohol ternary blends: relating experiments and molecular dynamics simulation results. J Macromol Sci B 57:287–304
Bouzid L, Hiadsi S, Bensaid MO, Foudad FZ (2018) Molecular dynamics simulation studies of the miscibility and thermal properties of PMMA/PS polymer blend. Chinese J Phys 56:3012–3019
Wang YC, Ju SP, Chen CC, Chen HT, Hsieh JY (2014) Mechanical property prediction of starch/polymer composites by molecular dynamics simulation. RSC Adv 4:11475–11480
Liao LQ, Fu YZ, Liang XY, Mei LY, Liu YQ (2013) Diffusion of CO2 molecules in polyethylene terephthalate/polylactide blends estimated by molecular dynamics simulations. B Korean Chem Soc 34:753–758
Meng Y, Shi X, Cai L, Zhang S, Ding K, Nie S, Luo C, Xu X, Zhang L (2018) Triple-helix conformation of a polysaccharide determined with light scattering, AFM, and molecular dynamics simulation. Macromolecules 51:10150–10159
Hoof BV, Markvoort AJ, Santen RGAV (2014) Molecular simulation of protein encapsulation in vesicle formation. J Phys Chem B 118:3346–3354
Zhang HJ, Chi YJ, Sun B, Wang XB, Ning X (2010) Preparation of soy protein isolate-based food packaging film. Food Science 31:280–285
Guan R, Zhao X (2016) Preparation and characteristics of hordein/nano-TiO2 edible film. Journal of the Chinese Cereals and Oils Association 31:66–70
Kaya S, Kaya A (2000) Microwave drying effects on properties of whey protein isolate edible films. J Food Eng 43:91–96
Tang LY, Zhao H, Chen J, Gan J, Cai J (2003) Study on edible film’s forming property made of lac and starch and its application results. Food Science 1:23–27
Yang PY, Ju SP, Huang SM (2018) Predicted structural and mechanical properties of activated carbon by molecular simulation. Comp Mater Sci 143:43–54
Li M, Li F, Shen R, Guo X (2011) Molecular dynamics study of the structures and properties of RDX/GAP propellant. J Hazard Mater 186:2031–2036
Abou-Rachid H, Lussier LS, Ringuette S, Lafleur-Lambert X, Jaidann M, Brisson J (2008) On the correlation between miscibility and solubility properties of energetic plasticizers/polymer blends: modeling and simulation studies. Propell Explos Pyrot 33:301–310
Kang JW, Choia K, Jo WH, Hsu SL (1998) Structure-property relationships of polyimides: a molecular simulation approach. Polymer 39:7079–7087
Senkov ON, Miracle DB (2021) Generalization of intrinsic ductile-to-brittle criteria by Pugh and Pettifor for materials with a cubic crystal structure. Sci Rep 11:4531
Yang JQ, Zhang XL, Gao P, Gong XD, Wang GX (2014) Molecular dynamics and dissipative particle dynamics simulations of the miscibility and mechanical properties of GAP/DIANP blending systems. RSC Adv 4:41934–41941
Bullerjahn JT, Bülow SV, Hummer G (2020) Optimal estimates of self-diffusion coefficients from molecular dynamics simulations. J Chem Phys 153:024116
Venkatanarayanan RI, Lebga-Nebane JL, Wu L, Krishnan S (2021) Lithium coordination and diffusion coefficients of PEGylated ionic liquid and lithium salt blends: a molecular dynamics simulation study. J Mol Liq 331:115694
Tocci E, Bellacchio E, Russo N, Drioli E (2002) Diffusion of gases in PEEKs membranes: molecular dynamics simulations. J Membrane Sci 206:389–398
Lim SY, Tsotsis TT, Sahimi M (2003) Molecular simulation of diffusion and sorption of gases in an amorphous polymer. J. Chem. Phys. 119:496–504
Boyd RH, Pant PVK (1991) Molecular packing and diffusion in polyisobutylene. Macromolecules 24:6325–6331
Acknowledgements
This study was supported by the Basic Public Welfare Research Program of Zhejiang Province (LGN21C200019). Zuolong Yu was supported by a scholarship from the China Scholarship Council (202108330314).
Author information
Authors and Affiliations
Contributions
Zuolong Yu: Conceptualization, Methodology, Software, Data Curation, Writing - Original Draft, Project Administration. Yao Chen: Methodology, Software. Yongfei Chen:Resources, Validation. Yunxiao Wei: Data curation, Writing - Original draft preparation. ChangChun Fu: Visualization, Investigation, Formal analysis. Dan Liu: Investigation, Data Curation, Validation. Keshavan Niranjan: Writing - Review & Editing. Chao Han: Supervision.
Corresponding authors
Ethics declarations
Conflict of interest
The authors declare that they have no known competing financial interests or personal relationships that could have appeared to influence the work reported in this paper.
Additional information
Publisher's Note
Springer Nature remains neutral with regard to jurisdictional claims in published maps and institutional affiliations.
Rights and permissions
Open Access This article is licensed under a Creative Commons Attribution 4.0 International License, which permits use, sharing, adaptation, distribution and reproduction in any medium or format, as long as you give appropriate credit to the original author(s) and the source, provide a link to the Creative Commons licence, and indicate if changes were made. The images or other third party material in this article are included in the article's Creative Commons licence, unless indicated otherwise in a credit line to the material. If material is not included in the article's Creative Commons licence and your intended use is not permitted by statutory regulation or exceeds the permitted use, you will need to obtain permission directly from the copyright holder. To view a copy of this licence, visit http://creativecommons.org/licenses/by/4.0/.
About this article

Cite this article
Yu, Z., Chen, Y., Chen, Y. et al. Molecular dynamics simulation and performance verification of γ-polyglutamic acid/cold water-soluble starch film formation and permeability. Polym. Bull. (2024). https://doi.org/10.1007/s00289-024-05231-y
Received:
Revised:
Accepted:
Published:
DOI: https://doi.org/10.1007/s00289-024-05231-y