
Abstract
The aminolysis products of PET could be applied in several fields. The purpose of this study was to explore their use as a dual-purpose component as cross-linkers and catalysts in epoxy curing. PET aminolysis was carried out with 1:1.5 and 1:2 PET/amine ratios to produce amides with different molecular weights. The reaction products were characterized with functional group analysis, NMR, FTIR, MALDI-TOF, and solution viscosimetry. The terephthalamides were dissolved in isophorondiamine and used as cross-linkers. Reaction kinetics studies with DSC, viscosimetry, and quantum chemical computational methods were used to characterize their accelerative effects. Our studies have shown that terephthalamides are active catalyst and their efficiency can be tuned with their molecular weight. The quantum chemical simulations suggested that the terephthalamides are in the same order of magnitude in effectiveness as phenolic accelerators. Consequently, terephthalamides are valued materials that can serve as double-purpose components in epoxy curing.
Introduction
Epoxy resins are versatile materials; they have excellent physical and chemical properties that make them perfect for various uses. Their properties can be fine-tuned by changing their precursor components and their cure circumstances [1,2,3,4,5,6,7,8,9,10,11,12]. Usually various amines, anhydrides and acids are used to cross-link the epoxy (diglycidyl ether) components. During the curing reaction, the glycidyl ether reacts with the cross-linker via a ring-opening addition reaction. The reactivity of the cross-linking agent determines the processing and curing of the resins. Several publications have shown and studied the curing, reactivity, and reaction mechanism of epoxy systems [13,14,15,16,17,18,19,20,21,22,23,24,25,26,27,28,29,30,31]. The ring-opening of the glycidyl ethers can be enhanced with catalyst that can form hydrogen bonds with the glycidyl ether ring [13, 14, 24, 32,33,34,35]. Without any additional catalyst, the curing reaction produces secondary hydroxyl groups from the ring-opening of the glycidyl ether groups. Thus, the curing of the epoxy resins is autocatalytic, and it could be further enhanced by introducing additional catalytic compounds and accelerators into the resin system. The following hydrogen bond donors were found to accelerate the reaction of epoxy compounds and amines (listed from the most effective to the least effective): –OH (Ph-> PhCH2-> RCH2-> H–), –COOH, –SO3H, –CONH2, –SO2NH2 [36]. These hydrogen bond donors are mostly considered accelerators by the literature, not catalyst (tertiary amines, imidazols, and ureas) since they could react with the epoxy derivatives.
In our previous study, we have synthesized terephthalamides via the aminolysis of PET with isophorondiamine (IPD) [37]. These terephthalamides were proven to have a considerably accelerative effect on the curing of epoxy resins. So far there has been little discussion about the use of PET aminolysis products in epoxy curing [37,38,39,40,41], and there is no record on their catalytic, accelerative effect nor on its quantitative description. Nevertheless, their hydrogen donor capabilities are well described and have a decisive role in polyamides and their derivatives [42,43,44,45,46,47]. Most of the aminolysis-related articles focused on the catalysis of the solvolysis reaction; or various uses such as PVC plasticizer, dyes, and anticorrosive components of paints, drugs with anti-bacterial and anti-inflammation effects, and alkyd resin components [48,49,50,51,52]. Almost all of these studies utilized high ratio of amines (1:3–1:7 ester–amine ratio) and various purification steps to gain their final product. This concept has recently been challenged in our recent studies, and we have tried to make use of raw solvolysis products and apply as low amount of reagents as possible [37, 53, 54].
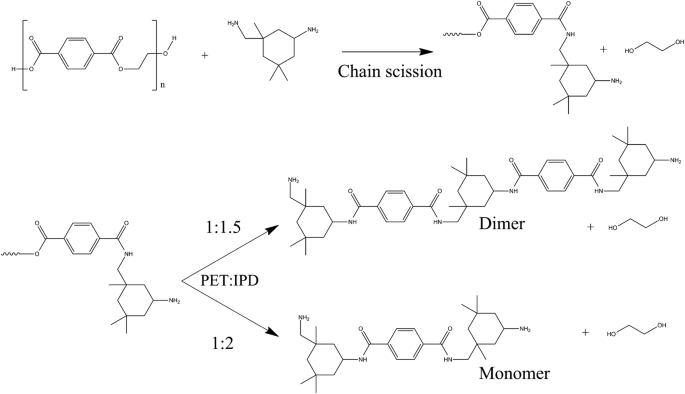
In this study, we have further attempted to reduce the used amount of diamine in an aminolysis reaction to obtain higher molecular weighed oligoamides. Three different ratios of PET and isophorondiamine were used (1:1, 1:1.5 and 1:2) (Fig. 1). The produced aminolysis products were characterized with functional group analysis, thermal gravimetric analysis (TGA), Fourier transformation infrared spectroscopy (FTIR), solution capillary viscosimetry, nuclear magnetic resonance spectroscopy (NMR), and matrix-assisted laser desorption/ionization time-of-flight mass spectroscopy (MALDI-TOF) measurements.
Terephthalamide production from the aminolysis reaction of PET without excess IPD
The main focus of this study was to quantitatively characterize the accelerative effect of the produced terephthalamides during epoxy curing. Two solutions series in IPD were prepared of the 1:1.5 and 1:2 reaction products and were used as amine cross-linkers in the curing of epoxy resins. The accelerative effect of the cross-linker solutions was studied with rotational viscosimetry and differential scanning calorimetry (DSC). The reaction kinetics of the curing was studied at 40 °C, 60 °C, 80 °C, 90 °C and 100 °C. Kamal–Sourour and its revised forms were used to determine the reaction rate and activation energy of the curing reaction. Density functional theory (DFT) and local coupled-cluster (CC) quantum chemical methods were used to calculate and compare the accelerative effect of the terephthalamides to other accelerators and catalyst.
Experimental
Materials
DSM Arnite® D00 301 PET granules were used for PET aminolysis. Isophorondiamine IPOX® ER 2943 (IPD) (η: 5–25 mPas, ρ: 0.92 g cm−3, amine value: 645–675 mgKOH g−1) and bisphenol-A-diglycidyl ether IPOX® EH1010 (η: 10,000–14,000 mPas, ρ: 1.17 g cm−3, EE: 180–196 g mol−1) were purchased from Ipox Chemicals. Zinc acetate (Zn(OAc)2·2H2O) was purchased from BDH Chemicals. Pyridine (99%), N,N-dimethylformamide (99%) (DMF), potassium hydroxide (99%), hydrochloric acid (37%), and phthalic anhydride (99%) were purchased from Molar Chemicals. DMSO-d6 (99.9%) was purchased from Sigma-Aldrich.
Aminolysis of PET with IPD
Aminolysis of PET was carried out in a 100-cm3 round-bottom four-necked glass flask equipped with a mechanical stirrer, thermometer, gas inlet (Ar gas), and reflux condenser. 50 g PET and 0.5 g zinc acetate were weighed in the glass flask. The amount of IPD was calculated to the ester groups of the weighed in PET granules to 1:1, 1:1.5, and 1:2 ratios. No excess IPD was used during the aminolysis reaction. The reaction mixture was heated to 200 °C and was kept there for 4 h. The viscous yellowy melt at the end of the reaction was poured into an alumina pan. The reactions’ products were used without any purification.
Characterization of oligoterephthalamides
Amine and hydroxyl functionalities were determined with titration methods. 3-3 parallel samples of 0.1–0.2 g weighed with analytical accuracy were dissolved in DMF. The 3-3 and the blank samples were titrated with 0.1 M hydrochloric acid to determine the amine content. Three drops of bromocresol green solution were added and used as an indicator. The hydroxyl content was determined with a back-titration method. 3-3 parallel samples of 1.8–2.0 g weighed with analytical accuracy were dissolved in 25 cm3 1 M phthalic anhydride solution in pyridine. The 3-3 parallel and blank samples were refluxed at 110 °C in oil baths for 2 h. As the samples cooled down, 50 cm3 pyridine was added through the condenser. The samples were titrated with 0.5 M aqueous NaOH solution. Phenolphthalein was used as an indicator.
Solution viscosimetry was used to compare the molecular weight of the aminolysis products. A 5-point solution series was used (0.02, 0.04, 0.06, 0.08, and 0.10 g cm−3) to determine the intrinsic viscosity of the 1:1.5 and 1:2 ratio samples. The samples were weighed in Erlenmeyer flasks with analytical precision and were dissolved in ethanol. The samples were refluxed for 30 min to dissolve the reaction products. The samples were measured at 40 °C in an Ubbelohde-type capillary viscosimeter. The intrinsic viscosity of the samples was calculated from the reduced and relative viscosity of the concentration series.
A Bruker Tensor 27 FTIR spectrometer was used to measure the FTIR spectra. The products were measured in KBr pastilles. Twenty-eight parallel scans were made between 4000 and 400 cm−1 interval. 1H, 13C, 1H–1H COSY, 1H–1H NOESY, 1H–13C HSQC, and 1H–13C HMBC NMR spectra were recorded with a Bruker Avance 300 spectrometer. The 50 mg samples were dissolved in 1 cm3 of DMSO-d6.
The mass spectrometric measurements were carried out with a Bruker Autoflex Speed MALDI-TOF instrument. Ion source voltage 1, ion source voltage 2, reflector voltage 1, and reflector voltage 2 were 19 kV, 16.65 kV, 21 kV, and 9.55 kV, respectively. The instrument was equipped with a solid phase laser (355 nm) operating at 1000 Hz. For each measurement, 5000 shots were summed. The MALDI spectra were calibrated with PEG standards. The samples, the matrix (2,5-dihydroxybenzoic acid), and the ionizing agent (sodium trifluoroacetate) were solved at a concentration of 5 mg cm−3, 20 mg cm−3, and 5 mg cm−3 in THF, respectively. The mixing ratio was 2:10:1 (sample, matrix, and ionizing agent). A volume of 0.2 mm−3 of the solutions was deposited onto a MALDI target plate and allowed to air-dry.
The reaction products were purified before the NMR measurements. The reaction products were first dissolved in ethanol; then the solution was dropwise added to distilled water to precipitate the terephthalamides. The precipitate was washed thoroughly with water to remove the EG. The precipitate was dissolved in ethanol, and the solvent was removed with a vacuum apparatus. At the end of the purification steps amorphous, yellowy powder was obtained.
Epoxy preparation and characterization
A solution series of the 1:1.5 and 1:2 ratio raw aminolysis products were prepared to use as cross-linking agents. The aminolysis products were utilized without any purification. Thus, the IPD, the terephthalamides, ethylene glycol, and the residual zinc salt are present in the cross-linker solutions. The 1:1.5 reaction product was dissolved in the commercial IPD to gain 5, 10, 15, 20, and 30% solutions. The 1:1.5 15% and 30% solutions were used for the reaction kinetics study. The 1:2 ratio reaction product was used to produce 30% and 50% solutions with IPD for reaction kinetics measurements. The reaction products and the IPD were weighed in with analytical accuracy in Erlenmeyer flasks. The flasks were equipped on reflux condensers and were heated with an oil bath to 110–120 °C. The solutions were heated, stirred with a magnetic stirrer, and let to reflux until no solid residue remained in the flasks. The 1:1.5 solutions took 3–4 h to completely dissolve, while the 1:2 solution took only 1 h. The amine content of the solutions was measured as previously described.
The epoxy value of the base resin was measured with a back-titration method. Pyridine hydrochloride reagent solution in pyridine was prepared by dissolving 16 cm3 concentrated hydrochloric acid in 1 dm3 pyridine. 0.1–0.2 g samples of the epoxy resin were weighed in Erlenmeyer flasks and were dissolved in 25 cm3 of pyridine hydrochloride solution in pyridine. The samples were let to reflux for 1 h; then after they cooled down, 10 cm3 distilled water was added through the condenser. 0.1 M sodium hydroxide solution (in methanol) was used to titrate the samples in the presence of phenolphthalein indicator. The stoichiometric ratios of the epoxy resin and the amine cross-linkers were calculated based on the measured functionality. All the prepared resin samples were mixed according to the calculated 1:1 stoichiometric ratios. The epoxy samples were prepared in plastic cups. The epoxy base resin was weighed in a cup, and the stoichiometric amount of the cross-linker solution was weighed with analytical precision. The epoxy resin was vigorously mixed with a glass rod for 3 min.
PerkinElmer DSC7 was used for the reaction kinetics study. After the 3-min-long mixing period, an 8–10 mg sample was weighed in an alumina sample pan. Reaction kinetics studies were conducted on the commercial IPD (0%); the 15% and 30% 1:1.5 solutions; and the 30% and 50% 1:2 solutions. The epoxy curing reaction was studied at five different reaction temperatures, respectively, at 40 °C, 60 °C, 80 °C, 90 °C, and 100 °C with the following heat cycle. The samples were kept at 30 °C for 0.5 min, were heated to the cross-linking temperature with 200 °C min−1 heating rate, and were kept there for 2 h. Then the samples were cooled down to 0 °C with 20 °C min−1 heating rate and were kept there for 1 min. Then the samples were heated up to 250 °C with 20 °C min−1 and kept there for 1 min. The Tg onset value and the residual reaction heat were determined from this heating period. The samples were cooled down to 0 °C with 20 °C min−1 heating rate; then, they were kept there for 1 min and were heated back to 250 °C with 20 °C min−1 heating rate. The residual \( (\Delta H_{\text{res}} ) \) and total \( (\Delta H_{\text{total}} ) \) reaction heat (see below) were used to calculate the conversion (α) of the curing. The dα/dt function was calculated from the numerical derivate of the isothermal heatwave–time curve. The Tg of the 1:1.5 0–30% series was determined from the last heating period. (The isothermal step was at 90 °C.)
The total reaction heat of the cross-linking reaction was determined via a screening method. The samples (3–5 mg) were kept at 30 °C for 0.5 min and then were cooled down to 0 °C. Then the samples were heated with 20 °C min−1 heating rate to 250 °C and were kept there for 1 min. The total reaction heat was determined from the exothermal peak located at this period. Then the samples were cooled to 0 °C with 20 °C min−1 and were kept there for 1 min. The cooling curves were checked for any residual reaction heat. The samples were then heated up to 250 °C with 20 °C min−1.
Quantum chemical computation
The geometry optimizations, transition state searches, and frequency calculations were carried out using the B3LYP functional [55] with the 6-31G(d,p) basis set [56] utilizing the Gaussian 09 quantum chemistry program [57]. The Gibbs free energy barrier \( (\Delta G(298\;{\text{K}})) \) of the reactions was calculated as \( \Delta G\left( {298\;{\text{K}}} \right) = \Delta E_{\text{e}} + \Delta E_{\text{ZPE}} + \Delta G_{0 \to 298} \), where \( \Delta E_{\text{e}} \) is the difference of electronic energies, \( \Delta E_{\text{ZPE}} \) is the difference of zero-point vibrational energies, while \( \Delta G_{0 \to 298} \) is the difference of thermal corrections to free energy between the initial and transition states. To improve the accuracy of the results, single-point calculations were performed for the preferred reaction path using the local natural orbital coupled-cluster singles, doubles, and perturbative triples [LNO-CCSD(T)] method [58] with the aug-cc-pVTZ basis set [59] using the MRCC program suite [60]. Then, the B3LYP/6-31G(d,p) electronic energy was replaced with the obtained LNO-CCSD(T)/aug-cc-pVTZ electronic energy to get the improved free energy barrier.
Results and discussion
Oligoterephthalamide characterization
Functional group analysis and FTIR and TGA measurements were used to determine the success of the aminolysis reaction. The measured amine values decreased with decreasing the ratio of IPD. This suggests that different molecular weighed terephthalamides were produced (Table 1). Based on the measured amine values, the main components of the 1:1.5 and 1:2 reaction should be the monomer (4.26 mmol g−1, 470.69 g mol−1) and dimer (2.60 mmol g−1; 771.09 g mol−1) terephthalamide derivates. The molecular weight difference between the two products was also confirmed with solution viscosimetry. The intrinsic viscosity of the 1:1.5 product was found to be significantly higher than the 1:2 ratio products. The hydroxyl content of the reaction products comes from ethylene–glycol. The OH content of the 1:2 and 1:1.5 ratio reaction products was 80–90% of the theoretical maximum that derives from the weighed in PET granules. The hydroxyl content of the 1:1 ratio product was 43%.
In the cases of 1:1.5 and 1:2, no residual ester groups were present, and the total amidation was achieved (1640 cm−1 amide carbonyl valence vibration and 1549 cm−1 N–H plain bending deformation). The ester attributed peaks (1720 cm−1 ester carbonyl valence vibration and 1530 cm−1 ester C–O–C bending vibration) were absent from their FTIR spectra. The characteristic end-group (–Ph–COO–CH2–CH2–OH) rocking vibrations of PET at 720 cm−1 disappeared in the aminolysis products. The 1:1 reaction mixture was highly viscous at the reaction temperature, and the reaction was hard to manage. This ratio probably resulted in even longer oligomer chains that had residual ester linkages as its FTIR spectrum suggested (Fig. 2). The ratio of the used IPD was too low for any practical use. Due to the presence of residual ester groups, the 1:1 ratio was not studied further. Only functional group analysis and FTIR and TGA measurements were done on the 1:1 ratio product. The TGA measurements of the aminolysis products further supported the success of the aminolysis reactions (Fig. 3). The 1:1.5 and 1:2 reaction products showed two distinct peaks in their DTG curves. The terephthalamides showed high thermal stability (~ 460 °C); only the evaporation of the ethylene–glycol could be observed in their TGA curves below their thermal degradation. On the contrary, the 1:1 ratio product showed a shoulder at lower temperatures (~ 410 °C) that suggested the presence of less thermally stable components or segments, probably esters in the reaction product. The volatile component content of the aminolysis products increased (15.2%, 20.8% and 34.7% weight loss at 350 °C), respectively, with the increasing IPD ratio. Bellow 200 °C the aminolysis products had a similar behavior.

FTIR spectra of the aminolysis products and the PET granules

TGA and DTG curves of the aminolysis products
Molecular structure characterization of the aminolysis products
NMR spectrometry was used to compare the 1:1.5 and 1:2 ratio reaction products. 2D correlative NMR spectroscopy measurements (1H–1H COSY, 1H–1H NOESY, 1H–13C HSQC, 1H–13C HMBC) were done to fully assign the spectra of the 1:1.5 ratio product. The 1:2 ratio reaction was thoroughly studied and fully assigned in our previous work [37]. For the 2D correlative spectra of the 1:1.5 reaction product, see the Online Resource. The hydrogen and carbon atoms were numbered as shown in Fig. 4. In both cases, we looked for traces of the amidation in the NMR spectra in comparison with the reagent IPD. The chemical shift of the IPD-related hydrogen and carbon atoms changes due to the amidation. Slight changes in chemical shifts and peak duplication appeared in the case of the methyl groups (4iekv, 5jax, and 7 h). Low intensity peaks around the a, c, e, i, j, and h main peaks can be observed in the 13C spectra of both reaction products (Fig. 5). These low intensity peaks indicate the slight chemical shift changes of the carbon atoms due to the amide group formation on one or both amine groups. The carbon and hydrogen atoms near the amide groups (2b, 8 g) showed the most significant change in their chemical shifts in the 1H and 13C spectra. The 2, 2′, 8, and 8′ peaks in the 1H were integrated for quantitative analysis. An amine/amide ratio was calculated for both groups to compare the reactivity of the different amines, the average amidation percentage, and the number average molar masses of the aminolysis products. As Table 2 shows, the amide ratio changed with the initial ratio of PET and IPD. The cycloaliphatic connected amine groups (2) showed—as expected—lower amine/amide ratio than the aliphatic connected amine groups (8). Overall the higher aspect of amide ratio in 1:1.5 reaction product suggests a higher molecular weight as well. The 1:1.5 product showed worse solubility in both ethanol and IPD than the 1:2 ratio product. The specific viscosity of the samples measured in ethanol at 40 °C further supported this observable difference (Table 1). The calculated number average molar masses suggest that the 1:1.5 reaction product is mostly a mixture of the dimer (771.09 g mol−1) and trimer (1071 g mol−1), and the 1:2 reaction product is mostly a mixture of monomer (470.69 g mol−1) and dimer. Due to their rather high molecular weight, we will refer to the dimers, trimers, or any longer chained species collectively as oligomers.

The 1H NMR spectrum of PET/IPD 1:1.5 and the used numbering (numbers for H, alphabet for C) on the theorized reaction product

13C spectrum of the 1:1.5 depolymerization product
As seen in Fig. 6, one main series appeared in both MALDI-TOF spectra (PET/IPD, 1:1.5 and 1:2). Those series were identified as terephthalamide oligomers where the composition of the monomer unit is the following ((C10H19N)(C8H5O2N) (arrows in Fig. 6a, b). The end groups are hydrogen and isophorondiamine as it is presented in Fig. 6. The measured m/z values are in good agreement with the simulated ones. For example, the m/z of the oligomer with polymerization degree of 3 is 1093.719 (simulated), while the measured mass is 1093.731. Beside the accurate mass, the isotopic distribution supports the chemical composition of [C10H21N2((C10H19N)(C8H5O2N))3H + Na]+ for that adduct ion. As a minor series, the terephthalamide oligomers appeared with hydroxyl and hydrogen end groups. As it turns out from Fig. 6, the higher PET/IPD ratio (Fig. 6b) results in higher molecular weight products up to m/z 3000. The number and weight average molecular weights were determined based on the main series. The number average molecular weights are 1040 g mol−1 and 860 g mol−1 for PET/IPD 1:1.5 and 1:2, respectively (Table 2).

The mass spectra of PET/IPD 1:1.5 (a) and 1:2 (b) products. The structures show the identified oligomers
Cross-linker effect on gelation and glass transition
The amine values of the cross-linker solution series can be found in Table 3. The 1:1.5 solution series followed a linear decreasing trend with the increasing concentration of the dissolved reaction product. In our previous work, we tested the catalytic effect of the terephthalamides with gel time measurements and reaction heat measurements with DSC. A solution series of a PET/IPD 1:2 ratio reaction product and a model IPD-EG solution series were studied. We found that the terephthalamide solutions have a significant accelerative effect on the curing of epoxy resins. Since the amide group cannot react with the glycidyl ether groups, these should be considered catalysts beside their role as a cross-linker. The gel point data of the 1:2 and IPD-EG solution series are added to Fig. 7 as Ref. [37]. The gel time of the 1:1.5 solution series followed a near linear, declining tendency, but compared to 1:2 series from our previous study higher gel time was achieved. This result may be explained by the fact that the 1:1.5 reaction product has higher molecular weight than the 1:2 ratio product. The higher molecular weight of the 1:1.5 product probably slowed down the diffusion of the amide groups and restricted their availability in the system. Since the amide groups are connected (oligomers) their distribution in the reaction medium is not as homogenous as the lower Mw amides. It can therefore be assumed that the longer oligoamides should have lower catalytic activity. Both reaction solution series had faster gelation time than the IPD-EG model solution series. The IPD-EG solution was designed to have an equivalent concentration of EG as a PET/IPD 1:2 solution [37]. This clearly demonstrates the catalytic effect of the amides. To thoroughly characterize this effect, isothermal kinetic studies were carried out with DSC. The conversion (α) of the isothermal curing was determined with the following equation:

Gel time of epoxy resins cross-linked with the PET/IPD and the IPD-EG model solution series. The hollow points are used as a reference from our previous study [37]
The isothermal heatwave–time functions were calculated to conversion time (α(t)) functions. Numerical derivates were calculated to determine the dα/dt (α) functions to characterize the reaction kinetics.
The conversion dependence of the glass transition temperature in cross-linked systems is generally agreed on. The glass transition of a curing system approximates the equilibrial Tg with the increasing conversion. The Tg onset of the studied systems was measured, and an increasing tendency was found with the conversion level (Fig. 8a). In our previous study, we showed that terephthalamides have a decreasing effect on the glass transition in IPD-based epoxy systems. Due to the higher molecular weight of the cross-linking agent (compared to IPD), the cross-link density decreases, and as a result the Tg decreases as well [37]. In this study a five-point concentration series was prepared of the 1:1.5 reaction product to study the effect of longer cross-linker molecules on the Tg (Fig. 8b). Due to the even higher molecular weight of the 1:1.5 reaction product, the glass transition temperature considerably decreased at a narrower concentration interval. The Tg values of the 1:2 reaction series of our previous work were added as Ref. [37].

The Tg onset (a) and the Tg (b) of epoxy resins cross-linked with the PET/IPD solution series The hollow points are used as a reference from our previous study [37]
Epoxy cross-linking kinetics characterization
Five different cross-linkers were compared in our kinetics study at five different curing temperatures. Commercial IPD (IPOX® ER 2943) was used as a reference. 1:2 30% and 50% solutions and 1:1.5 15% and 30% solutions were used to quantitatively compare the reaction products and the reference material. Just as the gelation measurements suggested the terephthalamide solutions proved to be more active during cross-linking than the IPD. The reaction rate increased with the cross-linking temperature, and in almost all cases the IPD < 1:1.5 < 1:2 trend can be observed. See the Supplementary Materials for a direct comparison between of the commercial IPD, 1:1.5 solution series, and the 1:2 solution series cure kinetics curves at the different temperatures. The applied kinetic models and calculated values are representative of the studied system as a whole.
Figure 9 compares the cross-linkers at different curing temperatures. The commercial IPD was the least active, and the 1:2 50% solutions were the most active at all the curing temperatures. The 1:1.5 15% solution was the least active among the terephthalamide solutions. The 1:1.5 30% and 1:2 30% solutions “competed,” at the early stages of the reaction (α = 0–0.4). The 1:2 30% solution showed higher activity at 60 °C, 80 °C, and 90 °C. 1:1.5 30% and 1:2 30% solutions had similar reactivity at 100 °C. These trends and activity ranking were completely disrupted at 40 °C because the curing reaction was substantially governed by diffusion. The amide catalytic effect kick-started the reactions even at this low temperature, but the high molecular weighed components significantly increased the viscosity and diffusion rates. Thus, almost none of the samples except 1:2 30% could achieve higher than 60% conversion. Since the viscosity of this sample is lower than any of the used terephthalamide solutions (see Supplementary Material), the amide catalytic effect might have been able to push the reaction further to a higher conversion rate [37]. The conversion rate increased with the curing temperature and approximated 100%. The dα/dt (α) functions of the least active cross-linkers showed a plateau-like behavior. This indicates a decrease in the activity of the reaction and the increasing influence of diffusion during curing. The slope of the dα/dt (α) functions started to follow a near linear declining trend around a 40% conversion rate. At higher temperatures (80 °C, 90 °C, and 100 °C), a second change of slope can be observed around 60% conversion rate that indicated the slowing down of the reaction.

The dα/dt (α) functions plotted at different curing temperatures
Three kinetic models, the Kamal–Sourour (Eq. 1) [26, 27], a revised Kamal model by Cole diffusion factor (fd(α)) (Eq. 2) [29], and revised Kamal model by Fournier diffusion factor (Eq. 3) [31], were used to fit to the dα/dt (α) functions. The revisions on the Kamal–Sourour model serve as a way to consider the diffusion-controlled regime of the curing reaction with a fd(α) function. The k1 and k2 are the kinetic rate constants of the uncatalyzed and autocatalyzed reaction, respectively. The n and m are fitting parameters thought to be connected to the order of the reaction (n + m); they allow a more precise fitting. As the reaction progresses, the increase in molecular weight slows down the reaction. The αc parameter in Eq. 2 is defined as the critical conversion point where the diffusion control becomes dominant over chemically controlled regime. The C is a fit parameter. The αf in Eq. 3 is not a fit parameter; it is the maximal conversion that was achieved during the isothermal curing. The b parameter is a fit parameter. Since Eqs. 2 and 3 are quite similar, the C ~ b−1 relationship is expected.
The three models resulted in similar k1 and k2 reaction rate constants. The revised models resulted in better fits at lower (40 °C and 60 °C) curing temperatures. At higher cure temperatures (80 °C, 90 °C, and 100 °C), the three models resulted in almost identical k1 and k2 values. The Arrhenius plot of both k1 and k2 showed declining tendency, indicating that the reactions became more active at higher temperatures, although k1 scattered considerably (Fig. 10). The autocatalytic k2 rate constant followed an almost linear tendency in the Arrhenius plot and is several magnitudes higher than k1. The calculated k2 values allowed us to rank the autocatalytic activity of the cross-linking agents. The following rank was found at all curing temperature with all the applied models: commercial IPD < 1:1.5 15% < 1:1.5 30% < 1:2 30% < 1:2 50%. The 40 °C and 60 °C k2 values diverged from the linear determined by k2 values determined at higher cure temperatures. This could be explained by the stronger effect of the diffusion-controlled regime at lower temperatures. The higher diffusion rate causes the reaction to diverge from the classical Arrhenius-type behavior. Thus, the calculated values will shift. Due to these reasons, only the higher cure temperature data (80 °C, 90 °C, and 100 °C) were used to calculate the activation energy of the autocatalytic reactions.

Arrhenius plot of k1 and k2 reaction rate constants calculated with the Kamal–Sourour model equation
The n and m fit parameters both showed an increasing tendency with the cure temperature (Fig. 11). The m parameter showed almost no dependence on the cross-linking agent, and a clear monotone increasing tendency was found between the 0–0.4 interval. The m parameter is almost independent on the used model, and it clearly resembled the dependence of k2 on temperature. On the other hand, just as k1 the n parameter strongly coherently changed with the temperature, the cross-linking agent, and the applied model. The n parameter value scattered between a wide interval. The n and m parameters calculated from the revised Kamal models (Eqs. 2, 3) shifted to lower values at the lower cure temperatures (40 °C and 60 °C). n + m is thought to be the overall reaction order, and it is usually between the 2 and 3 interval. In our case n + m scattered around 2 in the 1.5–2.5 interval. Although in some cases with the revised Kamal models even n + m < 1 was observed at 40 °C and 60 °C, this probably results from the mistakes of the fitting process. There is no general agreement about the value and temperature dependence of these parameters.

The n and m fit parameters calculated from the Kamal–Sourour, Cole, and Fournier models
Figure 12 shows the fit parameters of the revised Kamal models (Eqs. 2, 3). Equations 2 and 3 are similarly built models, but their principals differ (see Online Resource). Equation 2 utilizes αc as a fit parameter and defines it as the critical conversion point where the diffusion-controlled regime becomes dominant over the chemically controlled regime. On the contrary, the αf in Eq. 3 is the maximum conversion reached during the isothermal curing. In our case αc approximated the value of αf and both parameters increased and approximated α = 1 value. All things considered, αc might not fulfill its original definition and purpose. The C parameter (Eq. 2), just as b (Eq. 3), acts as a way to consider the restraining effect of diffusion. The authors believe Eq. 3 is the better one of the used revised models. As we have stated earlier, a C ~ b−1 connection is expected, and that is roughly fulfilled. At higher cure temperatures, both parameters had taken extreme values, and as a result, Eqs. 2 and 3 approximated the values given by the original Kamal–Sourour equation (Eq. 1). The R2 values increased at lower cure temperatures (40 °C and 60 °C) due to the use of revised models, and a better fit was achieved (see Online Resource).

The Cole (a and b) and Fournier (c and d) revised Kamal model fit parameters
The Arrhenius equation was used to calculate the activation energy and preexponential factors of the non-catalytic (k1) and catalytic (k2) reactions (Fig. 13). The non-catalytic reaction rate value heavily scattered with the curing temperature and the used cross-linking agent. Therefore, one or two points had to be left out of the fitting process to determine the activation energy values. Due to these reasons, the calculated activation energy of the non-catalytic reaction is ambiguous, unreliable. (see the Supplementary Material).

The calculated activation energy and preexponential factors for the autocatalyzed reaction
The activation energy of the autocatalytic reaction in the terephthalamide solution series was compared to the commercial IPD (Fig. 13). In the case of the samples cured with only commercial IPD only, the secondary hydroxyl groups formed during the curing can act as a catalyst. The activation energy of the catalyzed reaction decreased due to the terephthalamides. The 1:2 30% and 50% solutions caused the most significant decrease of 10–15 kJ mol−1 in the activation energy. The activation energy of the reaction decreased with the concentration with the 1:2 series. In comparison 1:1.5 15% and 30% solutions could only achieve a 5–10 kJ mol−1 decrease. Surprisingly, the activation energy of the 30% solution was found to be higher than the 15% solution. These relationships may partly be explained by the molecular weight difference between the 1:2 and 1:1.5 reaction products. There are similarities between the attitudes expressed by this phenomenon, those described by the rotational viscosity measurements. The 1:1.5 solution series proved to be slightly less effective in enhancing the curing in comparison with the 1:2 series. Thus, it can be concluded that the produced terephthalamides can act as a catalyst in epoxy systems and their catalytic activity can be influenced by their molecular weight.
Catalytic effect of amides studied with computational chemistry
Figure 14 shows the computationally studied reactions, i.e., the reaction of epoxy with the possible amine derivatives. The studied epoxy amine curing reaction according to Ehlers et al. can follow a direct or an indirect mechanism [32]. The corresponding general transition states are shown in Fig. 15. On the direct path the epoxy ring breaks up, the amine connects to the free CH2 of the epoxy, and the O of the epoxy ring is hydrogenated by the catalyst (or the reactant, if there is no catalyst), which regenerates instantly with a H from the reactant amine group. In contrast, during the indirect path, the catalyst only stabilizes the free O group of the epoxy after the ring breaking, and its hydrogenation happens later in the process. The investigation of whole polymer chains with the chosen method would be impracticable; therefore, the reduced size epoxy and amines used to model the reaction are shown. (The wavy line represents that the chain would continue from there.) As catalyst/accelerator, glycol, phenol, and the self-catalysis of the possible amine and amide groups of the two amine reactants were studied.

The scheme of the studied epoxy curing reactions

The general structure of the possible transition states in the studied reactions
Table 4 summarizes the energy barriers of the possible settings. The coordinates and energies of the structures are presented in the Supplementary Material. The transition states of direct path have an imaginary frequency of 370.3–441.4 cm−1, while the TSs of the indirect path have 375.4–406.2 cm−1. It can be seen that in every case the energy barrier of the indirect path is lower with 30–95 kJ mol−1 than the direct path, i.e., the indirect path is favored. Therefore, the more accurate LNO-CCSD(T) calculations were performed only for the indirect path. The difference between DFT and LNO-CCSD(T) results can reach 11.7 kJ mol−1; however, the trends are similar, and therefore, the results of the more reliable LNO-CCSD(T) are discussed here. Also, there is no notable difference in the reactivity of the c-NH2 and R-CH2-NH2 groups.
Comparing the effects of the catalysts, it can be seen that PhOH is the best performing with the lowest barrier, 86.6–92.1 kJ mol−1. Amide groups have almost the same catalytic effect, regardless of type, with barrier of 90.8–98.8 kJ mol−1. Glycol is also effective to catalyze the curing reaction with a slightly higher barrier, 103.2–106.4 kJ mol−1. The catalytic effect of the amine groups results in barriers of 123.0–132.1 kJ mol−1, meaning that they are worse than the –OH and –NH groups but still better than if there was no catalyst (barriers of 157.4–157.9 kJ mol−1). The notable difference between experimental and calculated activation energies can be attributed to the approximations of the calculations, i.e., gas-phase calculations with the relevant part of the species. Nevertheless, the applied model is able to reveal the differences in activity between the possible catalysts. In summary, according to the calculations, the curing reaction occurs with the indirect mechanism, and the amide groups of the reactants are as good as the phenol as a catalyst of this reaction.
Conclusions
In our previous study, we observed the catalytic effect of amides during the curing of epoxy resins and we showed that raw aminolysis products of PET can be applied as epoxy cross-linkers. The main purpose of this study was to quantitatively characterize the catalytic effect of terephthalamides. We have further decreased the required amount of diamine compound during PET aminolysis to produce oligoamides. The aminolysis products were used as co-cross-linkers with isophorondiamine to study their effect on the curing reaction and glass transition temperature.
The aminolysis of PET was carried out with different PET/IPD ratios (1:1, 1:1.5, and 1:2). Based on the functional group analysis and FTIR and TGA measurements, total amidation was achieved in the case of the 1:1.5 and 1:2 ratios. The 1:1 ratio was found to be too low to achieve total amidation; traces of residual ester groups were found in the reaction product. Based on the functional group analysis and the capillary viscosity measurements, the molecular weight of the 1:1.5 and 1:2 ratio products differs. The 1:1.5 and 1:2 ratio reaction products were compared with NMR. The quantitative analysis of the 1H and MALDI-TOF spectra further supported that the 1:1.5 ratio reaction product has higher molecular weight than the 1:2 ratio product. Further lowering of the used amine ratio resulted in increasing the molecular weight of the terephthalamides. Thus, the aminolysis of PET can be also used to produce oligoamides. The 1:1.5 reaction product was shown to more effective in decreasing the glass transition temperature of epoxy systems than the 1:2 ratio product.
The rotational viscosimetry and DSC reaction kinetics measurements confirmed the catalytic effects of the terephthalamides during curing. The terephthalamides are double-purposed components that can also acts as cross-linkers and capable catalysts that can kick-start the curing reaction. Their higher molecular weight can also decrease the diffusion rates in the system that could set back the reaction at lower cure temperatures. This effect can be completely negated at higher cure temperatures (Tcure > 60 °C). Three models, the Kamal–Sourour and two revised Kamal models, were used to quantitatively describe the kinetics of curing. Our calculations show that at 40 °C and 60 °C the revised models result in a better fit. At higher cure temperatures, the revised models gave almost the same results as the Kamal–Sourour equation and high R2 values were achieved. The non-catalytic-related reaction rate k1 and the fit parameter n significantly scattered, while the autocatalytic-related reaction rate k2 and fit parameter m increased with the cure temperature. The k2 values of the solutions series ranked as the following at all cure temperatures: commercial IPD < 1:1.5 15% < 1:1.5 30% < 1:2 30% < 1:2 50%. Thus, these experiments confirmed that the increase in molecular weight of terephthalamides results in decreased catalytic activity during epoxy curing. The activation energies of the autocatalytic reaction were found to decrease with the presence of terephthalamides in the cross-linking agent.
The quantum chemical calculations show that the indirect pathway is preferred compared to the direct one in the epoxy curing reaction. Even though the phenol catalyzed reaction has the lowest barrier, amide groups have almost the same catalytic activity, better than the glycol and amine groups.
In conclusion, we have shown that PET-derived oligoamides can be used to cure epoxy resins. They can be used as double-purpose components in epoxy systems as cross-linkers and catalysts. Their effects on the curing reaction and properties of the cured resin can be tailored with their molecular weight.
References
Enns JB, Gillham JK (1983) Time–temperature–transformation (TTT) cure diagram: modeling the cure behavior of thermosets. J Appl Polym Sci 28:2567–2591. https://doi.org/10.1002/app.1983.070280810
Wisanrakkit G, Gillham JK, Enns JB (1990) The glass transition temperature (Tg) as a parameter for monitoring the cure of an amine/epoxy system at constant heating rates. J Appl Polym Sci 41:1895–1912. https://doi.org/10.1002/app.1990.070410743
Datta J, Błażek K, Włoch M, Bukowski R (2018) A new approach to chemical recycling of polyamide 6.6 and synthesis of polyurethanes with recovered intermediates. J Polym Environ 26:4415–4429. https://doi.org/10.1007/s10924-018-1314-4
Wang J, Liang G, Zhao W, Zhang Z (2006) Viscoelastic, thermal and mechanical properties of dicyclopentadiene bisphenol diyanate ester/epoxy co-polymers. Polym Bull 57:945–952. https://doi.org/10.1007/s00289-006-0646-8
Hale A, Macosko CW, Bair HE (1991) Glass transition temperature as a function of conversion in thermosetting polymers. Macromolecules 24:2610–2621. https://doi.org/10.1021/ma00009a072
O’Brien DJ, Mather PT, White SR (2001) Viscoelastic properties of an epoxy resin during cure. J Compos Mater 35:883–904. https://doi.org/10.1106/HLYM-5CM7-BP9N-L1Y1
Marks MJ, Snelgrove RV (2009) Effect of conversion on the structure-property relationships of amine-cured epoxy thermosets. ACS Appl Mater Interfaces 1:921–926. https://doi.org/10.1021/am900030u
Incerti D, Wang T, Carolan D, Fergusson A (2018) Curing rate effects on the toughness of epoxy polymers. Polymer 159:116–123. https://doi.org/10.1016/j.polymer.2018.11.008
Riad KB, Schmidt R, Arnold AA et al (2016) Characterizing the structural formation of epoxy-amine networks: the effect of monomer geometry. Polymer 104:83–90. https://doi.org/10.1016/j.polymer.2016.09.077
Feng Y, Hu Y, Man L et al (2019) Biobased thiol-epoxy shape memory networks from gallic acid and vegetable oils. Eur Polym J 112:619–628. https://doi.org/10.1016/j.eurpolymj.2018.10.025
Morsch S, Kefallinou Z, Liu Y et al (2018) Controlling the nanostructure of epoxy resins: reaction selectivity and stoichiometry. Polymer 143:10–18. https://doi.org/10.1016/j.polymer.2018.03.065
Shibata M, Fujigasaki J, Enjoji M et al (2018) Amino acid-cured bio-based epoxy resins and their biocomposites with chitin- and chitosan-nanofibers. Eur Polym J 98:216–225. https://doi.org/10.1016/j.eurpolymj.2017.11.024
Shechter L, Wynstra J (1956) Glycidyl ether reactions with alcohols, phenols, carboxylic acids, and acid anhydrides. Ind Eng Chem 48:86–93. https://doi.org/10.1021/ie50553a028
Shechter L, Wynstra J, Kurkjy RP (1956) Glycidyl ether reactions with amines. Ind Eng Chem 48:94–97. https://doi.org/10.1021/ie50553a029
Corezzi S, Palmieri L, Kenny JM, Fioretto D (2005) Clustering, glass transition and gelation in a reactive fluid. J Phys: Condens Matter 17:S3557–S3563. https://doi.org/10.1088/0953-8984/17/45/048
Corezzi S, Fioretto D, Santucci G, Kenny JM (2010) Modeling diffusion-control in the cure kinetics of epoxy-amine thermoset resins: an approach based on configurational entropy. Polymer 51:5833–5845. https://doi.org/10.1016/j.polymer.2010.09.073
Rabearison N, Jochum C, Grandidier JC (2011) A cure kinetics, diffusion controlled and temperature dependent, identification of the Araldite LY556 epoxy. J Mater Sci 46:787–796. https://doi.org/10.1007/s10853-010-4815-7
Zvetkov VL, Calado V (2013) Comparative DSC kinetics of the reaction of DGEBA with aromatic diamines. III. Formal kinetic study of the reaction of DGEBA with diamino diphenyl methane. Thermochim Acta 560:95–103. https://doi.org/10.1016/j.tca.2013.02.017
Bernath A, Kärger L, Henning F (2016) Accurate cure modeling for isothermal processing of fast curing epoxy resins. Polymers 8:1–19. https://doi.org/10.3390/polym8110390
Ren R, Xiong X, Ma X et al (2016) Isothermal curing kinetics and mechanism of DGEBA epoxy resin with phthalide-containing aromatic diamine. Thermochim Acta 623:15–21. https://doi.org/10.1016/j.tca.2015.11.011
Patel A, Kravchenko O, Manas-Zloczower I (2018) Effect of curing rate on the microstructure and macroscopic properties of epoxy fiberglass composites. Polymers 10:125. https://doi.org/10.3390/polym10020125
Konuray AO, Fernández-Francos X, Ramis X (2017) Analysis of the reaction mechanism of the thiol–epoxy addition initiated by nucleophilic tertiary amines. Polym Chem 8:5934–5947. https://doi.org/10.1039/C7PY01263B
Santín D, Konuray O, Fernàndez-Francos X, Ramis X (2019) Kinetics analysis and simulation of sequential epoxy dual-curing systems with independent thermal activation. Thermochim Acta 673:158–168. https://doi.org/10.1016/j.tca.2019.01.023
Smith IT (1961) The mechanism of the crosslinking of epoxide resins by amines. Polymer 2:95–108. https://doi.org/10.1016/0032-3861(61)90010-6
Horie K, Hiura H, Sawada M et al (1970) Calorimetric investigation of polymerization reactions. III. Curing reaction of epoxides with amines. J Polym Sci Part A-1 Polym Chem 8:1357–1372. https://doi.org/10.1002/pol.1970.150080605
Kamal MR (1974) Thermoset characterization for moldability analysis. Polym Eng Sci 14:231–239. https://doi.org/10.1002/pen.760140312
Sourour S, Kamal MR (1976) Differential scanning calorimetry of epoxy cure: isothermal cure kinetics. Thermochim Acta 14:41–59. https://doi.org/10.1016/0040-6031(76)80056-1
Chern C-S, Poehlein GW (1987) A kinetic model for curing reactions of epoxides with amines. Polym Eng Sci 27:788–795. https://doi.org/10.1002/pen.760271104
Cole KC, Hechler JJ, Noël D (1991) A new approach to modeling the cure kinetics of epoxy amine thermosetting resins. 2. Application to a typical system based on bis[4-(diglycidylamino)phenyl]methane and bis(4-aminophenyl) sulfone. Macromolecules 24:3098–3110. https://doi.org/10.1021/ma00011a012
Deng Y, Martin GC (1994) Diffusion and diffusion-controlled kinetics during epoxy-amine cure. Macromolecules 27:5147–5153. https://doi.org/10.1021/ma00096a043
Fournier J, Williams G, Duch C, Aldridge GA (1996) Changes in molecular dynamics during bulk polymerization of an epoxide-amine system as studied by dielectric relaxation spectroscopy. Macromolecules 29:7097–7107. https://doi.org/10.1021/ma9517862
Ehlers J-E, Rondan NG, Huynh LK et al (2007) Theoretical study on mechanisms of the epoxy-amine curing reaction. Macromolecules 40:4370–4377. https://doi.org/10.1021/ma070423m
McCoy JD, Ancipink WB, Clarkson CM et al (2016) Cure mechanisms of diglycidyl ether of bisphenol A (DGEBA) epoxy with diethanolamine. Polymer 105:243–254. https://doi.org/10.1016/j.polymer.2016.10.028
Hesabi M, Salimi A, Beheshty MH (2017) Effect of tertiary amine accelerators with different substituents on curing kinetics and reactivity of epoxy/dicyandiamide system. Polym Test 59:344–354. https://doi.org/10.1016/j.polymertesting.2017.02.023
Hesabi M, Salimi A, Beheshty MH (2019) Development of amine-based latent accelerator for one-pot epoxy system with low curing temperature and high shelf life. Eur Polym J 112:736–748. https://doi.org/10.1016/j.eurpolymj.2018.10.044
Ellis B (1993) Chemistry and technology of epoxy resins. Springer, Dordrecht
Karpati L, Fejer M, Kalocsai D et al (2019) Synthesis and characterization of isophorondiamine based epoxy hardeners from aminolysis of PET. Express Polym Lett 13:618–631. https://doi.org/10.3144/expresspolymlett.2019.52
Dutt K, Soni RK (2014) Synthesis and characterization of bis-amino ethyl terephthalamide from PET waste and its applications as hardener in DGEBA. Int J Plast Technol 18:16–26. https://doi.org/10.1007/s12588-014-9071-2
Czub P (2009) Synthesis and modification of epoxy resins using recycled poly(ethylene terephthalate). Polym Adv Technol 20:183–193. https://doi.org/10.1002/pat.1251
Spychaj T, Fabrycy E, Spychaj S (2001) Aminolysis and aminoglycolysis of waste poly (ethylene terephthalate). Polymer. https://doi.org/10.1007/s10163-000-0036-5
Spychaj T, Pilawka R, Spychaj S, Bartkowiak A (2004) Tertiary alkanolamines as solvolytic agents for poly(ethylene terephthalate). Evaluation of the products as epoxy resin hardeners. Ind Eng Chem Res 43:862–874. https://doi.org/10.1021/ie030356u
Fukuda Y, Miyamae K, Sasanuma Y (2017) Computational design of polymers: poly(ester amide) and polyurethane. RSC Adv 7:38387–38398. https://doi.org/10.1039/C7RA05395A
Johansson A, Kollman P, Rothenberg S, McKelvey J (1974) Hydrogen bonding ability of the amide group. J Am Chem Soc 96:3794–3800. https://doi.org/10.1021/ja00819a013
Gellman SH, Dado GP, Liang GB, Adams BR (1991) Conformation-directing effects of a single intramolecular amide–amide hydrogen bond: variable-temperature NMR and IR studies on a homologous diamide series. J Am Chem Soc 113:1164–1173. https://doi.org/10.1021/ja00004a016
Kárpáti L, Hamar G, Vargha V (2019) The sequenced structure of amino-alcohol-based random poly(ester amide)s. J Therm Anal Calorim 136:737–747. https://doi.org/10.1007/s10973-018-7712-y
Rokicka J, Lenarczyk P, Ukielski R (2016) Synthesis and mechanical and thermal properties of multiblock terpoly(ester-ether-amide) thermoplastic elastomers with variable molecular weight of ester block. J Therm Anal Calorim 125:351–360. https://doi.org/10.1007/s10973-016-5389-7
Çam Ç, Bal A, Güçlü G (2015) Synthesis and film properties of epoxy esters modified with amino resins from glycolysis products of postconsumer PET bottles. Polym Eng Sci 55:2519–2525. https://doi.org/10.1002/pen.24142
More AP, Kute RA, Mhaske ST (2014) Chemical conversion of PET waste using ethanolamine to bis(2-hydroxyethyl) terephthalamide (BHETA) through aminolysis and a novel plasticizer for PVC. Iran Polym J 23:59–67. https://doi.org/10.1007/s13726-013-0200-0
Tawfik ME, Ahmed NM, Eskander SB (2011) Aminolysis of poly(ethylene terephthalate) wastes based on sunlight and utilization of the end product [bis(2-hydroxyethylene) terephthalamide] as an ingredient in the anticorrosive paints for the protection of steel structures. J Appl Polym Sci 120:2842–2855. https://doi.org/10.1002/app.33350
Parab YS, Wasekar PA, Mhaske ST, Shukla SR (2014) Novel synthesis, characterization and application of dibutyrate bis(2-hydroxyethyl) terephthalamide as a plasticizer in PVC compounding. Polym Bull 71:2695–2707. https://doi.org/10.1007/s00289-014-1218-y
Bulak E, Acar I (2014) The use of aminolysis, aminoglycolysis, and simultaneous aminolysis–hydrolysis products of waste PET for production of paint binder. Polym Eng Sci 54:2272–2281. https://doi.org/10.1002/pen.23773
Palekar VS, Damle AJ, Shukla SR (2009) Synthesis and antibacterial activity of some novel bis-1,2,4-triazolo[3,4-b]-1,3,4-thiadiazoles and bis-4-thiazolidinone derivatives from terephthalic dihydrazide. Eur J Med Chem 44:5112–5116. https://doi.org/10.1016/j.ejmech.2009.07.023
Kárpáti L, Szarka G, Hartman M, Vargha V (2018) Oligoester and polyester production via acido-alcoholysis of PET waste. Period Polytech Chem Eng 62:336–344. https://doi.org/10.3311/PPch.11513
Kárpáti L, Fogarassy F, Kovácsik D, Vargha V (2019) One-pot depolymerization and polycondensation of PET based random oligo- and polyesters. J Polym Environ 27:2167–2181. https://doi.org/10.1007/s10924-019-01490-3
Becke AD (1993) Density-functional thermochemistry. III. The role of exact exchange. J Chem Phys 98:5648–5652. https://doi.org/10.1063/1.464913
Hariharan PC, Pople JA (1973) The influence of polarization functions on molecular orbital hydrogenation energies. Theor Chim Acta 28:213–222. https://doi.org/10.1007/BF00533485
Frisch MJ, Trucks GW, Schlegel HB, et al (2016) Gaussian 09, Revision E.01
Nagy PR, Samu G, Kállay M (2018) Optimization of the linear-scaling local natural orbital CCSD(T) method: improved algorithm and benchmark applications. J Chem Theory Comput 14:4193–4215. https://doi.org/10.1021/acs.jctc.8b00442
Kendall RA, Dunning TH, Harrison RJ (1992) Electron affinities of the first-row atoms revisited. Systematic basis sets and wave functions. J Chem Phys 96:6796–6806. https://doi.org/10.1063/1.462569
Kállay M, Nagy PR, Rolik Z, Mester D, Samu G, Csontos J, Csóka J, Szabó BP, Gyevi-Nagy L, Ladjánszki I, Szegedy L, Ladóczki B, Petrov K, Farkas M, Mezei PD, Hégely B (2019) MRCC, a quantum chemical program suite. https://www.mrcc.hu
Acknowledgements
Open access funding provided by Budapest University of Technology and Economics (BME). The authors kindly thank Máté Fejér, Dániel Kalocsai, and János Molnár for their contributions to the epoxy preparation and measurements. Dávid Kun’s help with the exact calculation of molecular weight from the NMR spectra is deeply appreciated. The authors would like to thank András Simon and Erzsébet Kiss from the Department of Inorganic and Analytical Chemistry from the University of Technology and Economics for the NMR measurements. The authors are grateful for the financial support from the National Research, Development, and Innovation Office (NKFIH, Grant No. KKP126451). This work was also supported by the BME-Biotechnology FIKP grant of EMMI (BME FIKP-BIO) and the GINOP-2.3.3-15-2016-00021 project. The project was co-financed by the European Union and the European Regional Development Fund.
Author information
Authors and Affiliations
Corresponding author
Additional information
Publisher's Note
Springer Nature remains neutral with regard to jurisdictional claims in published maps and institutional affiliations.
Electronic supplementary material
Below is the link to the electronic supplementary material.
Rights and permissions
Open Access This article is distributed under the terms of the Creative Commons Attribution 4.0 International License (http://creativecommons.org/licenses/by/4.0/), which permits unrestricted use, distribution, and reproduction in any medium, provided you give appropriate credit to the original author(s) and the source, provide a link to the Creative Commons license, and indicate if changes were made.
About this article

Cite this article
Kárpáti, L., Ganyecz, Á., Nagy, T. et al. Synthesis and characterization of isophorondiamine-based oligoamides: catalytic effect of amides during the curing of epoxy resins. Polym. Bull. 77, 4655–4678 (2020). https://doi.org/10.1007/s00289-019-02987-6
Received:
Revised:
Accepted:
Published:
Issue Date:
DOI: https://doi.org/10.1007/s00289-019-02987-6