
Abstract
The COVID-19 pandemic has triggered an unprecedented shock to global stock markets, exceeding the economic impacts of prior pandemics. This paper examines the pandemic’s impact on global stock markets across 34 countries, focusing on the relationship between the pandemic’s severity, government policy responses, and economic stimuli. Panel data regressions reveal that increased daily COVID-19 cases initially negatively impacted stock returns and increased volatility. Stringent government measures positively influenced market returns but also heightened volatility. The research challenges previous assumptions about the influence of geographical and economic factors on market reactions. By segregating the sample period by investor sentiment, the study finds a consistent pattern of negative lagged returns, indicating stronger mean reversion during high VIX periods. During low market volatility, government stringency measures are perceived as harmful to economic activity, negatively impacting stock returns. The insights from the COVID-19 pandemic can inform responses to future market disruptions from health crises, geopolitical tensions, environmental disasters, or other systemic shocks.
1 Introduction
Declared a pandemic by the WHO on March 12, 2020 (Hartman 2020), COVID-19 has significantly influenced global stock markets, leading to sharp declines in stock prices and suddenly increase in volatility (see e.g. Baker et al. 2020; Al-Awadhi et al. 2020; Cinelli et al. 2020, etc.). This effect surpasses any previous infectious disease outbreak, marking COVID-19 as unique in its economic implications. On this day alone, the Dow Jones Industrial Index declined by 13.84%, the Standard and Poorś 500 (S &P 500) fell by 12.77%, and the FTSE MIB plunged by over 18%. In the US volatility levels were found to be even higher than those experienced during the 2007/08 Global Financial Crisis (Baker et al. 2020). Compared to earlier pandemics, the global response to COVID-19, including widespread lockdowns and intense media coverage, has created novel challenges for investors and policymakers. Therefore, as an aftermath, we find taking a further look at the impact of the COVID-19 on global stock behaviour can provide guidance on future pandemics or crisis.
Additionally, the pandemic has garnered unparalleled attention globally, both from governments and the public. Over a hundred countries and territories went into lockdown for at least a month; non-essential air traffic was suspended; and day-to-day travel was reduced to a fraction of that in previous years (Hale et al. 2020). In March 2020, the US imposed restrictions on air travel from Europe, China, and other high-risk areas; the EU implemented widespread travel restrictions, suspending non-essential travel from non-EU countries, which included a coordinated effort among member states to limit air traffic and reduce the risk of importing COVID-19 cases; India suspended all international and domestic commercial flights in March 2020 as part of a nationwide lockdown, which lasted until May 2020, when domestic flights were gradually resumed under strict health and safety guidelines; China significantly reduced international flights in early 2020, maintaining only essential air services to facilitate cargo and the repatriation of citizens. Domestic flights were also reduced, especially in and out of Wuhan, the epicenter of the outbreak. The scope, severity, and duration of government restrictions have been beyond those implemented during any previous infectious disease outbreak. At the same time, information is also spreading faster than ever and with the COVID-19 outbreak constantly making headlines across the media landscape, investors are facing substantial uncertainties (Cinelli et al. 2020).
This paper seeks to bridge a gap in existing literature by analyzing how the COVID-19 pandemic’s severity, government interventions, and their consequent effects shape stock market returns and volatility in various countries. This approach offers a broader perspective compared to previous studies, which have focused more narrowly on either the economic impact of the pandemic or governmental responses individually. This research contributes to a deeper understanding of how these factors interact and influence global equity markets, offering insights that could be valuable for policymakers, investors, and researchers in understanding the economic implications of large-scale health crises.
This research has the following contributions to the literature. Firstly, this paper extends beyond the initial stages of the pandemic, which most prior studies concentrate on. Secondly, it provides a comprehensive analysis throughout 2020, capturing the evolving nature of the pandemic’s impact. Thirdly, built on previous studies focusing on specific regions or markets, this paper investigates stock market responses across 34 countries, offering a more global view. Fourthly, we delve into how the severity of the pandemic and the strictness of government policies influenced market reactions, a dimension less explored in earlier studies. By examining the variations in market reactions based on the level of pandemic severity and policy strictness, this study provides nuanced insights that fill a notable gap in existing research. Finally, our inclusion of controls for seasonal effects and geographical locations to explain stock market changes adds a unique angle to the research. Our findings on the non-significant difference in market reactions between high-income and low-income economies offer a new perspective, as most studies have not explicitly focused on this comparison.
The volume of literature on the financial and economic impact of COVID-19 has also exploded as the number of confirmed cases rises. Research examining the relation between the COVID-19 pandemic and financial markets generally focuses on specific asset classes and geographical locations. The impact on equity markets has been one of the most researched topics (Al-Awadhi et al. 2020; Kowalewski and Śpiewanowski 2020; Just and Echaust 2020; Hartman 2020; Baker et al. 2020; Huo and Qiu 2020; Bai et al. 2020; Ashraf 2020; Sen et al. 2020; Chang et al. 2021; Liu et al. 2022), whilst the unexpected decline in oil prices has also prompted extensive research on commodity markets, including energy and precious metals (Mensi et al. 2020; Gil-Alana and Monge 2020; Narayan 2020; Nicole et al. 2020). The impact of COVID-19 on the debt market has also been investigated (De Sio et al. 2016; Ashton 2009; Aguiar-Conraria et al. 2012). Several studies have highlighted the significant increase in stock market volatility due to COVID-19. For instance, Scherf et al. (2022) using the Generalized Forecast Error Variance Decomposition (GFEVD) method demonstrated that the pandemic led to unprecedented volatility levels across global markets, particularly in higher-income countries which initially overreacted but recovered more quickly compared to lower-income countries. However, as the pandemic progressed, markets demonstrated learning effects, leading to more efficient responses to government interventions and policy measures (Scherf et al. 2022). Similarly, (Andrada-Félix et al. 2024) study noted that the COVID-19 crisis, compounded by the Ukraine war, resulted in more severe adverse effects on the US stock market than previous crises, such as the 2008 Global Financial Crisis. The efficiency of financial markets during the pandemic has been a subject of debate. Initial reactions to COVID-19 were marked by inefficiencies, with significant under- and overreactions. Tiwari et al. (2022) conduct causality analysis and show that there exist a causal relationship exists between the number of cases of COVID 19 infections and stock market liquidity.
Studies that demonstrate the increased volatility present in stock markets and their loss of value as the severity (often measured as confirmed cases and death tolls) of the pandemic increases in the short-term (Gormsen and Koijen 2020; Baker et al. 2020; Just and Echaust 2020; Ramelli and Wagner 2020; Liu et al. 2020; Huo and Qiu 2020; Bai et al. 2020). Similarly, Baker et al. (2020) review movements of the US stock market and find that restrictions on travel and business activities have significantly damaged the US economy. Adopting an alternative focus by analyzing government policies, Zhang et al. (2020) provide evidence that the impact of the pandemic on stock market movements has differed from market to market, but investors generally react positively to government actions that contain outbreaks. The psychological impact of the pandemic on investors has been substantial. Research has shown that negative sentiment and psychological pressure led to increased market volatility (Bai et al. 2023). Media coverage and financial news significantly influenced investor behavior, causing overreactions in stock markets (Ji et al. 2024).
Other than confirmed cases and death tolls from the pandemic, government interventions are also often considered as independent variables in analyses; for example, Rebucci et al. (2022) and Narayan et al. (2021) examine the impacts of governments’ restrictive policies, Zaremba et al. (2020) and Zhang et al. (2020) investigate the reactions of stock markets to control measures such as lockdowns, and school and workplace closures, Toda (2020) investigated the impact of weather. Notably, their results show that the strengthening of restrictions significantly increase stock market volatility. Ji et al. (2024) find that markets initially underreacted to lockdown announcements, followed by overreactions that were corrected over time. Their results indicate that the impact of COVID-19 on stock markets varied significantly across countries. Yu and Xiao (2023) reveal that government responses and societal trust levels played only partial roles in affecting market volatility, whereas Szczygielski et al. (2023) find the opposite.
This study contributes to the literature by offering a comprehensive analysis of stock market reactions across different phases of the pandemic, evaluating the impact of country-specific factors, and exploring the relationship between the severity of the pandemic, government policy strictness, and market responses. By comparing the effects of COVID-19 policies across markets and phases of the pandemic, this study highlight how national contexts, such as healthcare capacity and governmental trust, modulate the impact of these policies. We investigate feedback effects where rising case numbers lead to stricter controlling measures, which may in turn affect equity markets, can provide a more comprehensive picture of the pandemic’s impact.
Our analysis indicates that increases in daily confirmed cases led to decreased returns and increased volatility, as demonstrated by Al-Awadhi et al. (2020), Akhtaruzzaman et al. (2021), Andrada-Félix et al. (2024), Ji et al. (2024), especially in the first quarter of 2020. However, the reaction of stock markets varied depending on the severity of the pandemic and government responses. Notably, our findings challenge some of the early assumptions that the market responses to the pandemic strongly and long lasting Brodeur et al. (2021), Song et al. (2021), providing new insights into the interplay between public health crises and financial markets. We observe that stock market returns fall immediately following increase in daily new confirmed cases in the majority of countries but recover quickly in the second quarter of 2020. To address this issue, we introduce seasonal controls and examine the extent to which they explain the time-series variation of COVID-19 impact.
We then turn to the pandemic’s severity and government policies’ strictness in different countries to address the inconclusive results presented by previous research. Controls for severity and strictness groups are added to the baseline model. This way, we are the first to illustrate how stock markets in countries with different level of severity and strictness react to the changes in daily new confirmed cases and government policies. According to our observation, the equity market reacts more dramatically to increase in daily new confirmed cases in countries with higher severity level. Furthermore, increase in stringency leads to greater volatility especially for countries with low level of strictness.
Next, we evaluate whether markets reacted differently to the COVID-19 pandemic depending on their development status and dependence on domestic income. To test this, we run panel regressions with variables controlling for the income level of economies. We find no evidence of stock markets in high-income economies reacting differently than those in low-income economies.
Toda (2020) argues that the cold weather in the Northern Hemisphere may affect the spread of the virus and in return negatively affect the stock market. However, it should be noted that not only the Northern Hemisphere, the Southern Hemisphere was also affected by the pandemic during summer. Previous research was normally conducted at the early stage of the pandemic when patterns were not fully discovered. To address this issue, we include the whole 2020 as sample period and include controls for geographical locations. We discover that geographical locations cannot explain stock market changes, and the stock market recovered since the second quarter.
Previous research on the impact of the COVID-19 pandemic has concentrated mainly on the pandemic’s early stage and the impact caused by total cases or total death tolls (see e.g. Albulescu 2020; Baker et al. 2020; Baek et al. 2020, etc.). However, changes in equity market returns and volatility based on the level of severity of the pandemic and government policies’ strictness still remain under-researched. As governments enact life-saving policies, this study provides empirical evidence on global stock market reactions to both the COVID-19 pandemic and the ensuing policy responses.
2 Data and methodology
2.1 Data
COVID-19 data were sourced from the CSSE at Johns Hopkins University (Dong et al. 2020). To address potential time lags and inaccuracies in this data, we cross-referenced it with government-reported figures, ensuring alignment with stock market data timelines. Reported cases are sometimes subject to inaccuracy; hence, we modify the data in some cases according to government corrections. Claimant countries consider disputed territories differently, which also may cause mismatch between government-reported cases and those in the database.
To gain insights into government responses, we employed the Oxford COVID-19 Government Response Tracker (OxCGRT), focusing on stringency and economic support indices. This included examining the stringency and economic support indices, as well as specific containment measures. In particular, we focus on the stringency index, the economic support index, and procedures that aim to control COVID-19 outbreaks. This last category of policies includes school and workplace closures, prohibition of public events, restrictions on gatherings, public transport cancellations, stay-at-home orders, and national and international travel controls. The incorporation of daily COVID-19 case numbers and detailed government policy data provides a dynamic view of the pandemic’s progression and response measures. This approach allows for a more nuanced understanding of how these factors influence stock market volatility and returns. To investigate the trend shifting in investor sentiment, we collected the VIX index price in the same period and construct high and low VIX periods following (Smith et al. 2016).
Our study assesses the impact of the COVID-19 crisis by analyzing the returns and volatility of major stock market indices. Using data from 34 countries’ stock markets allows for a comprehensive and diverse analysis. This broad scope enables the capturing of a wide range of market reactions to the pandemic, providing a more global perspective. We gathered daily open, high, low, and close prices for stock indices from 34 countriesFootnote 1,Footnote 2 each representing their respective primary market portfolio. To ensure robustness, indices with high internal correlations (as shown in Table 3) were consolidated, resulting in a final sample of 34 indices. Our primary data sources were Yahoo Finance, supplemented and verified through Investing.com, forming the analytical foundation of our study. The statistical properties of these indices, detailed in Tables 1 and 2, indicate varying impacts of the pandemic based on countries’ economic dependencies and government measures. Our results indicate that the average daily return is not solely determined by the number of new daily cases or geographical location. Countries whose governments employ strict rules to control the spread of the virus tend to experience tend to experience decline in their economies.
2.2 Methodology
In this research, two sets of stock market indicators are computed. The first indicator, the log return, is selected for its efficacy in representing proportional changes in financial data and is calculated as
where \(price_{i,t}\) is the daily closing price for index i on day t.
As the second indicator, we utilize the Yang and Zhang (2000) volatility model to measure the return volatility. This model is particularly apt for our study as it accounts for intra-day price movements and opening jumps, critical during the pandemic’s market upheavals (Shu and Zhang 2006). The model is expressed as
where \(\sigma _o^2\) is the overnight volatility, \(\sigma _c^2\) is the open-to-close volatility, \(\sigma _{rs}^2\) is the Rogers-Satchell volatility, Z is the number of trading days in a year, n is the time window in days for calculating the volatility (30 days in this research), and O, H, L, C are the opening, high, low, and closing index values, respectively. Finally, k is the weighting assigned to the open-to-close volatility.
To incorporate both temporal and individual country effects, this study employs panel data analysis with the Hausman test indicating a preference for a fixed effects model. This method is appropriate for examining the relationships between the variables of interest and is robust and widely accepted in empirical economics. Thus, the data are assumed to follow a fixed effects model. Our baseline model is structured as follows:
where \(X_{i,t}\) is the endogenous variable. In this case, \(X_{i,t}\) represents stock market return \(Ret_{i,t}\) or the first difference of Yang and Zhang volatility represented as \({\sigma _{YZ_{i,t}}^2}\); and \(X_{i,t-1}\) is the one time period lag of endogenous variables. \(Cases_{i,t}\) represents the number of daily new confirmed cases for country i on day t. The number of cases is scaled down by taking log of 1 plus the number of cases that are normalized by population. \(Gov_{i,t}\) is the stringency index value for country i on day t, and \(Econ_{i,t}\) is the economic stimulus index for country i on day t. \(X_{i,t-1}\) is included in the model as returns and volatility are commonly recognized to be self-dependent (Lewellen 2002; Schwartz and Whitcomb 1977; McQueen et al. 1996). Control variables (\(Control_{k,i}\)) are also included to account for other influential factors, such as economic indicators and regional differences.
We include control variables (\(Control_{k,i}\)) to account for additional influential factors. These include dummy variables representing hemispherical location and continent, which are expected to capture geographical differences in pandemic impact and market reactions. Furthermore, income level, based on the IMF’s classification, is also used as a control, distinguishing high-income economies from others. For example, countries located in the Southern Hemisphere are given a value of 1 and those in the Northern Hemisphere are given a value of 0. Similarly, countries are marked using dummy variables to indicate their continent.
Quarter controls are included in to capture the effect of time. Since an economy’s degree of development has also been shown to influence stock market reactions (Topcu and Gulal 2020; Anh and Gan 2020), dummy variables related to income are added. Countries marked with a value of 1 if it is classified as a high-income economy by the IMF (2020).Footnote 3 The quarterly controls are not used in the analysis of investor sentiment periods since these subperiods have already covered the time effect.
Including controls for seasonal effects and geographical locations helps isolate the impact of the pandemic from other variables that might influence stock market behavior, such as weather patterns or regional economic conditions. By running panel regressions with variables controlling for the income level of economies, we address an often-overlooked aspect of how economic status might influence market reactions to global crises.
The severity of the pandemic is quantified as the percentage of total confirmed cases relative to the population, allowing for cross-country comparability. We also consider the initial strictness of government responses, hypothesizing that stock market reactions may vary based on these factors (Bora and Basistha 2021).
Adding controls for severity and strictness groups allows for a differentiated analysis of how markets in countries with varying levels of pandemic severity and government response strictness react to changes in the pandemic and policy measures. This approach adds depth to this analysis. By focusing on how global stock markets have reacted to both the pandemic’s progression and the corresponding government policies, this study provides empirical evidence that can inform policy decisions in future crises.
To explore these dynamics, our main model integrates interaction terms, such as the product of new confirmed cases and severity level (\(Cases_{i,t}\times SEV_{m,i}\)) and government policy stringency and its strictness level (\(Gov_{i,t}\times STRICT_{n,i}\)). These interactions aim to shed light on how varying degrees of pandemic severity and policy strictness influence stock market behavior. Our model, structured as follows, seeks to capture the multifaceted nature of these relationships:
In this model, we expect that the coefficients will reveal the direction and magnitude of the impact of each factor on stock market returns and volatility. We acknowledge the assumptions inherent in our model, including the linearity of relationships and potential limitations due to data constraints and unobserved heterogeneity.
In this study, we analyze three distinct time intervals within 2020: the entire year, and each of high and low VIX periods. This division allows for a nuanced examination of the evolving impact of the pandemic and corresponding policy responses under different investor sentiments. We repeat the same regression analysis for each period, using a grouping method based on the severity of the pandemic (SEV) and the strictness of government interventions (STRICT).
For each period, percentile values (25th, 50th, and 75th) of SEV and STRICT at the end of the period are calculated to define the groups. This percentile-based grouping enables a balanced comparison across countries. For instance, a country in the first group for SEV at the end of the first quarter indicates it’s among those with the least severity. A statistically significant coefficient for \(Cases_{i,t}\times SEV_{1,i}\) in this group would suggest that changes in daily new cases have a notable impact on stock markets in these least affected countries.
For example, countries with severity between 0 and the 25th percentile value by the end of the first quarter are classified into the first group of the first quarter. Countries will be marked with a value of 1 for \(SEV_{1}\), meaning that those countries have the least severity across all countries. A statistically significant estimated coefficient of parameter \(Cases_{i,t} * SEV_{1,i}\) means that, for countries with the least (less than the 25th percentile of the whole sample) percentage of population infected with the COVID-19, changes in daily new confirmed cases have significant impact on the endogenous variable. Similarly, countries with the lowest strictness across all countries will be marked with a value of 1 for \(STRICT_{1}\). A statistically significant estimated coefficient of parameter \(Gov_{i,t}*STRICT_{1,i}\) means that, for countries with the least strict (less than the 25th percentile of the whole sample) policies implemented, changes in government policies have significant impact on the endogenous variable. For more detailed information on the grouping criteria and the definitions of severity and strictness levels, readers are referred to Table 8.
We also employ a rolling window estimation technique to dynamically assess the impact of the COVID-19 pandemic on stock markets throughout the sample period. We estimate the regression parameters for a 30-day window of the data and then rolling this window forward in time, re-estimating the parameters at each step. This approach allows us to capture evolving market reactions to changes in pandemic-related indicators over time (Hamilton 1994).
3 Regression results
3.1 Summary statistics
The time series plot of Fig. 1, which includes equity market data from June 2019 to December 2019 to aid comparison, demonstrates how return and volatility have changed over the course of the COVID-19 pandemic. Volatility rose steeply during the early stage of the pandemic. The equity market then became less volatile after the first quarter of 2020, but the volatility level remained higher than the pre-pandemic level.
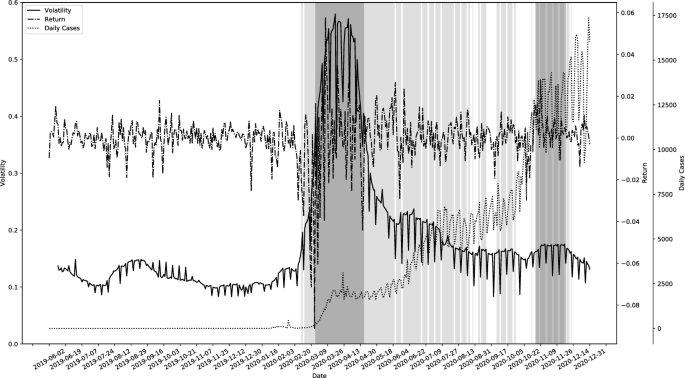
Time series plot of the cross-sectional average of return (dash-dotted line line), volatility (solid line), and daily new confirmed cases (dotted line). The line grey area represents the period when the cross-sectional average volatility is higher than 0.15%. The first dark grey area is the period from March 11, 2020, the day when the WHO declared the COVID-19 as a global pandemic, to the end of April; and the second dark grey area is the 1 month since the US presidential election date (from November 3, 2020, to December 3, 2020)
The data from June to December 2019 serves as a baseline, showing the state of the equity markets before the onset of the COVID-19 pandemic. The level of volatility and returns during this period can be considered ’normal’ or ’typical’ market conditions, against which the pandemic’s impact is measured. The steep rise in volatility at the beginning of the pandemic (early 2020) likely reflects the market’s immediate reaction to the uncertainty and economic disruption caused by COVID-19. This increase in volatility is a common response in financial markets to unforeseen, high-impact events, as investors reassess risks and potential impacts on company earnings and economic growth.
The observation that the equity market became less volatile after the first quarter of 2020 suggests a period of market adjustment. This could be attributed to investors gradually digesting the initial shock of the pandemic and adapting to the ’new normal’. This period may also coincide with various government and central bank interventions aimed at stabilizing the markets and the economy. The fact that volatility levels remained higher than the pre-pandemic level throughout 2020, despite a decrease after the first quarter, indicates ongoing market sensitivity and uncertainty. This could be due to continuing concerns about the trajectory of the pandemic, its long-term economic impacts, and the effectiveness of policy responses.
The trend may reflect underlying shifts in investor sentiment and behavior in response to the pandemic. For instance, the initial spike in volatility might indicate panic selling or a rush to liquidity, while the subsequent moderation could suggest a period of cautious optimism or market stabilization.
In our analysis of the statistical properties of equity markets during various periods of the COVID-19 pandemic, we observe a marked shift in market dynamics compared to the pre-pandemic period. Results are presented in Table 4. During low VIX period, the market exhibited a relatively stable pattern with average returns hovering close to zero and moderate volatility. However, with the onset of the pandemic, both returns and volatility underwent significant changes. The increased range and standard deviation pointed to more pronounced fluctuations, reflecting heightened market risk and investor uncertainty. The equity market have shown different landscape under different level of VIX, which reveals the necessity of investigating the impact of the pandemic and government responses to the pandemic in low and high VIX period separately.
3.2 Estimation results of the baseline model
Our analysis uncovers a significant interplay among pandemic developments, governmental responses, and global stock market dynamics during the COVID-19 pandemic. Our panel data regression results, detailed in Table 5, provide insights into how these elements collectively influenced market behavior in 2020.
In Panel A, focusing on daily returns, we observe that increases in daily confirmed COVID-19 cases correlate with reduced stock market returns. Conversely, government policies designed to control the outbreak, such as stringency measures and stimulus packages, are positively associated with market returns. This suggests that proactive governmental responses not only helped to mitigate the pandemic’s adverse effects but also instilled investor confidence, thereby buoying market returns. Interestingly, the time controls for quarters following Q1 indicate a swift recovery of global stock markets from the initial pandemic shock, underscoring the resilience of financial markets amidst unprecedented challenges.
Panel B shifts the focus to stock market volatility. Here, both confirmed case numbers and the strictness of government policies exhibit a positive correlation with market volatility. The stringency of government responses, in particular, stands out as a significant factor in explaining the rise in volatility, affirming the notion that while such measures are necessary for public health, they can also contribute to heightened market uncertainty. Notably, declining coefficients for quarter controls post-Q1 underscore a gradual stabilization of market volatility as the year progressed.
The quarterly controls (Q2, Q3, and Q4) demonstrate varying impacts on returns and volatility, aligning with the evolving nature of the pandemic and market reactions over time. The results suggest that the global stock market gradually adapted to the pandemic, with returns increasing and volatility decreasing over time, particularly after the initial shock in Q1. This finding is noteworthy for policymakers, as it suggests that governments can stabilize their stock markets by implementing consistently strict policies.
Our findings also challenge certain existing notions of Toda (2020). For instance, contrary to some previous studies, we find that country-specific characteristics like geographical location and income level do not significantly influence market returns or volatility. This counters the hypothesis that factors such as climate or development status might be determinants in the pandemic’s financial impact, as suggested by prior research.
In summary, our analysis delineates a complex landscape where increases in new COVID-19 cases are linked with decreases in stock market returns and increases in volatility, which agrees to previous research (see e.g. Baker et al. 2020; Zaremba et al. 2020; Zhang et al. 2020). Government interventions, while boosting returns, also contribute to greater market volatility as found by Zaremba et al. (2020). Economic supports show a positive effect on returns but their impact becomes less pronounced after accounting for country-specific variables. These insights underline the delicate balance policymakers must strike in navigating the pandemic’s economic repercussions, striving to bolster markets while managing inherent risks and uncertainties.
Table 6 illustrates that stock market reactions to various factors differ substantially between periods of low and high VIX. During high volatility periods, past returns have a more pronounced negative impact, and government stringency measures are perceived more positively. Regional effects also vary, with generally more negative impacts during stable periods for North America, South America, Asia, and EU.
The constant term in Table 6 reflects the baseline stock market return in the absence of the specified independent variables. Its positive value during low VIX periods suggests a generally stable and positive market environment, while its negative value during high VIX periods indicates a more volatile and negative market responds. The lagged return is negatively significant in both periods, but the magnitude of the coefficient is larger during high VIX periods (\(-\) 0.2138 vs. \(-\) 0.0552). This suggests that past returns have a stronger negative impact on current returns during periods of high market volatility. This variable is not significant in either period, indicating that daily new confirmed cases do not have a direct statistically significant impact on stock market returns when controlled for investor sentiment.
The stringency index has a negative and significant effect during low VIX periods but a positive and significant effect during high VIX periods. This implies that stricter government measures are perceived negatively during stable periods but positively during volatile periods, potentially due to the market’s view of stringent measures as stabilizing during high uncertainty. Similarly to that presented in Table 5, economic stimulates do not have a strong direct effect on stock returns.
3.3 Estimation results of the main model
We then analyze the relation between the severity of the COVID-19 pandemic and the strictness of government policies and stock market returns and volatility. The results from the main model, as presented in Table 7, offer a detailed examination of the impact of the COVID-19 pandemic’s severity and the strictness of government policies on stock market reactions, specifically in terms of daily returns and volatility. The model takes into account varying levels of pandemic severity and policy strictness across different time periods of 2020.
In Panel A, the consistently negative relationship of lagged daily returns (\(Ret_{t-1}\)) across all models indicates a tendency for negative returns to persist, indicates a tendency for negative returns to be followed by further negative returns, signifying a persistence in market trends. During the low sentiment period, the interaction terms between daily new confirmed cases and different severity levels (\(Cases_{t-1} \times SEV_{m,i}\)) are negative and statistically significant when the severity level is low but insignificant when the severity level is high. Countries with higher percentage of COVID-19-confirmed population tend to have lower reactions when daily new confirmed cases increase by one. This indicates that the stock market may stop taking the increase of confirmed cases as new information as the severity level goes up. However, in periods when VIX is high, the increase in confirmed cases can hardly have significant impact on stock returns. Interaction terms between the stringency index and strictness levels (\(Gov_{t} \times STRICT_{m,i}\)) are positive and significant during high VIX period but negative during low VIX period. This result suggests that stricter government policies are associated with higher return when investor sentiment is high.
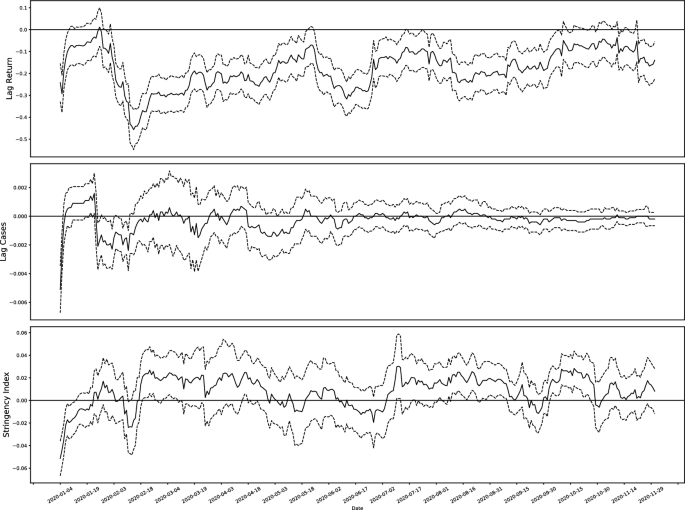
Plots of estimated coefficients for COVID-19 indicators estimated through a rolling window model with index return as the endogenous variable. The dashed lines are the lower and upper bounds of the 95% confidence interval
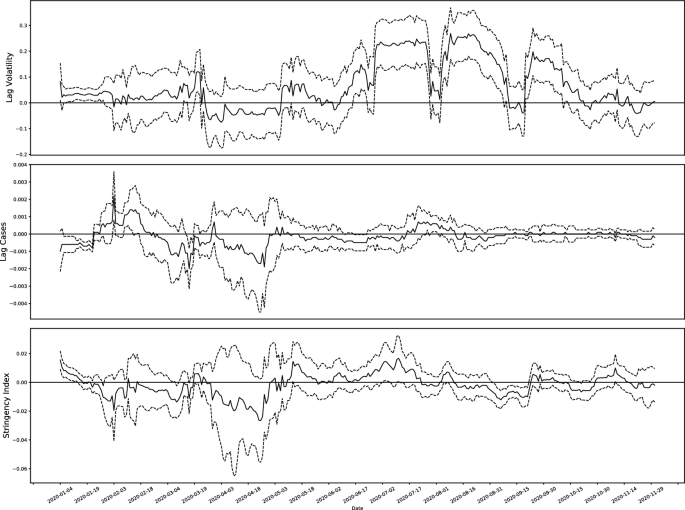
Plots of estimated coefficients for COVID-19 indicators estimated through a rolling window model with stock market volatility as the endogenous variable. The dashed lines are the lower and upper bounds of the 95% confidence interval
In Panel B, the positive coefficients for the lagged first difference of Yang and Zhang volatility (\({\sigma _{YZ_{t-1}}^2}\)) across all models indicate that higher volatility on one day tends to be followed by higher volatility the next day, showing a continuation of market uncertainty. Stock markets are found to be more volatile for countries with low severity level. Stock markets in those countries react more drastically to the increase in daily new confirmed cases than countries with higher severity level. The interaction terms between confirmed cases and severity levels show a positive and significant relationship with volatility over the whole 2020, suggesting that higher pandemic severity leads to increased market volatility. However, separating the year according to VIX level, we find that the increase of confirmed cases does not further lift volatility in the market. The government policy stringency and its interaction with strictness levels show mixed results. During low VIX period, stock market volatility increase as rules getting stricter, whereas the changes in rules can hardly affect market volatility during high VIX period.
3.4 Results of the rolling window estimation
Figures 2 and 3 show the estimated coefficients for daily new confirmed COVID-19 cases and the stringency of government policies, examining their relationship with stock market returns and volatility, respectively. The dashed lines representing the 95% confidence intervals in both figures underscore the statistical significance of these findings. The results show that changes in daily new confirmed cases gradually ceased to influence stock market returns and volatility. Furthermore, stock market returns and volatility tend to rise in case of strict restrictions.
In Fig. 2, the rolling estimates for the impact of new cases on market returns initially show significant variability, indicating a strong market reaction to the pandemic’s early developments. However, over time, these effects appear to diminish, suggesting that markets gradually adapted to the ongoing pandemic, reducing the influence of new case numbers on returns. This observation aligns with the notion that financial markets can absorb and adjust to persistent risks over time. In contrast, stringency index is found to load more on return. which indicates that returns tend to be higher when policies are strict. However, such relation is not statistically significant.
Figure 3 demonstrates a less significant impact of new cases on market volatility. Furthermore, the analysis reveals that stricter government restrictions tend to increase both market volatility. This dual effect of volatility and return can be attributed to the confidence instilled by decisive government action, which may boost returns, alongside the inherent uncertainty associated with such interventions, contributing to increased volatility.
The rolling window analysis highlights the dynamic nature of market responses to the COVID-19 pandemic. The gradual decrease in the influence of new cases on returns suggests market adaptation, while the impact on volatility shows the persistent uncertainty surrounding the pandemic. These findings offer insights into how global financial markets navigate periods of crisis and uncertainty, contributing to a deeper understanding of market behavior in the face of global health emergencies.
3.5 Robustness check
To affirm the reliability of our findings, we conducted robustness checks using two alternative methods for calculating stock market volatility: the historical close-to-close volatility and the Garman-Klass volatility model. These methods were chosen for their distinct approaches to volatility estimation, thereby providing a comprehensive validation of our results.
Historical close-to-close volatility: We recalculated the stock market volatility using the historical close-to-close method, defined by the formula:
where \(\sigma \) denotes volatility, Z the number of closing prices in a year, n the number of historical prices, \(C_i\) the closing price on day i, and \(r_i\) the log return on day i. This method focuses on the variation in closing prices, offering a straightforward measure of market fluctuations.
In this model, the estimated coefficient for lagged volatility (\(\sigma _{t-1}\)) is 0.2635, significant at the 1% level. Daily new confirmed cases (\(Cases_{t-1}\)) have a coefficient of 0.0002, and government stringency (\(Gov_t\)) is significant at the 10% level with a coefficient of 0.0019. Economic support index (\(Econ_{t}\)) shows a coefficient of 0.0006. These results align with our initial findings using Yang and Zhang volatility, confirming the robustness of our analysis.
Garman-Klass volatility: We further validate our results using the Garman-Klass volatility model, which is calculated as:
where \(\sigma _{GK}\) is the Garman-Klass volatility, Z is the number of closing prices in a year, n is the number of historical prices used for the volatility estimate. This model incorporates both the range of high to low prices and the closing-to-opening prices, providing a comprehensive view of intra-day price movements.
Using the Garman-Klass model, we find the coefficient for \(\sigma _{GK_{t-1}}\) to be 0.3242, significant at the 1% level. The coefficients for \(Cases_{t-1}\) and \(Gov_t\) are 0.0001 and 0.0021, respectively, both significant at the 1% level. The coefficient for \(Econ_{t}\) is 0.0009, though not statistically significant. This robustness check with the Garman-Klass volatility further corroborates our initial results, underscoring the consistency of our findings across different volatility measurement techniques.
4 Conclusion
This paper investigates the stock market’s response to the COVID-19 pandemic, revealing multifaceted impacts influenced by the pandemic’s severity, governmental policy responses, and economic stimuli. Our findings indicate that, initially, increases in daily new confirmed COVID-19 cases negatively impacted stock market returns and led to increased market volatility. Furthermore, our analysis reveals that stricter government policies, while beneficial for market returns, are associated with higher market volatility. Economic stimulus measures, aimed at fostering economic growth, are associated with elevated returns, though they introduce additional volatility, albeit not significantly.
Our investigation of investor sentiment periods show that new COVID-19 cases do not have a direct impact on stock market returns during low or high VIX periods. However, higher government stringency measures are associated with lower stock returns during low VIX periods but higher stock returns during high VIX periods. Regional controls show significant effects primarily during low VIX periods, while economic support measures show limited influence in both periods.
Interestingly, our analysis suggests a quickly reduced sensitivity of the stock market to pandemic developments after the first quarter of 2020. This could imply that investors have acclimatized to the ongoing pandemic, perceiving further increases in confirmed cases as less informative for investment decisions. This adaptation reflects a new normal in investor behavior, where pandemic-related statistics are no longer novel or actionable information.
This study pioneers in exploring the intricate relationship between the pandemic’s severity, policy rigor, and their impacts on stock markets. The observed trends indicate that countries grappling with higher pandemic severity experience reduced market returns and elevated volatility. These findings underscore the critical role of effective governmental interventions in managing the pandemic’s spread and its economic fallout. Particularly noteworthy is the significant impact of non-pharmaceutical interventions on market returns and volatility.
While our study yields significant insights, we recognize certain limitations that must be acknowledged. The rapidly evolving nature of the pandemic and the varying degrees of data accuracy across countries present challenges in fully capturing the global stock market’s response. Additionally, our analysis primarily focuses on the pandemic’s direct impact, leaving room for exploring indirect effects such as changes in consumer behavior, supply chain disruptions, and long-term economic shifts.
Future research could build upon our findings by examining the long-term impacts of the pandemic on different sectors within the stock market. Additionally, studies could explore the role of vaccines, and global supply chain adjustments in shaping market responses to future global crises. A deeper understanding of these aspects would enrich our comprehension of the pandemic’s enduring impact on financial markets and guide strategic decision-making for investors and policymakers.
Notes
Countries included in this study are listed below with country code in parentheses: Australia (AUS), Austria (AUT), Belgium (BEL), Brazil (BRA), Canada (CAN), China (CHN), Denmark (DNK), Egypt (EGY), France (FRA), Germany (DEU), Hong Kong (HKG), India (IND), Indonesia (IDN), Israel (ISR), Italy (ITA), Japan(JPN), Korea (KOR), Mexico (MEX), Netherlands (NLD), New Zealand (NZL), Philippine (PHL), Portugal (PRT), Russia (RUS), Saudi Arabia (SAU), Singapore (SGP), South Africa (ZAF), Spain (ESP), Sweden (SWE), Switzerland (CHE), Taiwan (TWN), Thailand (THA), United Kingdom (GBR), United States (USA), and Vietnam (VNM)
This paper recognizes regions with independently developed stock exchanges as separate markets. Taiwan and Hong Kong, for example, are considered as separate markets from mainland China.
According to the IMF, high income economies in our sample are: Australia, Austria, Belgium, Denmark, France, Germany, Greece, Hong Kong SAR, Israel, Italy, Japan, Korea, Netherlands, New Zealand, Portugal, Singapore, Spain, Sweden, Switzerland, Taiwan Province of China, United Kingdom, and United States.
References
Aguiar-Conraria L, Martins MM, Soares MJ (2012) The yield curve and the macro-economy across time and frequencies. J Econ Dyn Control 36(12):1950–1970
Akhtaruzzaman M, Boubaker S, Sensoy A (2021) Financial contagion during COVID-19 crisis. Financ Res Lett 38:101604
Al-Awadhi AM, Alsaifi K, Al-Awadhi A et al (2020) Death and contagious infectious diseases: impact of the COVID-19 virus on stock market returns. J Behav Exp Financ 27:100326
Albulescu C (2020) Coronavirus and financial volatility: 40 days of fasting and fear. arXiv preprint arXiv:2003.04005
Andrada-Félix J, Fernández-Rodríguez F, Sosvilla-Rivero S (2024) A crisis like no other? Financial market analogies of the COVID-19-cum-Ukraine war crisis. North Am J Econ Finance. https://doi.org/10.1016/j.najef.2024.102194
Anh DLT, Gan C (2020) The impact of the COVID-19 lockdown on stock market performance: evidence from vietnam. J Econ Stud
Ashraf BN (2020) Stock markets’ reaction to COVID-19: cases or fatalities? Res Int Bus Financ 54:101249
Ashton P (2009) An appetite for yield: the anatomy of the subprime mortgage crisis. Environ Plan A 41(6):1420–1441
Baek S, Mohanty SK, Glambosky M (2020) COVID-19 and stock market volatility: an industry level analysis. Financ Res Lett 37:101748
Bai C, Duan Y, Fan X et al (2023) Financial market sentiment and stock return during the COVID-19 pandemic. Financ Res Lett 54:103709. https://doi.org/10.1016/j.frl.2023.103709
Bai L, Wei Y, Wei G, et al (2020) Infectious disease pandemic and permanent volatility of international stock markets: a long-term perspective. Finance Res Lett 101709
Baker SR, Bloom N, Davis SJ et al (2020) The unprecedented stock market reaction to COVID-19. Rev Asset Pricing Stud 10(4):742–758
Bora D, Basistha D (2021) The outbreak of covid-19 pandemic and its impact on stock market volatility: evidence from a worst-affected economy. J Public Aff 21(4):e2623. https://doi.org/10.1002/pa.2623
Brodeur A, Clark AE, Fleche S et al (2021) Covid-19, lockdowns and well-being: evidence from google trends. J Public Econ 193:104346
Chang CP, Feng GF, Zheng M (2021) Government fighting pandemic, stock market return, and COVID-19 virus outbreak. Emerg Mark Financ Trade 57(8):2389–2406
Cinelli M, Quattrociocchi W, Galeazzi A et al (2020) The COVID-19 social media infodemic. Sci Rep 10(1):1–10
De Sio L, Franklin MN, Weber T (2016) The risks and opportunities of Europe: how issue yield explains (non-) reactions to the financial crisis. Elect Stud 44:483–491
Dong E, Du H, Gardner L (2020) An interactive web-based dashboard to track COVID-19 in real time. Lancet Infect Dis 20(5):533–534
Gil-Alana LA, Monge M (2020) Crude oil prices and COVID-19: persistence of the shock. Energy Res Lett 1(1):13200
Gormsen N, Koijen R (2020) Coronavirus: impact on stock prices and growth expectations. university of Chicago. Becker Friedman Institute for Economics Working Paper 22
Hale T, Webster S, Petherick A, et al (2020) Oxford COVID-19 government response tracker. Blavatnik School of Government
Hamilton JD (1994) Time series analysis. Princeton University Press, Princeton
Hartman M (2020) Mad march: how the stock market is being hit by COVID-19. In: World economic forum, March
Huo X, Qiu Z (2020) How does china’s stock market react to the announcement of the COVID-19 pandemic lockdown? Econ Polit Stud 8(4):436–461
IMF (2020) World economic outlook database. https://www.imf.org/en/Publications/WEO/weo-database/2020/October/select-aggr-data
Ji X, Bu NT, Zheng C et al (2024) Stock market reaction to the COVID-19 pandemic: an event study. Port Econ J 23(1):167–186. https://doi.org/10.1007/s10258-022-00227-w
Just M, Echaust K (2020) Stock market returns, volatility, correlation and liquidity during the COVID-19 crisis: evidence from the Markov switching approach. Finance Res Lett. https://doi.org/10.1016/j.frl.2020.101775
Kowalewski O, Śpiewanowski P (2020) Stock market response to potash mine disasters. J Commod Mark. https://doi.org/10.1016/j.jcomm.2020.100124
Lewellen J (2002) Momentum and autocorrelation in stock returns. Rev Financ Stud 15(2):533–564
Liu F, Kong D, Xiao Z et al (2022) Effect of economic policies on the stock and bond market under the impact of COVID-19. J Saf Sci Resil 3(1):24–38
Liu M, Choo WC, Lee CC (2020) The response of the stock market to the announcement of global pandemic. Emerg Mark Financ Trade 56(15):3562–3577
McQueen G, Pinegar M, Thorley S (1996) Delayed reaction to good news and the cross-autocorrelation of portfolio returns. J Financ 51(3):889–919
Mensi W, Sensoy A, Vo XV et al (2020) Impact of COVID-19 outbreak on asymmetric multifractality of gold and oil prices. Resour Policy 69:101829
Narayan PK (2020) Oil price news and COVID-19-is there any connection? Energy Res Lett 1(1):13176
Narayan PK, Phan DHB, Liu G (2021) COVID-19 lockdowns, stimulus packages, travel bans, and stock returns. Financ Res Lett 38:101732
Nicole M, Alsafi Z, Sohrabi C et al (2020) The socio-economic implications of the coronavirus and COVID-19 pandemic: a review. Int J Surg 78:185–193
Ramelli S, Wagner AF (2020) Feverish stock price reactions to COVID-19. Rev Corp Finance Stud 9(3):622–655
Rebucci A, Hartley JS, Jiménez D (2022) An event study of COVID-19 central bank quantitative easing in advanced and emerging economies. In: Essays in honor of M. Hashem Pesaran: prediction and macro modeling, vol 43. Emerald Publishing Limited, pp 291–322
Scherf M, Matschke X, Rieger MO (2022) Stock market reactions to COVID-19 lockdown: a global analysis. Financ Res Lett 45:102245. https://doi.org/10.1016/j.frl.2021.102245
Schwartz RA, Whitcomb DK (1977) The time-variance relationship: evidence on autocorrelation in common stock returns. J Financ 32(1):41–55
Sen S, Antara N, Sen S, Chowdhury S et al (2020) The unprecedented pandemic “COVID-19’’ effect on the apparel workers by shivering the apparel supply chain. J Text Appar Technol Manag 11(3):1–20
Shu J, Zhang JE (2006) Testing range estimators of historical volatility. J Future Mark Future Option Other Deriv Prod 26(3):297–313
Smith DM, Wang N, Wang Y et al (2016) Sentiment and the effectiveness of technical analysis: evidence from the hedge fund industry. J Financ Quant Anal 51(6):1991–2013
Song HJ, Yeon J, Lee S (2021) Impact of the COVID-19 pandemic: evidence from the us restaurant industry. Int J Hosp Manag 92:102702
Szczygielski JJ, Charteris A, Bwanya PR et al (2023) Which COVID-19 information really impacts stock markets? J Int Financ Mark Inst Money 84:101592. https://doi.org/10.1016/j.intfin.2022.101592
Tiwari AK, Abakah EJA, Karikari NK et al (2022) The outbreak of COVID-19 and stock market liquidity: evidence from emerging and developed equity markets. North Am J Econ Finance 62:101735. https://doi.org/10.1016/j.najef.2022.101735
Toda AA (2020) Susceptible-infected-recovered (sir) dynamics of COVID-19 and economic impact. arXiv preprint arXiv:2003.11221
Topcu M, Gulal OS (2020) The impact of COVID-19 on emerging stock markets. Financ Res Lett 36:101691
Yang D, Zhang Q (2000) Drift-independent volatility estimation based on high, low, open, and close prices. J Bus 73(3):477–492
Yu X, Xiao K (2023) COVID-19 Government restriction policy, COVID-19 vaccination and stock markets: evidence from a global perspective. Financ Res Lett 53:103669. https://doi.org/10.1016/j.frl.2023.103669
Zaremba A, Kizys R, Aharon DY et al (2020) Infected markets: novel coronavirus, government interventions, and stock return volatility around the globe. Financ Res Lett 35:101597
Zhang D, Hu M, Ji Q (2020) Financial markets under the global pandemic of COVID-19. Financ Res Lett 36:101528. https://doi.org/10.1016/j.frl.2020.101528
Author information
Authors and Affiliations
Corresponding author
Additional information
Publisher's Note
Springer Nature remains neutral with regard to jurisdictional claims in published maps and institutional affiliations.
Appendix A: Countries included in strictness and severity groups
Appendix A: Countries included in strictness and severity groups
Table 8 presents countries in each strictness and severity group. Groups of 2020 are determined based on the year end severity and annual average of strictness.
Rights and permissions
Open Access This article is licensed under a Creative Commons Attribution 4.0 International License, which permits use, sharing, adaptation, distribution and reproduction in any medium or format, as long as you give appropriate credit to the original author(s) and the source, provide a link to the Creative Commons licence, and indicate if changes were made. The images or other third party material in this article are included in the article’s Creative Commons licence, unless indicated otherwise in a credit line to the material. If material is not included in the article’s Creative Commons licence and your intended use is not permitted by statutory regulation or exceeds the permitted use, you will need to obtain permission directly from the copyright holder. To view a copy of this licence, visit http://creativecommons.org/licenses/by/4.0/.
About this article

Cite this article
Yang, S. Pandemic, policy, and markets: insights and learning from COVID-19’s impact on global stock behavior. Empir Econ (2024). https://doi.org/10.1007/s00181-024-02648-2
Received:
Accepted:
Published:
DOI: https://doi.org/10.1007/s00181-024-02648-2