
Abstract
The two opposing investment strategies, diversification and concentration, have often been directly compared. While there is much less dispute regarding Markowitz’s approach as the benchmark for diversification, the precise meaning of concentration in portfolio selection remains unclear. This paper offers a novel definition of concentration, along with an extreme value theory-based estimator for its implementation. When overlaying the performances derived from diversification (in Markowitz’s sense) and concentration (in our definition), we find an implied risk threshold, at which the two polar investment strategies reconcile—diversification has a higher expected return in situations where risk is below the threshold, while concentration becomes the preferred strategy when the risk exceeds the threshold. Different from the conventional concave shape, the estimated frontier resembles the shape of a seagull, which is piecewise concave. Further, taking the equity premium puzzle as an example, we demonstrate how the family of frontiers nested inbetween the estimated curves can provide new perspectives for research involving market portfolios.


Notes
A concise way of saying the estimated efficient frontier implied by Markowitz’s mean-variance optimization method.
The Brazil stock pool includes all stocks currently listed at the B3 Stock Exchange. The China stock pool includes all stocks currently listed at the Shanghai and the Shenzhen Stock Exchanges. The India stock pool includes all stocks currently listed at the Bombay Stock Exchange and the National Stock Exchange of India. The Japanese stock pool includes all stocks currently listed at the Tokyo Stock Exchange. The US stock pool includes all stocks currently listed at the New York Stock Exchange and the NASDAQ Stock Market. The UK stock pool includes all stocks currently listed at the London Stock Exchange.
The method to estimate the concentrated market frontier is nonparametric, which is generally known for boundary bias. This is the reason we follow the common practice in nonparametric estimation by trimming the observations close to the boundaries. To ensure comparability, both frontiers are estimated based on the same trimmed data set.
References
Andersen TG, Bollerslev T (1998) Answering the skeptics: Yes, standard volatility models do provide accurate forecasts. Int Econ Rev 885–905
Bali TG, Peng L (2006) Is there a risk-return trade-off? Evidence from high-frequency data, Journal of Applied Econometrics 21:1169–1198
Bird R, Pellizzari P, Yeung D, Woolley P, et al (2012) The strategic implementation of an investment process in a funds management firm. Technical report
Blume ME, Friend I (1975) The asset structure of individual portfolios and some implications for utility functions. The Journal of Finance 30:585–603
Brands S, Brown SJ, Gallagher DR (2005) Portfolio concentration and investment manager performance. International Review of Finance 5:149–174
Buffett W (1994) Letter to shareholders, Berkshire Hathaway Annual Report
Buser SA (1977) Mean-variance portfolio selection with either a singular or nonsingular variance-covariance matrix. Journal of Financial and Quantitative Analysis 12:347–361
Campbell JY (2018) Financial Decisions and Market - A Course in Asset Pricing. Princeton
Campbell R, Huisman R, Koedijk K (2001) Optimal portfolio selection in a Value-at-Risk framework. Journal of Banking & Finance 25:1789–1804
Caselli F, Ventura J (2000) A representative consumer theory of distribution. The American Economic Review 90:909–926
Chen T, Yang F (2020) Think outside the envelop—efficiency bound estimation through extreme value theory, Working Paper
Choi N, Fedenia M, Skiba H, Sokolyk T (2017) Portfolio concentration and performance of institutional investors worldwide. Journal of Financial Economics 123:189–208
Daniels MJ, Kass RE (1999) Nonconjugate Bayesian estimation of covariance matrices and its use in hierarchical models. Journal of the American Statistical Association 94:1254–1263
Dekkers AL, Einmahl JH, De Haan L et al (1989) A moment estimator for the index of an extreme-value distribution. The Annals of Statistics 17:1833–1855
Dietrich, D., L. Haan, and J. Hüsler (2002): Testing extreme value conditions, Extremes, 5, 71–85.
Ekholm A, Maury B (2014) Portfolio concentration and firm performance. Journal of Financial and Quantitative Analysis 49:903–931
Evans JL, Archer SH (1968) Diversification and the reduction of dispersion: An empirical analysis. J Finance 23:761–767
Fang C-R, You S-Y (2014) “The impact of oil price shocks on the large emerging countries’ stock prices: Evidence from China. India and Russia”, International Review of Economics 29:330–338.
Feibel BJ (2003) Investment performance measurement, Vol 116, Wiley
Fisher L, Lorie JH (1970) Some studies of variability of returns on investments in common stocks. The Journal of Business 43:99–134
Floros C (2005) Price linkages between the US, Japan and UK stock markets. Financial Markets and Portfolio Management 19:169–178
Gay Jr RD et al (2008) Effect of macroeconomic variables on stock market returns for four emerging economies: Brazil, Russia, India, and China. Int Business Econ Res J (IBER), 7
Ghysels E, Santa-Clara P, Valkanov R (2005) There is a risk-return trade-off after all. Journal of Financial Economics 76:509–548
Goetzmann WN, Kumar A (2008) Equity portfolio diversification. Review of Finance 12:433–463
Goetzmann WN, Li L, Rouwenhorst KG et al (2005) Long-term global market correlations. The Journal of Business 78:1–38
Goldman E, Sun Z, Zhou X (2016) The effect of management design on the portfolio concentration and performance of mutual funds. Financial Analysts Journal 72:49–61
Hamao Y, Masulis RW, Ng V (1990) Correlations in price changes and volatility across international stock markets. The Review of Financial Studies 3:281–307
Ivković Z, Sialm C, Weisbenner S (2008) Portfolio concentration and the performance of individual investors. Journal of Financial and Quantitative Analysis 43:613–655
Jenkinson AF (1955) The frequency distribution of the annual maximum (or minimum) values of meteorological elements. Quarterly Journal of the Royal Meteorological Society 81:158–171
Jorion P (2010) Financial risk manager handbook. Wiley
Kacperczyk M, Sialm C, Zheng L (2005) On the industry concentration of actively managed equity mutual funds. The Journal of Finance 60:1983–2011
Kent, J. T. (1983): Information gain and a general measure of correlation, Biometrika, 70, 163–173.
Keynes JM, Moggridge DE, Johnson ES et al (1983) The collected writings of John Maynard Keynes, vol. XII, Macmillan, London
Ledoit O, Wolf M (2003) Improved estimation of the covariance matrix of stock returns with an application to portfolio selection. Journal of Empirical Finance 10:603–621
Ledoit O, Wolf M (2004) Honey, I shrunk the sample covariance matrix, The. J Portfolio Manag 30:110–119
Ledoit O, Wolf M (2012) Nonlinear shrinkage estimation of large-dimensional covariance matrices. The Annals of Statistics 40:1024–1060
Ledoit O, Wolf M (2017) Nonlinear shrinkage of the covariance matrix for portfolio selection: Markowitz meets Goldilocks. The Review of Financial Studies 30:4349–4388
Leonard T, Hsu JS et al (1992) Bayesian inference for a covariance matrix. The Annals of Statistics 20:1669–1696
Liu EX (2016) Portfolio diversification and international corporate bonds. Journal of Financial and Quantitative Analysis 51:959–983
Liu K (2017) Effective dimensionality control in quantitative finance and insurance, PhD thesis, University of Waterloo
Loeb GM (2007) Battle for investment survival, Vol 36, Wiley
Longin F (2016) Extreme events in finance: a handbook of extreme value theory and its applications. Wiley
Longin FM (2000) From Value-at-Risk to stress testing: The extreme value approach. Journal of Banking & Finance 24:1097–1130
Madaleno M, Pinho C (2012) International stock market indices comovements: A new look. International Journal of Finance & Economics 17:89–102
Markowitz H (1952) Portfolio selection, The. Journal of Finance 7:77–91
McNeil AJ, Frey R (2000) Estimation of tail-related risk measures for heteroscedastic financial time series: An extreme value approach. Journal of Empirical Finance 7:271–300
Mehra R (2008) Handbook of the equity risk premium. Elsevier
Mehra R, Prescott EC (1985) The equity premium: A puzzle. Journal of Monetary Economics 15:145–161
Merton R (1972) An analytic derivation of the efficient portfolio frontier. Journal of Financial and Quantitative Analysis 7:1851–1872
Mises RV (1954) La distribution de la plus grande de n valeurs. American Mathematical Society, Providence. RI. II:271–294
Modigliani F, Leah M (1997) Risk-adjusted performance. Journal of Portfolio Management 23:45–54
Oyenubi A (2019) Diversification measures and the optimal number of stocks in a portfolio: An information theoretic explanation. Computational Economics 54:1443–1471
Pappas D, Kiriakopoulos K, Kaimakamis G (2010) Optimal portfolio selection with singular covariance matrix. International Mathematical Forum 5:2305–2318
Pownall RA, Koedijk KG (1999) Capturing downside risk in financial markets: The case of the Asian Crisis. J Int Money Finance 18:853–870
Rocco M (2014) Extreme value theory in finance: A survey. Journal of Economic Surveys 28:82–108
Saranya K, Prasanna PK (2014) Portfolio selection and optimization with higher moments: evidence from the Indian stock market. Asia Pac FinanMarkets 21:133–149
Sharkasi A, Crane M, Ruskin HJ, Matos JA (2006) The reaction of stock markets to crashes and events: A comparison study between emerging and mature markets using wavelet transforms. Physica A: Statistical Mechanics and its Applications 368:511–521
Statman M (1987) How many stocks make a diversified portfolio? Journal of Financial and Quantitative Analysis 22:353–363
Yang R, Berger JO (1994) Estimation of a covariance matrix using the reference prior. Ann Statist 1195–1211
Yeung D, Pellizzari P, Bird R, Abidin S, et al (2012) Diversification versus concentration... and the Winner is? Technical report
Acknowledgements
The corresponding author would like to thank Francisco Gonzalez and Tony Wirjanto for multiple insightful discussions of this topic.
Author information
Authors and Affiliations
Contributions
Not applicable
Corresponding author
Ethics declarations
Funding
The authors did not receive support from any organization for the submitted work.
Conflict of interest
The authors have no relevant financial or nonfinancial interests to disclose.
Ethics approval
Not applicable.
Consent to participate
Not applicable.
Consent for publication
Not applicable.
Availability of data and materials
The data that support the findings of this study are available from the corresponding author upon request.
Code availability
The code that support the findings of this study are available from the corresponding author upon reasonable request.
Additional information
Publisher's Note
Springer Nature remains neutral with regard to jurisdictional claims in published maps and institutional affiliations.
Appendix A: Derivations of the statistical methods
Appendix A: Derivations of the statistical methods
1.1 A.1: The mean-variance optimization
This section provides the general setup of Markowitz’s mean-variance optimization. Let \(\varvec{E}\) be the vector of expected asset returns in the stock pool, \(\varvec{\mathrm {V}}\) be the covariance matrix of the returns, and \(\varvec{w}\) be the vector of weights indicating the fraction of portfolio wealth held in each asset. Assuming that short sales are permitted, the constrained minimization problem is as follows:
where \(\mu \) denotes the target expected return of the portfolio, and \(\varvec{1}\) denotes a vector of ones. The analytical solution to this problem is derived following Merton (1972), which we will not expand on here.
1.2 A.2: The DR method
We elaborate on the DR method first introduced by Liu (2017), which effectively reduces the number of stocks, while still preserves the variance in the market. Suppose that there are N assets with asset prices \(S^{(1)},S^{(2)},...,S^{(N)}\) in the market. Based on the multivariate Black-Scholes model, the asset price processes \(\left\{ S_t^{(h)}\right\} \) for \(h = 1,2,...,N\) solves the stochastic differential equation
where \(B_t^{(1)},B_t^{(2)},...,B_t^{(N)}\) follow the independent standard Brownian motions, \(r_t\) is the short rate of interest, and \([\sigma _{hl}]\) is the matrix capturing the correlation among the assets. Then, the solution to Equation (1) is
Let \(t_0=0\), \(t_1 = \Delta ,...,t_m=m\Delta \) be the time steps with equal space \(\Delta \), and suppose that the continuous forward rate is constant within each period. We denote \(f_j\) as the annualized continuous forward rate for period \(\left( t_{j-1},t_j\right) \) such that
Then, we have
For \(j=1,2,...,m\), let \(A_j^{(h)}\) be the accumulation factor of the \(h^{th}\) index for the period \((t_{j-1},t_j)\), that is,
Combining Equation (2) to (4), we get
where
By the property of Brownian motion, we know that \(Z_1^{(l)},Z_2^{(l)},...,Z_m^{(l)}\) are independent random variables with a standard normal distribution. From Equation (5), we derive the continuous return for the period \((t_{j-1},t_j)\)
The mean and covariance matrix of the returns are given by
and
Let \(\Sigma \) be the covariance matrix of the annualized continuous returns of the N stocks and
be the Cholesky decomposition of \(\Sigma \) such that
where \({\mathbf {A}}^\intercal \) is the transpose of \({\mathbf {A}}\). Then, the variance contribution, also known as the explained variance (e.g., Kent 1983), of the first \(N_{DR}\) assets with the highest Sharpe ratios can be defined as
where \(A_i\) is the \(i^{th}\) column of \({\mathbf {A}}\). In this paper, the reduced dimensionality \(N_{DR}\) is the minimum number of assets needed to reach the \(95\%\) explained variance, and the dimensionality reduction is achieved when \(N_{DR}<<N\).
1.3 A.3: The EVT method
In this section, we discuss the EVT method in further details. We take one stock market, say the China market, as an example and exclude all non-positive returns since our concern is the right-tail return. Let \(X_{1},X_{2},...,X_{n}\) denote the observations of returns in one group, say G1. We consider these n returns as i.i.d. observations from some distribution function F. Let \(X_{1,n} \le X_{2,n} \le ... \le X_{n,n}\) be the associated order returns, so that \(X_{n,n}\) denotes the maximum return in G1. Then, according to Mises (1954) and Jenkinson (1955), if the maximum \(X_{n,n}\), suitably centered and scaled, converges to a non-degenerate random variable, then there exist sequences \(\{a_n\}\) \((a_n > 0)\) and \({b_n}\) \((b_n \in {\mathbb {R}})\) such that
where
for some \(\gamma \in {\mathbb {R}}\), with x such that \(1+\gamma x > 0\). That is, F is in the domain of attraction of some extreme value distribution function \(G_\gamma \) and \(\gamma \) is the extreme-value index. By taking logarithms, Equation (6) can be written as
where \(q \in {\mathbb {R}}^+\) and \(a_q\) and \(b_q\) are defined by interpolation. We take \(b_q = U(q)\) with
where \(-1\) denotes the left-continuous inverse.
We then estimate \(\gamma \), \(a_q\) and \(b_q\) as follows. Let, for \(1 \le k < n\),
We use the moment estimators for \(\gamma \in {\mathbb {R}}\) introduced by Dekkers et al. (1989):
Specifically, we first test that \(\gamma \) exists for all groups according to Dietrich et al. (2002). Next, we plot \(\hat{\gamma }\) as a function of k, which is the number of upper order statistics used for estimation minus 1. Then, we determine the first stable region in k of the estimate from the moment estimator plot. Namely, we try to identify a set of consecutive values of k where the estimated values do not fluctuate much, so that the procedure is insensitive to the choice of k in such a region. For the moment estimator in G1 for the China market, as illustrated in Fig. 9, such a stable region runs from around \(k = 30\) to \(k = 200\).
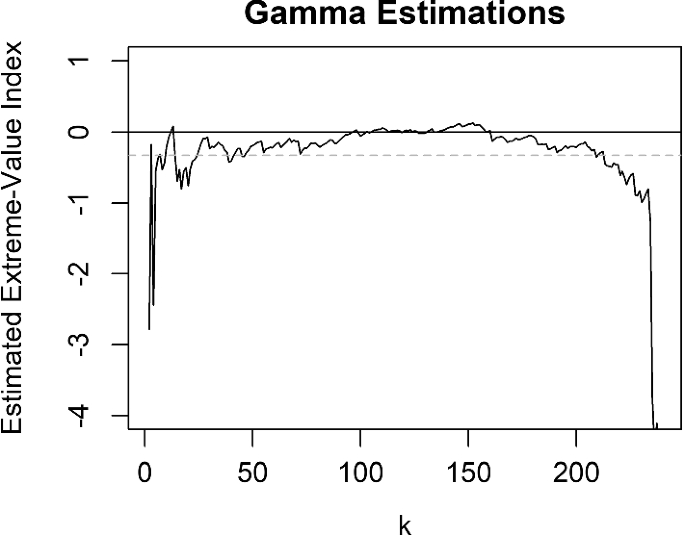
Moment estimator versus k for G1 of the China Market
Next, we define the following estimators for \(a_n/k\) and \(b_n/k\):
and
Then, our goal is to estimate the right endpoint
of the distribution function F, that is, the ultimate return of G1 based on the observed returns. When estimating the endpoint, we assume that \(\gamma < 0\). Next, it can be shown that Equation (6) is equivalent to
As t gets large, we can write
Because \(\gamma <0\) this yields, for large x and setting \(q=n/k\),
Therefore, \(x^*\) can be estimated as
where \(\hat{\gamma } <0\), and \(\hat{x}^*:=\infty \) otherwise. The endpoint estimate of G1 for the China is shown in Fig. 10, and the selected estimate is the dotted horizontal line.
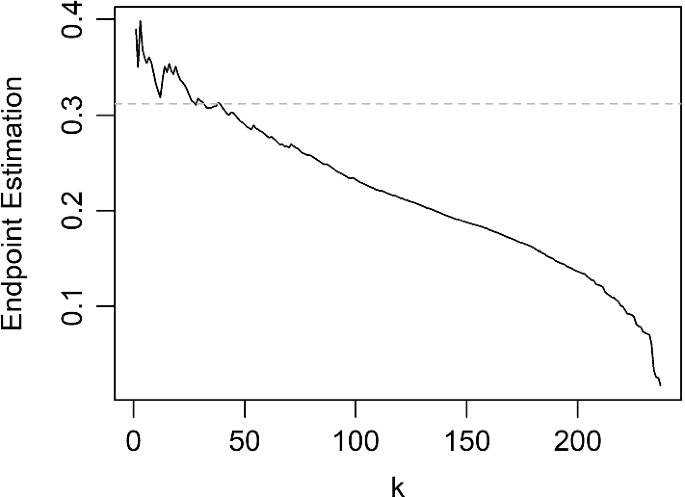
Endpoint estimators versus k for G1 of the China Market
Rights and permissions
Springer Nature or its licensor holds exclusive rights to this article under a publishing agreement with the author(s) or other rightsholder(s); author self-archiving of the accepted manuscript version of this article is solely governed by the terms of such publishing agreement and applicable law.
About this article

Cite this article
Xu, J., Li, Y., Liu, K. et al. Portfolio selection: from under-diversification to concentration. Empir Econ 64, 1539–1557 (2023). https://doi.org/10.1007/s00181-022-02300-x
Received:
Accepted:
Published:
Issue Date:
DOI: https://doi.org/10.1007/s00181-022-02300-x
Keywords
- Diversification and concentration
- Efficient frontier
- Market portfolio
- Extreme value theory
- Dimensional reduction