
Abstract
We analyse the progressivity and redistributive effects of India’s income tax system utilizing Income Tax Department data for 2011–18. By fitting Lorenz and tax concentration curves to these data, we find that despite exhibiting high levels of progressivity, the redistributive effects of income taxes remain modest amongst tax assessees and miniscule within the adult population. We also find that plugging the gap between statutory and actual average tax rates will do little to improve redistributive effects, and lowering income thresholds for top marginal tax rates offers greater redistributive and revenue potential than reducing exemption limits or increasing top marginal tax rates.
1 Introduction
At a time when governments have rapidly expanded their balance sheets to mount a fiscal response to the COVID-19 pandemic and there are growing concerns with distributional consequences of the pandemic as well as the financing of mounting fiscal deficits, an examination of the performance of tax systems in terms of redistribution and resource mobilization is increasingly pertinent. The issue is no less pertinent for developing countries like India. However, much of the recent attention on the tax system in India prior to the pandemic has focused on the indirect tax system with debates preceding and following the introduction of the Goods and Services Tax (GST) in July 2017 and more recently on the cut in the corporation tax rate in September 2019. By contrast, much less attention has been paid to the system of personal income taxes in the country. It is well known that personal income taxation is potentially one of the most progressive instruments of tax policy, and hence, it can play an important role in securing redistribution of income from the affluent to the less well-off. For India, this role is increasingly important with accumulating evidence on rising inequality in the country. According to the World Inequality Report 2018, India is one of the most unequal countries in the world, with its income share of the top 10 per cent of the population estimated at 55 per cent in 2016. Up from 31 per cent in 1980, this represents one of the steepest increases in inequality globally (Alvaredo et al. 2018). Covering a much longer time span going back to the British Raj, Chancel and Piketty (2019) report that ‘the share of national income accruing to the top 1% income earners is now at its highest level since the creation of the Indian Income tax in 1922’. Similarly, there is evidence that India’s rapid economic growth since the economic reforms of the early 1990s came with rising inequality.Footnote 1 Ironically, the economic slowdown since 2017 has also drawn attention to inequality, as most observers believe the slowdown to be demand-driven linked in part to the stalled growth in remunerative employment opportunities and its distributional consequences.
Despite growing concerns with income inequality, little work has been done to shed light on the performance of personal income taxation as the principle redistributive instrument of tax policy in India.Footnote 2 A significant obstacle has been the paucity of detailed data on income taxes, as also noted by Chancel and Piketty (2019). In contrast to household-level data on the distribution of consumption expenditure (accessible, most notably, from the National Sample Surveys), micro-data on income tax returns are simply not available. However, the Income Tax Department has been periodically releasing highly aggregative income tax statistics for the country. The released statistics (described in detail in the following section) take the form of grouped frequency distribution tables on gross incomes and assessed taxes over a limited range of income or tax classes. While these income tax statistics have been fruitfully used to estimate top income shares and the overall distribution of income in India, notably by Banerjee and Piketty (2005) and Chancel and Piketty (2019), they have seldom been utilized for inquiring into tax progressivity and redistribution. To our knowledge, Nayak and Paul (1989) is the only study that has used such data for this purpose. However, their analysis is limited to a single year, 1985–86 (and their analysis is also limited to tax assessees only). A similar line of inquiry appears not to have been pursued on Indian data since.
This too may be partly on account of the gaps in the release of such statistics by the Income Tax Department. However, the Indian tax authorities recently resumed the public release of income tax statistics, and for the current decade, seven such sets of income tax return statistics are publicly available, namely, for the assessment years 2012–13 to 2018–19 (inclusive). As the assessment year relates to income earned over the preceding financial year, the available tabulations span the financial years (FY) 2011–12 through 2017–18. While these grouped tabulations are no substitute for micro-data, they offer an unprecedented opportunity for a peek into the performance of India’s income tax system, and inquire into its progressivity and redistributive effects in recent years.
However, we note at the outset one significant limiting feature of the available income tax statistics. The available statistics provide information on incomes and taxes of tax assessees only, i.e. those who have either filed income tax returns or in whose case taxes have been deducted at source even though they have not filed returns. While this includes those paying zero taxes if their assessed incomes are below the exemption limit, it excludes all other income earners outside the personal income tax system. For instance, for the assessment year 2018–19, the available income tax information pertains to India’s 80 million personal income tax assessees (including zero-tax assessees). While the number of assessees has been growing over the years, it represents only a small fraction of those employed or the adult population in the country, the latter estimated at around 848 million.Footnote 3 Hence, using the Indian income tax statistics data alone, we are unable to construct distributions of income and taxes for the entire adult population in the country. We thus present our analysis in three parts. We first evaluate the progressivity and redistributive effects of income taxes using different inequality measures within the domain of income tax assessees only, relying solely on our analysis of the income tax statistics for FY 2011–12 to 2017–18.
In the second part, we extend this analysis to the whole adult population of the country by additionally drawing upon the Lorenz curves of income estimated by Chancel and Piketty (2019) which we combine with our own estimates of the tax concentration curves for the entire adult population. Since the income Lorenz curves from Chancel and Piketty (2019) are only available for 2011–12 to 2014–15, this analysis is limited to just those four years. We also consider how the redistributive effects could be enhanced in the benchmark case where the income tax proceeds are redistributed as a uniform transfer.
Finally, we evaluate some counterfactual tax schedules, including a recent set of personal income tax proposals submitted to the Government of India by a Task Force on direct tax code reform. We also consider some variations to the proposed tax schedule to assess whether they can help improve the revenue and redistributive potential of the personal income tax system.
In particular, our analysis seeks to address the following questions. How progressive have India’s personal income taxes been? Has India’s income tax progressivity changed over the years? How much of a redistributive effect do the observed levels of tax progressivity translate into? How do the average actual tax rates compare with the average statutory tax rates, and do the latter, if applied fully, provide a significantly larger redistributive potential? What are the likely implications of proposed changes to the tax schedule for progressivity and redistribution, and are there alternatives that can do better?
It is important to note that this is still a narrow set of questions pertinent to the income tax system. Specifically, we do not delve into issues of optimal taxation, the mix of different types of direct taxes as well as the mix of direct and indirect taxes.Footnote 4 Redistributive effects also depend on how tax revenues are spent. We have made a limited attempt to explore this through the uniform transfer simulation. However, our analysis primarily focuses on the first-round redistributive implications of the income taxes. The absence of more detailed micro-data prevents us from examining the behavioural and compliance consequences of alternative tax schedules as well as their potential general equilibrium effects.Footnote 5
In brief, our main findings are:
-
(i)
personal income taxes in India have a high degree of progressivity, which has not changed much over the years 2011–18;
-
(ii)
despite high levels of progressivity, the redistributive effects of income taxes are modest amongst the tax assessees and miniscule amongst the adult population;
-
(iii)
there is a significant gap between statutory and actual tax rates, but even the full observance of the statutory rates is unlikely to yield significant gains in redistributive effects;
-
(iv)
uniform transfers augment the redistributive effects of personal income taxes, but the improvement is limited by the size of income tax revenue;
-
(v)
the Task Force proposals are likely to significantly reduce income tax revenues as well as dampen their progressivity and redistributive potential;
-
(vi)
alternative tax schedules that limit income thresholds for higher marginal tax rates are likely to be more important for redistribution than limiting the tax exemption threshold.
The rest of the paper is organized as follows. Section 2 offers a brief background to personal income taxes within the Indian tax system. Section 3 introduces the data and measurement framework. Section 4 reports the main empirical results with respect to both taxpayers and the population as a whole. Section 5 presents the analysis of counterfactual tax schedules. The paper ends with the concluding note of Sect. 6.
2 Personal income taxes and the Indian tax system
Figure 1 and Table 1 help place personal income taxes in India within the country’s overall tax system for recent years. The Indian tax system relies more heavily on indirect rather than direct taxes; in recent years, direct taxes have contributed less than two-fifths of the consolidated tax revenues of the central and state governments (Fig. 1). Within India’s federal tax structure, the powers of income taxation are heavily vested with the central government. Thus, while the share of direct taxes in the tax revenues of state governments has been only around 12%, their share in tax receipts of the central government has above 50%. Amongst the direct taxes levied by the central government, personal income taxes are an important component. They contribute about two-fifths of the central government’s direct tax receipts and about one-fifth of its total tax receipts (Table 1). However, the share of personal income taxes in the combined tax revenues of the centre and states has been relatively low, ranging between 12 and 14% during 2011–12 to 2017–18. Combined with a relatively low overall tax–GDP ratio of 16–18% over this period, this has also implied that personal income taxes as a proportion of GDP have ranged only between 1.9 and 2.5 per cent.

Share of direct taxes in total taxes of the Centre and States and the overall direct tax/GDP ratio in India (%). Source Authors’ calculations based on RBI database
These features of the tax system in India that are also shared by many other developing countries have been noted in the literature, highlighting concern with three issues for developing countries: (i) a low overall tax effort, (ii) a high reliance on indirect taxes for resource mobilization and (iii) limited redistribution potential of the tax system, largely seen to be a consequence of (i) and (ii).Footnote 6 In particular, there has been pessimism regarding the redistributive potential of income taxes. For instance, in their study of personal income taxes in developing countries, Bird and Zolt (2005) note that ‘the personal income tax has done little, if anything, to reduce inequality in many developing countries. This failure is not surprising given that in many such countries, including those in Asia, personal income taxes are neither comprehensive nor very progressive—they often amount to little more than withholding taxes on labor income in the formal sector. The personal income tax plays such a small role in the tax systems of many developing countries that it is unlikely that this tax could have a meaningful impact on distribution’ (p. 928).
Before taking a detailed look into the redistributive potential of personal income taxes in India below, it is worth posing the question whether India’s tax effort in relation to personal income taxes is too low given its current level of development. Figure 2 shows the cross-country relationship between the income tax-to-GDP ratio and per capita GDP in 2011 purchasing power parity dollars across 77 countries for 2017. The figure shows that personal income tax effort increases with per capita income. However, India lies very close to the fitted line, indicating that India’s personal income tax ratio, though relatively low, is not very different to what one would expect given India’s per capita income. It will be useful to bear this in mind in assessing our findings on the redistributive potential of the Indian personal income tax system below.

Cross-country income tax-to-GDP ratio against per capita GDP (2011 PPP), 2017. Source Authors’ calculations from Government Financial Statistics (GFS) and World Bank Database (WBD) data
3 Data and methods
We begin by setting out the basic measurement framework for estimating progressivity and redistributive effects of income taxes. We then describe the nature of the data available, the estimation challenges that poses for us and how we address them.
3.1 Measurement framework
The progressivity of a tax system refers to the relationship between the average tax rate and the level of pre-tax income. A tax system is considered progressive (regressive) if the average tax rate increases (decreases) with pre-tax income. However, as the average tax rate varies with the level of (pre-tax) income, even if increasing at all levels of income, this does not yield a single measure of tax progressivity for the whole distribution. In consideration of the latter, we rely on the measurement framework developed by Kakwani (1976) who also introduced the important distinction between tax progressivity and the redistributive effect of taxes. The basic elements of this framework are outlined below.
Let \(t\left(y\right)\) be the tax paid by an individual with pre-tax income \(y\). Let \(L(p)\) be the Lorenz curve of pre-tax income, giving the cumulative share of (pre-tax) income of the bottom \(p\) per cent of the population (ranked by increasing income level). Let \({\Psi }^{T}\left(p\right)\) be the concentration curve of taxes, giving the cumulative share of taxes paid by the bottom \(p\) per cent of the population. Let \(G\) and \({C}^{T}\) represent the Gini index of pre-tax income and the concentration index of taxes, respectively. Then, a measure of tax progressivity, \(P\), can be defined as the area between the concentration curve and the Lorenz curve and can be written as:
The evaluation of tax progressivity requires the estimation of the Lorenz curve of pre-tax income, \(L=L\left(p\right)\), and the concentration curve of income taxes, \({\Psi }^{T}={\Psi }^{T}\left(p\right)\). Using these, \(G\) and \({C}^{T}\) can be calculated as \(G=1-2{\int }_{0}^{1}L\left(p\right)dp\) and \({C}^{T}=1-2{\int }_{0}^{1}{\Psi }^{T}\left(p\right)dp\), respectively.
Kakwani (1976) showed that \(P\) is positive if the income elasticity of taxes (\(y{t}^{^{\prime}}/t\)) is greater than one for all \(y\), is zero if taxes are proportional to income for all \(y\) (the concentration curve of taxes coincides with the Lorenz curve of pre-tax income), and the higher the income elasticity of taxes, the higher the value of \(P\). This makes \(P\) a suitable measure of tax progressivity. This measure has been subsequently generalized by introducing a general weighting function over the distribution (Pfahler 1987). The generalization introduces additional issues of the choice of the weighting function. However, for our purposes the measure in (1) suffices for its ease of interpretation in the light of its transparent link to the concentration and Lorenz curves.Footnote 7
This measure of tax progressivity can also be distinguished from what are sometimes referred to as measures of structural progressivity or progressive capacity of income taxes (Joumard et al. 2017; Gerber et al. 2018). These measures refer to the progressivity of the statutory tax schedule itself (calculated over a fixed range of income) independent of the pre-tax income distribution. While we will later compare statutory taxes with actual taxes, in our view, the dependence of the tax progressivity measure in (1) on the pre-tax distribution is not a drawback as it is sometimes claimed to be. On the contrary, it is only reasonable that the same tax schedule should carry different implications for its progessivity depending upon the underlying distribution of pre-tax income. For instance, a given tax schedule with increasing marginal tax rate will in general yield a higher concentration of taxes for a more unequal distribution of income than for a more equal one, and it is appropriate that a measure of tax progressivity should reflect that.
Kakwani (1976) also introduced a measure of the redistributive effect of taxes, \(R\), as the decline in inequality achieved by the tax system, measured as the difference between Gini indices of pre-tax and post-tax incomes. Denoting the latter by \({G}^{*}\), the redistributive effect of the tax system is given by:
The redistribution achieved by the tax system is linked to tax progressivity through the following relationship:
where \(\tau \) is the average tax rate (the ratio of total taxes to total pre-tax income).Footnote 8 Strictly, there is also a re-ranking term on the right-hand side if those with higher incomes end up paying lower taxes such that the ranking of post-tax incomes differs from that of pre-tax incomes. We rule out this possibility by making the reasonable assumption that taxes paid are monotonically increasing in pre-tax income, as we are unable to estimate this term with the Indian tax data available to us (see Sect. 3.2). In applications that estimate this re-ranking term, it has been found to be usually quite small (see, for instance, Guilaud et al. 2020).
Equation (3) shows that the redistributive effect of taxes depends on both tax progressivity and the average tax rate. \(R\) can be low with high \(P\) if the \(\tau \) is low, or vice versa. As we will see below, this relationship will be critical to the assessment of the redistributive performance of the Indian personal income tax regime.
In addition to assessing the redistributive effects as the difference between the Gini indices of pre- and post-tax incomes, we also look at redistributive effects in terms of alternative inequality measures that focus more explicitly on the top end of the distribution.Footnote 9 In particular, we will also present below estimates for the Top 10% income share (henceforth T10 share) and the ratio of Top 20% income share to the Bottom 20% income share (henceforth T20/B20 ratio). These measures provide a broader assessment of the inequality implications of income taxes.
The pre-tax Top \(p\)% income share is readily calculated as \(1-L\left(1-p\right)\), while the post-tax Top \(p\)% income share is given by \(1-\left[\frac{L\left(1-p\right)-\tau {\Psi }^{\mathrm{T}}\left(1-p\right)}{1-\tau }\right]\).Footnote 10 The difference between the pre- and post-tax Top \(p\)% shares thus offers a corresponding measure of redistribution. Denoting the latter as \({R}^{Top(p)}\), analogous to the Kakwani formulation for the Gini index (Eq. 3 above), we can define corresponding measures of progressivity and redistributive effects for the Top \(p\)% as below:
where the expression in the square brackets on the right-hand-side is a measure of the progressivity of taxation, \({P}^{Top(p)}\), for the Top \(p\)%. It is positive if the Top \(p\)% share in income taxes is higher than their share in pre-tax incomes. Equation (4) again makes apparent that the redistributive effect depends on progressivity as well as the average tax rate.
We now turn to the discussion of how we estimate the income Lorenz curves and the tax concentration curves with the available data for India in the next two subsections.
3.2 Data on income taxes and incomes
Our data on the distribution of income taxes and incomes for India come from the publicly released tabulations in the Income Tax Return Statistics (ITRS) from the Income Tax Department of the Government of India. These Statistics are available for seven assessment years (AY) 2012–13 through 2018–19. As an assessment year relates to income earned during the preceding financial year, hereafter we will refer to these statistics as pertaining to the financial years (FY) 2011–12 through 2017–18. The ITRS tabulations provide income tax statistics for several tax entities; however, we limit our analysis to individuals who constitute about 95% of total income taxpayers in the country.Footnote 11
Table 2 for the FY 2017–18 shows the typical form in which the ITRS data are available. As the table shows, two separate sets of tabulations on incomes and taxes are available. First, the tabulations on the distribution of pre-tax income are available in the form of the number of returns and total gross (pre-tax) income by size classes of gross income. Second, the tabulations on the distribution of income taxes are available in the form of number of returns and the total tax assessed (including tax deducted at source) by size classes of tax assessed.
This particular form of the available data poses two estimation challenges. First, while one can readily estimate the Lorenz curve of pre-tax income from the income tabulations, for the estimation of concentration curve of taxes, we need distributions of assessed taxes not by size classes of tax assessed but by size classes of gross pre-tax income. However, the latter are not available from the ITRS data.Footnote 12 We deal with this issue by making a simplifying but reasonable monotonicity assumption that assessed taxes increase with pre-tax income (or at least they are non-decreasing in pre-tax income). Under monotonicity, the ranking of individuals by tax assessed preserves their ranking by pre-tax income, which allows us to estimate tax concentration curves from the ITRS data.Footnote 13 While there can be instances of violation of this assumption, note that it will be satisfied even in the presence of tax avoidance so long as tax avoidance at the margin is less than the marginal tax rate. Without access to micro-data or alternative tabulations of tax data, we have little choice but to work with an assumption like this.
The second issue has to do with the large mass with zero assessed tax. As seen in Table 2, of the 55.3 million tax returns in FY 2017–18 (AY 2018–19), more than 22.4 million or about 40 per cent had an assessed tax of zero.Footnote 14 Thus, the implied concentration curve for these data remains flat at zero up to the bottom 40 per cent of the distribution, and only rises to positive values beyond that. Such a shape of the tax concentration curve reflects the prevailing exemption limit for income taxation. There is nothing atypical about this; income tax systems around the world all allow for exemption thresholds. However, it does imply that in fitting a functional form to the tax concentration curve, we need to explicitly allow for the flat segment below the exemption limit, while the usual nonlinear functional forms only apply to the rising segments of the concentration curve.
3.3 Piecewise tax concentration curves
In the light of the above, we estimate a piecewise tax concentration curve. In particular, let \({p}_{0}\) be the cumulative proportion of tax assessees who do not pay any taxes. Then, the piecewise concentration curve can be specified as:
Then, the tax concentration index can be written as:
However, if we rescale the cumulative proportion of assessees as
it follows that \(\mathop \smallint \nolimits_{{p_{0} }}^{1} f\left( p \right)dp = \left( {1 - p_{0} } \right)\mathop \smallint \nolimits_{0}^{1} f\left( {p^{\prime}} \right)dp^{\prime}\). Hence,
This allows us to fit standard nonlinear functional forms to the rising segment of the concentration curve, \(f({p}^{^{\prime}})\), through rescaling actual values of \({p}_{0}\) to \(p{^{\prime}}\), further enabling us to recover the piecewise concentration curve \(\Psi \left(p\right)\) and estimate the associated concentration index.
3.4 Functional forms for Lorenz and concentration curves
There are a number of functional forms in the literature for estimating Lorenz and concentration curves.Footnote 15 We settle for the Ortega et al. (1991) functional formFootnote 16:
We use this functional form for both the Lorenz curve of pre-transfer incomes and the concentration curve of income taxes.Footnote 17 In case of the latter, this functional form is fitted to the rescaled function \(f\left( {p^{\prime}} \right)\) corresponding to the rising segment of the concentration curve. With this functional form, the Gini index of pre-transfer income and the concentration index of income taxes are evaluated as:
and
where \(B\) is the beta function calculated by \(B\left( {\alpha + 1,\beta + 1} \right) = \mathop \smallint \limits_{0}^{1} p^{\alpha } \left( {1 - p} \right)^{\beta } dp\).
4 Results
4.1 Statutory tax schedules and the limited reach of income taxes
Table 3 shows how the applicable statutory tax schedules in India have evolved over the seven years from FY 2011–12 to FY 2017–18. For all years prior to FY 2017–18, the tax schedules have had a three-tier structure of 10, 20 and 30 per cent marginal tax rates (MTR) for income ranges above the exemption threshold. FY 2017–18 also used a three-tier structure but with marginal tax rates of 5, 20 and 30 per cent. In addition to the MTRs, starting with FY 2013–14, there has also been a surcharge implemented at higher income thresholds, though the surcharge is applied to the total tax liability. For the years FY 2013–14 through FY 2016–17, this surcharge was applicable to incomes above Rs. 10 million, with the surcharge rate of 10% for FY 2013–14 and FY 2015–16, 12% for FY 2014–15 and 15% for FY 2016–17. For the most recent year FY 2017–18, two surcharge rates were introduced: 10% for incomes above Rs. 5 million and 15% for incomes above Rs. 10 million. Over and above the marginal tax rates and surcharge, an education cess of 3% was also applied to the total tax liability inclusive of surcharge.
Table 3 also shows how the income thresholds for different tax/surcharge slabs have evolved relative to nominal per capita GDP. For instance, the exemption limit for FY 2011–12 was 2.5 times the per capita GDP. This has been gradually falling over time, with the exemption limit including rebate being 2.3 times the per capita GDP (1.9 times excluding rebate) for our most recent year FY 2017–18. The income thresholds for different MTR and surcharge slabs have also been falling as a ratio of per capita GDP. However, it is notable that even for the latest year FY 2017–18, the income threshold for the top MTR of 30% was nearly 8 times the per capita GDP, while the highest marginal tax rate including the surcharge only kicks in at an extremely high income level of about 77 times the per capita GDP. To put this in perspective, amongst the OECD countries, in 2018 the median exemption limit as a proportion of the average wage was 0.4, while the median threshold for top marginal tax rate was 3.3 times the average wage (OECD Stat, 2019).
Given the high exemption thresholds relative to per capita income as well as a range of provisions for tax deductions, the reach of the personal income tax system in India is quite limited. Total number of tax assessees represented only about 9.5% of the adult (20 +) population in India in FY 2017–18 (Table 4). This is despite the rapid growth in the number of tax assessees since FY 2011–12 when they represented less than 6% of the adult population. However, one should note that a large fraction of the assessees file zero-tax returns. Thus, the proportions of the adult population paying any positive income tax are much smaller, only about 2.6% in FY 2011–12, and though much higher in FY 2017–18 but still just 5.6%. It is thus not surprising that personal income tax collections as a proportion of GDP have remained low in India during 2011–2018. While increasing over time, they comprised a mere 2.5% of the GDP in FY2017-18 (Table 1).
4.2 Progressivity and redistribution amongst tax assessees
Table 5 reports the estimated parameters for the income Lorenz curves and the tax concentration curves amongst tax assessees for each of the seven years. The Ortega et al. functional form fits our data extremely well, with R-squares approaching 1 in all cases.Footnote 18 Figure 3 shows the fitted Lorenz and concentration curves for FY 2017–18. As seen in the figure, the tax concentration curve lies well below the Lorenz curve of pre-tax incomes, indicating that the income tax system is progressive. The tax concentration curve is flat at nearly zero up to almost the 70th percentile of tax assessees, which reflects the prevailing exemption limit, allowances for various tax deductions and the low marginal tax rate in the first taxable income slab. The pattern is similar for the earlier years. Figure 4 summarizes this by plotting the vertical distance between the Lorenz and concentration curves across the distribution for each year. The plots of this gap between Lorenz and concentration curve could be thought of as tax progressivity curves, since twice the area under these curves is equivalent to the tax progressivity measure (1). As seen in Fig. 4, the tax progressivity curves for the six years are very similar to each other, suggesting little change over time.
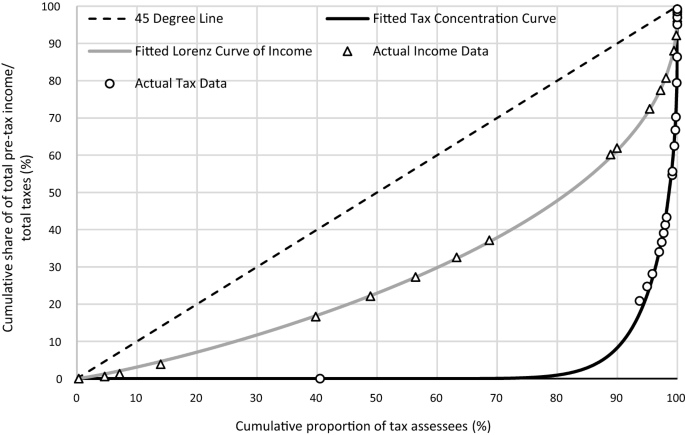
Pre-tax income Lorenz curve and tax concentration curve for AY 2018–19 (FY 2017–18)—tax assessees. Source Authors’ calculations from ITRS data
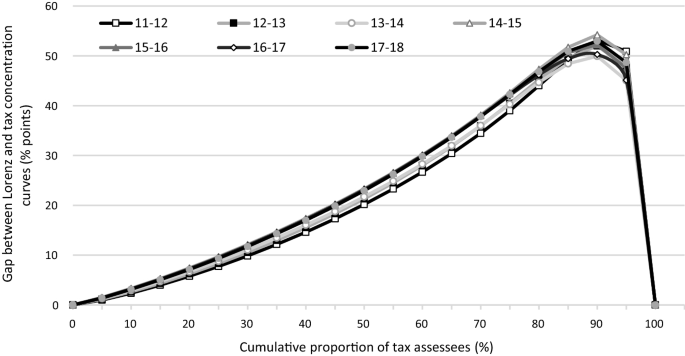
Tax progressivity curves for FY 2011–12 to AY 2017–18- tax assessees. Source Authors’ calculations from ITRS data
Using the methods described in Sect. 3, Table 6 presents our main results on the progressivity and redistributive effects of income taxes for the population of tax assessees. The results show that the Gini indices of pre-tax income have ranged between 0.44 and 0.49 over the seven years.Footnote 19 By comparison, the concentration indices of income taxes have been about twice as high ranging between 0.93 and 0.96. These very high levels of concentration indices are striking but should not be surprising. They are a direct consequence of the fact that two-fifths or more of the income tax assessees do not pay any taxes at all.
Thus, there is a substantial gap between the concentration indices of income taxes and the Gini indices of pre-tax incomes, which in turn implies a high degree of tax progressivity. The tax progressivity measure (\(P\)) ranges between 0.47 and 0.52. Over the seven years, there have been relatively small changes in tax concentration indices and pre-tax income inequality. Hence, the resulting changes in tax progressivity have also been modest. There does not appear to be any notable trend in the tax progressivity measure, which increased from 0.46 in FY 2011–12 to 0.51 in FY 2014–15, declined to 0.49 by FY 2016–17, though rose again to 0.52 in FY 2017–18.
Despite the high degree of tax progressivity, however, the redistributive effect of income taxes (\(R\)), measured as the difference between pre-tax and post-tax Gini indices of income, has been small at around 0.05 with very little change over time. This is largely on account of a low average tax rate (amongst all assessees) of about 9–10%, which has remained practically unchanged over the seven years. For the period as a whole between FY 2011–12 and FY 2017–18, while there was an increase in tax progressivity from 0.46 to 0.52, the redistributive effect changed little with only a miniscule increase of 0.006 over the seven years (last row of top panel of Table 6).
The bottom panel of Table 6 reports the redistributive effects in terms of changes in income shares, as measured by T10 shares and T20/B20 ratios. Lower post-tax T10 shares and T20/B20 ratios reflect the redistributive effect of the tax system. On average, income taxes reduce the T10 shares by about 4 percentage points from about 40% to 36%, while they reduce the T20/B20 ratios from about 7.9 to 6.6. The size of these effects is comparable to the changes in Gini indices. Column 4 of the bottom panel shows the tax progressivity measure, \({P}^{Top(p)}\), for the Top 10% income share. This mirrors the pattern for tax progressivity noted above for the entire distribution of tax assessees. Tax progressivity with respect to the Top 10% is significant with even some increase by the end of the period. However, with little change in the (low) average tax rate, its effect on the reduction of the Top 10% share is limited.
Overall, these results show that the main limiting factor on the redistributive effects of income taxes in India seems to be not the lack of a high degree of progressivity but a low average rate of taxation. The latter in turn reflects the limited reach of the income tax system in the country and the low effective tax rates for the vast majority of assessees.
4.3 Statutory v actual tax rates
Is the relatively small redistributive effect on account of the actual taxes paid by the assessees being below the statutory tax rates? The income tax code in India allows for a large number of deductions. Amongst others, these include deductions for life insurance premium, contribution towards pension funds, investment in National Saving Certificates, repayment of house loan, tuition fees for children, 5-year fixed deposit with a scheduled bank or post office, payments for medical treatment and medical-claim premium, interest on loan for higher education or residential house, interest on deposits in saving accounts and deduction for maintenance/medical treatment of dependents.Footnote 20 These deductions can contribute to a high degree of tax avoidance by substantially reducing the assessees’ tax liability, thus pushing the actual tax rates well below the statutory rates. How significant has this phenomenon been in the Indian context?
Figure 5 plots the statutory average tax rate and the actual average tax rate for different percentiles of tax assessees for FY 2017–18.Footnote 21 As seen in the figure, the statutory average tax rates do exceed the actual average tax rates beyond about the 30th percentile, and the gap widens at higher percentiles. Figure 6 plots this gap for each of the seven years, which shows a similar pattern over the years.
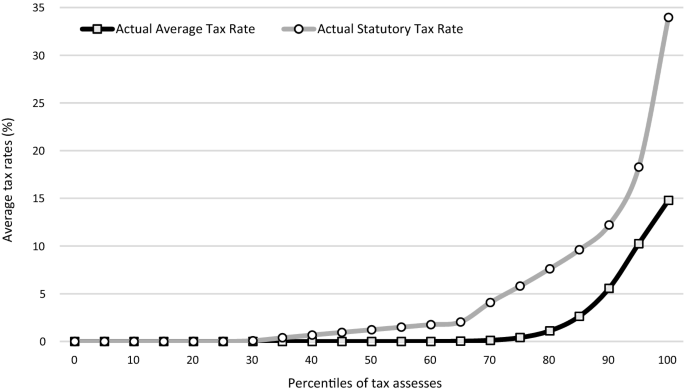
Average statutory and average actual tax rates by percentiles of tax assessees for AY 2018–19 (FY 2017–18). Source Authors’ calculations from ITRS data
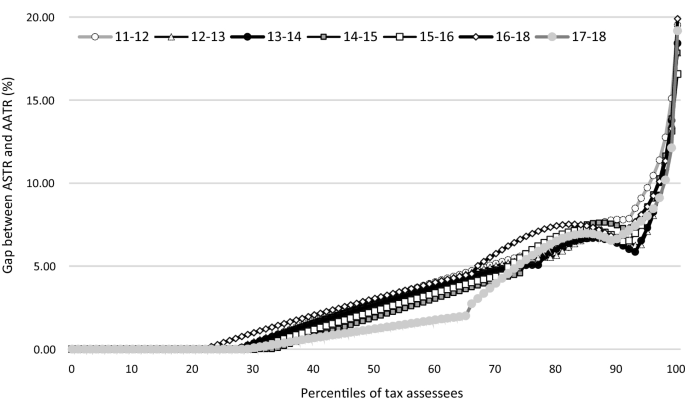
Gap between average statutory and average actual tax rates by percentiles of tax assessees: FY 2011–12 to 2017–18. Source Authors’ calculations from ITRS data
This gap between the statutory and actual tax rates points to significant tax avoidance. (We provide an estimate of this below.) However, it is difficult to infer from Figs. 5 and 6 the level of implied progressivity of statutory taxes relative to that of actual taxes. This is because while higher statutory rates at the upper end of the distribution contribute to greater taxes from the relatively rich, the full application of the statutory rates also raises taxes of those at the lower end closer to the exemption limit. In principle, the overall effect on the concentration of taxes, and hence on tax progressivity, can go in either direction.
Parallel to the above analysis for actual taxes, we present our estimates of the progressivity and redistributive effects of statutory taxes in Table 7,Footnote 22 which can be compared with the corresponding results for actual taxes in Table 6. The estimates indicate that compared with actual taxes, statutory taxes imply a lower level of progressivity. While this may appear odd at first glance, with the application of the statutory rates (without any deductions) positive taxes start kicking in earlier at lower income levels in comparison to actual taxes. This lowers the concentration of statutory taxes and hence reduces their progressivity. The main ‘gain’ for the redistributive effect is in the form of higher tax revenues. With the statutory rates, the average tax ratio increases by about 2–3 percentage points above the actual, from about 9–10% (actual) to 11–13% (statutory). However, the net result of lower progressivity and higher average tax ratio is that the redistributive effect of statutory taxes is not very different to those of actual taxes. Thus, an elimination of tax avoidance could yield a substantial increment in tax revenues of up to 30% (last column of Table 7), but it is unlikely to yield a significant improvement in the redistributive effect of income taxes per se. Additional redistribution, if any, would have to be achieved outside of the income tax system through a more pro-poor spending of the additional revenues.
4.4 Progressivity and redistribution for the whole population
As noted above, income tax assessees represent only a small fraction of the population. Thus, if the redistributive effects of income taxes are small amongst the tax assessees, they are likely to be considerably smaller for the whole population. However, to quantify the latter we need estimates of the distribution of income for the whole population. For this, we draw upon the work of Chancel and Piketty (2019) who estimate the historical income distribution in India during 1922–2015. In particular, we draw upon the Lorenz curves of pre-tax incomes of the adult (20 + years) population in India estimated by them for the last four years of their analysis, 2011–12 to 2014–15, that overlap with the period we cover. Essentially, we combine these with the ITRS data to estimate progressivity and redistributive effects of income taxes for the whole population for those years. In particular, our procedure amounts to assuming that the ITRS distribution for the sub-population of tax assessees above the tax exemption threshold corresponds to the top slice of the Chancel-Piketty Lorenz curves for those years. Thus, for instance, for FY 2014–15, tax assessees represented 7.3% of the adult population (Table 4) and assessees above the exemption threshold of Rs. 250 thousand represented 5.8% of the adult population. Thus, the ITRS pre-tax income distribution of tax assessees above the exemption threshold for 2014–15 is taken to represent the top 5.8% slice of the Chancel–Piketty Lorenz curve for 2014–15. This linking of the two distributions then allows us to quantify the progressivity and redistributive effects of income taxes for the whole adult population of India.
Figure 7 presents the income Lorenz curve and the tax concentration curve for the whole adult population for FY 2014–15. The most striking part of the figure is the tax concentration curve, which is almost right-angled around the 96th percentile of the population. This is because those who pay any positive income taxes are all located within the top four percentiles of the overall income distribution; see Table 4 which shows that positive income taxpayers comprised about 3.7% of the adult population in 2014–15. As a result, the tax concentration index approaches unity for whole distribution, implying an extremely high degree of progressivity.

Pre-tax income Lorenz curve and tax concentration curve for AY 2015–16 (FY 2014–15)—adult population. Source Authors’ calculations from ITRS data combined with pre-tax income Lorenz curve from Chancel and Piketty (2019)
Table 8 presents the results on progressivity and redistributive effects of income taxation for the whole (adult) population for the four years 2011–12 to 2014–15. Note first that the income Lorenz curves estimated by Chancel and Piketty (2019) imply a high degree of pre-tax income inequality with Gini indices of around 0.6 and some increase over the four years.
However, with tax concentration indices approaching one in all years, the tax system still implies a relatively high degree of progressivity over the whole population. The tax progressivity measure is around 0.4 for all years. However, the average tax rate for the whole population has remained at a much smaller value of about 3.3–3.5 per cent, and hence, the resulting redistributive effect for the whole population is miniscule at a mere 0.013–0.014 Gini points.
The bottom panel of Table 8 reports results for the Top 10% shares and the T20/B20 ratios. On average over the period 2011–12 to 2014–15, the redistributive effect of personal income taxes yields a reduction in the top 10% income share by under 2 percentage points, from 55.1% to 53.6%, and a decline in the T20/B20 ratio from 16.7 to 15.9. The changes in these alternative inequality measures are more palpable than the changes in Gini, but they are nonetheless small. Again, this is not for lack of tax progressivity. As seen in column 4 of the bottom panel, the tax progressivity measure \({P}^{Top(p)}\) with respect to the Top 10% is quite high ranging between 0.44 and 0.45. However, given the very low yield of the tax system (very low average tax rate), this translates into only minor reductions in top income shares.
Thus, the personal income tax system has a negligible effect on the post-tax income inequality. As in case of the distribution for tax assessees, this is almost entirely due to the very low tax ratio. With the tax concentration indices approaching unity, there is hardly any more scope for further increases in tax progressivity. What these estimates demonstrate is that the personal income taxation system in India is highly ineffective as a redistributive instrument, and the redistributive inefficacy results not from a lack of progressivity but from the very low tax effort that the system sustains.
4.5 Progressivity and redistribution for the whole population with uniform transfers
The overall redistributive effect of income taxes will also depend on how the tax revenues are spent. While simulating the overall incidence of public spending is beyond the scope of this paper, we consider a benchmark case assuming all revenues from personal income taxes are redistributed as uniform transfers to the whole population. This mimics the provision of an evenly utilized public good. Note that uniform transfers are progressive by construction. Table 9 presents the results of this exercise.
As one may expect, the introduction of uniform transfers enhances the redistributive effects of personal income taxes. With uniform transfers, the average decline in Gini by 0.058 points is about four times higher than that without uniform transfers by 0.014 points, and the T20/B20 ratio declines from 16.7 to 13.7, as compared with a decline to 15.9 without uniform transfers. The decline in Top 10% income shares, however, remains modest, by 3 percentage points as compared with about 2 percentage points without transfers (as noted in Sect. 4.4).
Thus, with uniform transfers while the redistributive gains in terms of the Gini index and T20/B20 ratios are predictably larger, as they better reflect the transfers received at the bottom end of the distribution. The redistributive effects, however, remain modest at the top end of the distribution. Moreover, the gains at bottom end and for the overall distribution are ultimately limited by the total tax revenues available for redistribution. These could be considerably larger but for the low yield of the personal income tax system stuck at an overall average tax rate of 3%.
5 Some counterfactual tax schedules
The limited reach of India’s personal income tax system has been widely noted (Piketty and Qian 2009; Government of India 2016; Joumard et al. 2017). Piketty and Qian (2009) reason that the major contributing factor for the limited and stagnating reach of the Indian tax system during 1986–2008 has been the constant upward revision of exemption levels and tax brackets. Thus, an obvious way to augment the reach of the tax system is to freeze or at least under-index exemption limits relative to average income growth such that as nominal incomes grow, more people are brought into the tax net. To some extent, this has already been happening within the period we investigate. Since 2014–15, the exemption limit has been kept fixed at Rs. 250 thousand, and the effective exemption limit including the rebate has remained at Rs. 270 thousand before increasing to Rs. 300 thousand for FY 2017–18. This has helped increase the proportion of positive taxpaying assessees in the adult population from 3.7% in 2014–15 to 5.6% in 2017–18. However, our analysis also shows that despite this there has been little improvement in the overall tax ratio or the redistributive effect of income taxes. This is because the expansion of the tax net at the lower end of the distribution does little to augment tax revenues or their redistributive potential. A more consequential element of the tax schedule may be how it applies to the top end of the distribution, in particular the income threshold used for the top marginal tax rate as well as the magnitude of the top marginal tax rate itself.
We explore this by considering the progressivity, revenue and redistributive implications of some alternative statutory tax structures, using the latest year (FY 2017–18) for which ITRS data are available as the point of reference.Footnote 23 The alternative schedules we consider are described in Table 10, while Table 11 shows our results for each of these alternatives. We present the results for the income distribution of tax assessees only. Row (A) of Table 11 shows the measures of progressivity and redistributive effects of the statutory tax schedule for FY 2017–18 including the tax rebate but without allowing for any tax deductions.Footnote 24 Rows (B) through (G) consider six alternatives to the statutory tax schedule of FY 2017–18; all variants are evaluated without allowing for any tax deductions. We describe the results for these alternatives below, focusing on the top panel of Table 11 for Gini-based measures.Footnote 25
-
(i)
The first alternative we consider is the new tax schedule that was recently announced in the Union Budget for 2020 as an optional alternative to the current tax schedule. This schedule has a five-tier tax structure as shown in row (B) of Table 10, while retaining the cess and surcharges as under the existing regime. The government offered tax assessees the option of filing income tax returns under the new tax schedule without availing most of the tax deductions or availing those deductions and filing returns under the old tax schedule (Government of India, 2020). Our calculations assume a complete shift to the new tax schedule. They indicate that the new tax schedule will raise progressivity but reduce tax revenues by 11%, leaving the redistributive effect virtually unchanged at the level implied by the existing statutory schedule of FY 2017–18.
-
(ii)
In row (C), we consider the tax schedule that was proposed by a recent government-appointed Task Force on Direct Taxes. As shown in Table 10, this proposed schedule allows for four marginal tax rate (MTR) slabs above the exemption limit of Rs. 250 thousand: 10% MTR for Rs 0.25–1 million; 20% MTR for Rs 1–2 million; 30% MTR for Rs 2–20 million; and 35% MTR for above Rs 20 million. Note that the top MTR of 35% is proposed in lieu of the surcharges in the current system, and its level is roughly comparable to the current top MTR of 30% plus the top surcharge of 15%.Footnote 26 The notable difference, however, relates to the doubling of the income threshold for the top MTR, which raises this threshold to more than 150 times the per capita GDP of FY 2017–18. In addition, the Task Force also allows for a 100% tax rebate for incomes up to Rs. 500 thousand, thus effectively raising the tax exemption limit to this amount.Footnote 27 Row (C) of Table 11 shows the implications of these proposals. Relative to the statutory tax schedule for FY 2017–18 (Table 3), the proposed raising of the tax exemption limit and the MTR income thresholds increases the concentration of taxes and hence their progressivity. Furthermore, tax progressivity increases from 0.426 to 0.458. However, the proposed schedule also implies a large loss of tax revenues by 22% relative to the statutory taxes of 2017–18. The fall in the average tax rate from 11.6% to 9.1% is large enough to imply a lower redistributive effect, which falls from 0.056 for the prevailing statutory schedule to 0.046 for the proposed schedule.
-
(iii)
Row (D) is similar to Row (C), but considers an elimination of the tax rebate, thus effectively reducing the exemption limit from Rs. 500 thousand to Rs. 250 thousand. We consider this alternative motivated by the notion that a lower exemption limit will help widen the tax base. Given the distribution of tax assessees in FY 2017–18, this does bring an additional 6.9% of assessees into the tax net, but the gains in total tax revenue are small; the average tax rate improves from 9.1 to 10%. However, a lowering of the exemption limit reduces tax progressivity to 0.373. The gain in the average tax rate is not enough to compensate for the loss in progressivity, and hence the lowering of the exemption limit reduces the redistributive effect to 0.042.
-
(iv)
Row (E) keeps the exemption limit unchanged at Rs 250 thousand but considers changes at the top end of the distribution. In particular, the income threshold for the top MTR has been lowered to Rs. 5 million. This is motivated by our earlier observation on how the extremely high threshold for the top MTR contributes to both a low average tax rate and low redistributive potential. Row (E) shows that the reduction in the top income threshold helps raise both the progressivity as well as the average tax rate to 0.384 and 10.4%, respectively, and thus helps improve the redistributive effect to 0.045.
-
(v)
In row (F), we consider a more drastic revision of the tax schedule with a significant lowering of the income thresholds not only for the top MTR of 35%, also those for the MTRs of 30 and 20 per cent. In particular, while the exemption limit of Rs. 250 thousand is retained, an MTR of 10% is considered for incomes within Rs 0.25–0.5 million; a 20% MTR for Rs 0.5–1 million; a 30% MTR for Rs 1–2 million; and a 35% MTR for incomes above Rs 2 million (Table 10). While the reduction of the top MTR income threshold to Rs. 2 million (as opposed to Rs. 20 million in the Task Force proposal) may seem large, the top MTR still applies at an income threshold that is about 15 times the per capita GDP and represents the 99th percentile of the full income distribution of the adult population.Footnote 28 Under this alternative, we observe more significant changes. While the increase in tax progressivity to 0.397 is relatively small, we find a substantial rise in the average tax rate to 13.3%. As a result, the overall redistributive effect rises significantly to 0.061.
-
(vi)
The final alternative in row (G) further introduces a top MTR of 40% applicable at incomes above Rs. 5 million, which induces further increments in tax progressivity, the average tax rate and the redistributive effect to 0.403, 13.7% and 0.064, respectively. With this alternative, note that tax revenues are 18% higher than under the prevailing statutory taxes, and as much as 40% higher than under the Task Force proposals.
The bottom panel of Table 11 also reports results for the Top 10% income shares and the T20/B20 ratios. These results are consistent with those discussed above. Thus, for instance, moving from (C) to (D), which is equivalent to reducing the tax exemption limit, reduces the concentration of taxes and increases the share of the Top 10% in post-tax income from 34.5% to 35.3%, as the small gains in tax revenues do not compensate for reduced progressivity from 0.42 to 0.31 (column 4 of the bottom panel). There is also a small increase in the T20/B20 ratio. This reflects the fact while the lower exemption limit decreases post-tax incomes for all above the exemption limit, both the T20 and B20 post-tax income shares increase, whereas the income share of the middle (who bear the brunt of the adjustment) falls. The rise in the T20 share dominates the rise in the B20 share because the additional tax liability as a proportion of income is higher for B20 than for T20. As another example, moving from (D) to (F), which involves a lowering of the income thresholds for MTRs of 20, 30 and 35 per cent, implies an increase in tax progressivity as well as substantially (33%) higher average tax rate, resulting in a fall in the Top 10% share to 33.7%. This decline in inequality is also reflected in the fall in the T20/B20 ratio from 6.2 to 5.7.
Thus, to summarize, alternative tax schedules that involve a substantial upward revision of the income thresholds for the higher marginal tax rates, are likely to attenuate the already small redistributive potential of the personal income tax system due to a significant loss in tax revenues. Reduction of the exemption limit through a scrapping of the tax rebate will help widen the tax net, but with very limited tax liability at the lower end of the distribution, it will not do much to stem the erosion of tax revenues or their redistributive effect. Alternatively, we see that changes in the tax schedule at the higher end of the distribution will be more consequential. In particular, substantially lower income thresholds for the top MTR slabs than those proposed by the Task Force will be needed to preserve, let alone improve, the redistributive potential of the personal income tax system. They will achieve this not so much by improving the progressivity of the tax system, but by delivering significantly higher tax revenues. The adoption of a higher top marginal tax rate will further reinforce these effects.Footnote 29
6 Conclusion
Our study attempts to fill a gap in the literature on what is known about the progressivity and redistributive potential of India’s personal income tax system. While no micro-data on income taxes are accessible to examine this issue, our analysis shows that a lot can still be learnt from the available grouped tabulations of income tax statistics by fitting Lorenz and concentration curves to these data. Using these data for the years 2011–18, we evaluate progressivity and redistribution in terms of the change in Gini indices as well as measures focusing on the top and bottom end of the income distribution. Besides documenting the redistributive potential of the current personal income tax system in India, our findings also have relevance for the tax reform agenda in wake of the increasingly constrained fiscal environment following the COVID-19 pandemic.
The limited reach of income taxes in India is well known. Personal income tax revenues constitute a mere 2.5% of GDP. Over 40% of the tax assessees pay zero taxes and positive income taxpayers account for less than 6% of the adult population. By concentrating income tax collections amongst a small minority, this very feature contributes to a high level of progressivity of income taxes. However, this high level of progressivity does not translate into a significant redistributive effect, mainly due to the limited magnitude of taxes raised. The redistributive effect is small amongst the tax assessees and negligible amongst the adult population. The population-wide redistributive effect is larger when we further consider a benchmark simulation of the entire income tax proceeds being redistributed in the form of a uniform (and hence progressive) transfer. However, in this case too, the redistributive potential of the tax-transfer system is ultimately limited by the size of the uniform transfer as determined by the available tax proceeds. This pattern of findings holds over the entire period we investigate.
One may suppose that income tax collections are limited because there is substantial tax avoidance. We in fact do find a significant gap between statutory and actual average tax rates in support of this conjecture. However, even the full elimination of this gap through a scrapping of tax deductions is unlikely to greatly enhance the redistributive effect of income taxes as the rise in tax revenues is neutralized by the fall in progressivity.
We also find that recent Task Force proposals to increase the income thresholds for different MTR slabs will reduce the already small redistributive potential of personal income taxes. This again is due to the significant loss of tax revenues they are likely to entail (by about 22% relative to the 2017–18 statutory tax schedule), despite an increase in progressivity due to the raising of the tax exemption limit.
There seems to be only limited scope for further raising the overall tax progressivity. However, there is some scope for raising tax revenues. This is not so much by lowering the exemption limit. A lower exemption limit will bring more people into the income tax net, but since they will be paying minimal taxes, this will not have much bearing on overall tax revenues. There are also limits to the expansion of the income tax net given the large informal sector of the economy at India’s current level of development. There is, however, more room for raising tax revenues through limiting the income thresholds for higher marginal tax rates and eliminating deductions. Our simulations suggest that by lowering the income thresholds for the higher tax brackets (with marginal tax rates of 20% or above), tax revenues could increase by about one-third relative to the Union Budget 2020 provisions if combined with a scrapping of the tax rebate. Such an increase in the average tax rate will not only improve the redistributive effects of the income tax system directly, but also indirectly through a greater potential for pro-poor spending of the additional revenues.
Our analysis is but a part of the larger issue of the overall redistributive effects of fiscal policy. A comprehensive assessment will need to look into other elements of the tax/transfer system and the pattern of public spending. We have only taken a small step in this direction by looking into the uniform transfer case. Our study is also limited to the first-round redistributive implications of the income tax system. In the absence of more detailed micro-data, it is not possible to examine the behavioural and compliance consequences of alternative tax schedules as well as their potential general equilibrium effects. Access to such data will be critical for further research into these issues.
Notes
Datt, Ravaliion and Murgai (2020). Also see Ray and Singh (2019) who report that amongst the three largest economies of the world (in terms of purchasing power parity GDP), India is the only one that records a continuous rise its Gini index of consumption inequality during 1997–2011.
This is in contrast to a more significant literature for developed countries; a recent example is Guillaud, Olckers and Zenmour (2020) who look into redistributive through the tax and transfer systems for 22 OECD countries and document significant inequality-reducing effects, though with some political trade-offs between higher progressivity and higher average tax rates.
See Sect. 3.1 below for further discussion of the reach of personal income taxes in India.
For an early discussion, see Ahmad and Stern (1991).
See Lambert (1999) for a review of different measures of tax progressivity.
This refers to the overall average tax rate for all income earners.
We thank one of the journal referees for the suggestion to supplement the Gini index-based analysis with such additional inequality measures.
Analogously, the pre-tax and post-tax bottom \(p\)% income shares are given by \(L(p)\) and \(\left[\frac{L\left(p\right)-\uptau {\Psi }^{\mathrm{T}}(p)}{1-\tau }\right]\), respectively.
The proportion is similar or higher for earlier years. A taxpayer is defined as a person or entity who has either filed a return of income for the relevant assessment year or in whose case tax has been deducted at source in the relevant financial year but they have not filed the return. Note that the ITRS data are based on income tax returns. In working with these data, we assume that the distribution of those filing returns is fully representative of all taxpayers. Chancel and Piketty (2019) experimented with alternative assumptions on the distribution of taxpayers without returns and found them to have a very limited impact on the estimated income distributions.
Put differently, the available form of the ITRS data allows us to directly estimate the Lorenz curve of income taxes, not their concentration curve.
Under monotonicity, the concentration curve of taxes coincides with the Lorenz curve of taxes.
The proportion of zero-tax returns is even higher for earlier years and ranges between 43.4 and 56.4% (see Table 3).
In general, the three-parameter functional forms perform better than the two-parameter family. We initially began with the Hossain and Saeki three parameter functional form: \(\left(p\right)={p}^{\alpha }\left[1-{\left(1-p\right)}^{\beta }\right]{e}^{\theta (p-1)},\) \(\alpha \ge 0\), \(\beta \in (\mathrm{0,1}]\), \(\theta \ge 0\). However, we settled for the restricted Ortega form on finding \(\theta \) to be insignificant.
Recall that under the above-mentioned monotonicity assumption, the tax concentration curve coincides with its Lorenz curve.
We also experimented with the Kakwani and Podder (1976) functional form, which, however, did not fit the data as well. Results are available from the authors.
Atkinson (2015) suggests the rule of thumb of a three-percentage point change in Gini as being quantitatively important. By this yardstick, most of the year-to-year changes in Gini indices—with the exception of change between the first and the last year—are not significant in quantitative terms.
See https://www.incometaxindia.gov.in/ for details on available tax deductions.
For details on how the average statutory and actual average tax rates are calculated for different percentiles of tax assesses, see Appendix.
For details on the method by which these figures were calculated, see Appendix.
The method used to calculate these figures was similar to that for statutory taxes described in the prior subsection. For details, see Appendix.
We note that the specific features of tax proposals (D) through (G) by construction imply that the post-tax income Lorenz curves corresponding to them are non-intersecting.
The Task Force also recommends scrapping the current cess on total tax liability. This cess was levied at 3% for AY 2018–19 (FY 2017–18) and subsequently increased to 4% for later years. The calculations in rows (C) through (G) retain the 4% cess.
The statutory tax schedule for FY 2017–18 also allowed for a rebate up to an income of Rs. 350 thousand.
Estimated on the assumption that the income Lorenz curve for FY 2014–15 for the adult population (as used in Sect. 3.4 above) also applied to FY 2017–18.
Redistributive effects would be altered by the degree of additional tax evasion in response to different tax proposals. While we are unable to model tax evasion for India with the available data, in comparing any two proposals, the decomposition of redistributive effect into tax progressivity and average tax rates gives an indication of how high additional tax evasion would need to be to neutralize any gains in redistribution. Thus, for instance in comparing proposals D and F, for the entire additional redistributive effect of F over D to dissipate would require tax evasion that brings down the average tax rate to 10.4% relative from the simulated level of 13.3%.
This is not the same as \(\tau \) described in Sect. 3.1, as that instead represents the average tax rate amongst all tax assessees, not at a particular cumulative percentile as we have done here.
Statutory taxes for all years are multiplied by 1.03 due to the presence of the education cess.
References
Ahmad E, Stern N (1991) The theory and practice of tax reform in developing countries. Cambridge University Press, Cambridge
Alvaredo F et al (2018) World inequality report 2018. The Belknap Press of Harvard University Press, Cambridge
Atkinson AB (1973) How progressive should income tax be? In: Parkin M, Nobay AR (eds) Essays in Modern Economics, London: Longmans. https://www.econbiz.de/Record/essays-modern-economics-the-proceedings-the-annual-conference-the-association-university-teachers-economics-aberystwyth-1972-parkin-michael/10000328698
Atkinson AB (2015) Inequality: What can be done? Harvard University Press, Cambridge, Massachusetts
Atkinson AB, Stiglitz JE (1976) The design of tax structure: direct versus indirect Taxation. J Public Econ 6(1–2):55–75
Banerjee A, Piketty T (2005) Top indian incomes, 1922–2000. World Bank Econ Rev 19(1):1–20
Bird R, Zolt E (2005) The limited role of the personal income tax in developing countries. J Asian Econ 16:928–946
Chancel L, Piketty T (2019) Indian income inequality, 1922–2015: from British Raj to Billionaire Raj. Rev Income Wealth 65:S33–S62
Datt G, Murgai R, Ravallion M (2020) Poverty and growth in india over six decades. Am J Agric Econ 102(1):4–27
Gerber C, Alexander DK, Liu L, Mylonas V (2018) Personal income tax progressivity: trends and implications. IMF Working Papers, 18/246, International Monetary Fund
Government of India (2016) Economic Survey 2015–16, Ministry of Finance
Government of India (2020) Budget 2020–2021: Speech of Nirmala Sitharaman, Minister of Finance, February 1, 2020, Ministry of Finance
Guillaud E, Olckers M, Zemmour M (2020) Four levers of redistribution: the impact of tax and transfer systems on inequality reduction. Rev Income Wealth 66(2):444–466
Hossain S, Saeki C (2003) A new functional form for estimating lorenz curves. J Bus Econ Res 1(1):43–58
Joumard I, Thomas A, Morgavi H (2017) Making income and property taxes more growth-friendly and redistributive in India. In: OECD Economics Department Working Papers, No. 1389, OECD Publishing, Paris
Lambert PJ (1999) Redistributive effects of progressive income taxes, Ch. 16. In: Silber J (ed) Handbook of Income Inequality Measurement, Kluger Academic Publishers, Boston
Kakwani N, Podder N (1973) On the estimation of lorenz curves from grouped observations. Int Econ Rev 14(2):278–292
Kakwani N (1976) Measurement of tax progressivity: an international comparison. Econ J 87:71–80
Kakwani N (1977) Applications of Lorenz curves in economic analysis. Econometrica 45(3):719–728
Kakwani N, Podder N (1976) Efficient estimation of lorenz curve and associated inequality measures from grouped observations. Econometrica 14(2):278–291
Mirrlees J (1971) An exploration in the theory of optimum income taxation. Rev Econ Stud 38(2):175–208
Nayak P, Paul S (1989) Personal income tax in India: alternative structures and their redistributive effects. Econ Pol Wkly 24(50):2779–2883
Ortega P, Martin G, Fernandez A, Ladoux M, Garcia A (1991) A new functional form for estimating Lorenz curves. Rev Income Wealth 37(4):447–452
Pfahler W (1987) Redistributive effects of tax progressivity: evaluating a general class of aggregate measures. Public Finance/finances Publiques 37:1–31
Piketty T, Qian N (2009) Income inequality and progressive taxation in China and India, 1986–2015. Am Econ J Appl Econ 1(2):53–63
Ray R, Singh P (2019) Income inequality in an era of globalization: the perils of taking a global view. Department of Economics, Monash Business School Discussion Paper, 08/19
Villasenor J, Arnold BC (1989) Elliptical Lorenz curves. J Econom 40(2):327–338
Waseem M (2019a) Using movement of exemption cut-off to estimate tax evasion: evidence from Pakistan. University of Manchester Working Paper
Waseem M (2019b) Does cutting the tax rate to zero induce behaviour different from other tax cuts? Evidence from Pakistan, forthcoming in The Review of Economics and Statistics
Acknowledgements
The data used in this study are publicly available.
Funding
The study was not supported by any external funding agency.
Author information
Authors and Affiliations
Corresponding author
Ethics declarations
Conflict of interest
On behalf of all authors, the corresponding author (Ranjan Ray) states that there is no conflict of interest.
Additional information
Publisher's Note
Springer Nature remains neutral with regard to jurisdictional claims in published maps and institutional affiliations.
Appendix
Appendix
1.1 Calculation of statutory and actual average tax rates
We begin by describing the methodology behind calculating actual taxes paid at a particular percentile of tax assessees. As we have the functional form and parameter estimates for the Lorenz curve of income and taxes (see Sect. 3.4), we are able to calculate the derivative of each of the Lorenz curves via the following formula:
Denote the derivative of the Lorenz curve of income and taxes as \(L^{\prime}\left( p \right)\) and \({\Psi }^{{T^{\prime}}} \left( p \right)\), respectively. We can thus proceed to evaluate the income level \(\left( {y_{i} } \right)\) and taxes \(\left( {t_{i}^{A} } \right)\) paid at the \(p_{i}\)-th percentile of tax assessees through the following relationships:
where \(\mu_{Y}\) and \(\mu_{t}\) represent the actual average income and taxes paid amongst tax assessees.
On the other hand, to calculate the pre-deductions statutory taxes paid, we directly apply the statutory tax schedules described in Table 3 to \(y_{i}\) to calculate the statutory taxes paid at that income level (in the absence of other deductions); we denote this by \(t_{i}^{S}\).
Using these, we may then compute the average statutory and actual tax rates, denoted by \(ASTR_{i} \) and \(AATR_{i}\), respectively, corresponding to the \(p_{i}\)-th percentile as followsFootnote 30:
1.2 Calculation of progressivity and redistributive effect of statutory taxes amongst tax assessees
For ease of exposition, we begin by denoting several quantities with the following variables:
-
i.
\( \left\lfloor {b_{i} } \right\rfloor,\) \({n}_{i}\) and \({Y}_{i}\), \(i\in \left\{\mathrm{1,2},\dots ,21\right\},\) represents the lower threshold, number of tax assessees and total income reported, respectively, for each of the 21 income brackets (including the zero bracket) of the income distribution reported by the ITRS (left half of Table 2) for a particular year.
-
ii.
\({z}_{j}, j\in \left\{\mathrm{1,2},3\right\}\) represents each of the marginal tax rate income thresholds described in Table 3. \({z}_{1}\) represents the lowest threshold in a particular year (10% for FY 2011–12 to 2016–17, 5% for 2018–19), \({z}_{2}\) represents the next threshold (20%) and so on.
-
iii.
\({k}_{l}\) and \({z}_{{k}_{l}}\), \(l\in \left\{\mathrm{1,2}\right\},\) represents the surcharge rate and income threshold in which the surcharge is applied at (if applicable) described in Table 3. For FY 2011–2012 and 2012–13, \({k}_{1}={k}_{2}=1\) (no surcharge). For FY 2013–2014 to 2016–17, \({k}_{1}\) varies between 10–15% while \({z}_{{k}_{1}}\) remains at 10,000,000 across the years. For FY 2018–19, \({k}_{1}=\) 10% at \({z}_{{k}_{1}}=\mathrm{5,000,000}\) and \({k}_{2}=15\%\) at \({z}_{{k}_{2}}=\mathrm{10,000,000}\).
We can then apply the following formula to the income distribution of tax assessees reported by the ITRS (left half of Table 2) to calculate the statutory tax paid within each income bracket which we denote by \({S}_{i}\) for each of our seven periods in the absence of deductionsFootnote 31:
FY 2011–12 to 2016–17:
FY 2017–18:
To explain the intuition behind this, we provide two examples from FY2017-18 (Table 2):
-
Consider the ‘ > 400 and < = 450’ bracket. The total number of individuals (returns) in this bracket is 4,156,142, and they have reported a total of 1,764.37 \(\times \) 109 Rs. Furthermore, the first 250,000 of each of their incomes is tax free. As such, we can work out the total statutory taxes paid for this bracket by finding the total amount of taxable income of individuals in this bracket, that is, total income less tax-free income multiplied by the number of individuals, and multiplying it by the marginal tax rate of 5% (and 1.03 due to the education cess). Thus, the calculation is as follows:
$$ {\varvec{S}} = 1.03 \times 0.05 \times \left( {1,764.37 \times 10^{9} - 250,000 \times 4,156,142} \right) = 3.74 \times 10^{10} $$ -
Consider the ‘ > 2,000 and < = 2,500’ bracket. The total number of individuals (returns) in this bracket is 508,642, and they have reported a total of 1,131.43 \(\times \) 109 Rs. Furthermore, the first 250,000 of each of their incomes is tax free, and every individual faces a 5% and 20% marginal tax rate on 250,000 and 500,000 of their individual incomes, respectively. We find the remaining amount of taxable income to be subjected to a 30% tax rate through the total income less 1,000,000 (the taxes on which we have already accounted for above) multiplied by the number of individuals. Therefore, the calculation is as follows:
\({\varvec{S}} = 1.03 \times \big( 508,642\left( {0.05\left( {250,000} \right) + 0.2\left( {500,000} \right)} \right) + 0.3\big( 1,131.43 \times 10^{9} - 1,000,000 \times 508,642 \big) \big)\) The method works best when each of the ‘income bracket thresholds’ corresponds with each of the MTR thresholds. While we are fortunate to have this hold across most of the periods analysed, there is a single case where this does not hold: FY2011-2012 has a 10% MTR threshold at 180,000 income. As such, a modification must be made to estimate the total taxes paid within the ‘ > 150 and < = 200’ income bracket (corresponding to \(i=3\)). To deal with this, we estimate the proportion of individuals within the relevant income bracket that have an income above the MTR threshold (denote as \(p{r}_{3}\)) through:
where \(p_{{z_{1} }}\), \(p_{{b_{3} }}\) and \(p_{{b_{3} }}\) represent the population percentiles corresponding to the 180,000 MTR threshold, and bottom and upper income threshold for the income bracket \(3\) derived from the previously estimated Lorenz curve. One can also work out the estimated amount of income earned by this proportion of individuals through:
With these, we make a slight modification to the formula outlined in A4 to calculate this particular \(S_{3}\) (we denote as \(S_{3} ^{\prime}\)) as follows:
After calculating the statutory taxes paid within each income bracket, we then proceed to apply the methodology discussed within Sect. 3 to estimate a Lorenz Curve of Statutory Taxes and in turn compute the progressivity and redistributive effect of statutory taxes. These methods were also used in a similar fashion to evaluate the counterfactuals discussed in Sect. 5.
Rights and permissions
About this article

Cite this article
Datt, G., Ray, R. & Teh, C. Progressivity and redistributive effects of income taxes: evidence from India. Empir Econ 63, 141–178 (2022). https://doi.org/10.1007/s00181-021-02144-x
Received:
Accepted:
Published:
Issue Date:
DOI: https://doi.org/10.1007/s00181-021-02144-x