
Abstract
This study investigates the impact of combined texturing by micromachining and chemical functionalization on the wetting behavior and water condensation on stainless steel 304. The transition from Wenzel to Cassie-Baxter or impregnated Cassie-Baxter regimes is investigated. Understanding this transition is critical for advancing surface engineering, as it enables precise control over wetting behavior for various applications. Herein, we report on the wire EDM (wEDM) machining on stainless steel 304 to produce two distinct microstructure patterns with directional canals or pyramidal structure, and their performance in water condensation. These patterns significantly impact water condensation performance. wEDM is employed to create surface roughness, followed by phosphoric acid treatment and chemical functionalization with trichloro-1H,1H,2H,2H-perfluorooctyl silane. Contact angle measurements reveal a synergistic effect between groove direction and silane coating, leading to hydrophobic surfaces and dropwise water condensation. Specimens with directional canals exhibit a contact angle of 150°, while specimens with pyramidal structures exhibit 151o. Roll-off angle experiments showcased distinct behavior among specimens featuring canals or pyramidal structures. Specimens with canals exhibit notably lower roll-off angles compared to both flat surfaces and those with pyramidal patterns, leading to a dependence of roll-off angles on the orientation of canals. In humid environments, micromachined specimens exhibit superior water condensation capability compared to untreated SS304 surfaces. Chemically functionalized grooved specimens present larger condensate droplet diameters than flat surfaces. An enhancement in water condensation and a sevenfold higher latent heat transfer coefficient is reported. Specimens with chemical functionalization achieve corrosion protection with an efficiency reaching 82.9%.
1 Introduction
The manipulation of surface hydrophobicity plays a key role in many industrial applications because it promotes antifouling and surface self-cleaning [1, 2], and in applications where there is a phase change process, it promotes dropwise condensation and improves droplet mobility and a high rate of surface renewal [3, 4]. Condensation is a phase change process occurring in nature and exploited in many industrial processes [5]. In particular, the recovery of waste heat from low-temperature streams, with a flue gas temperature below 200 °C, is important since such streams are estimated to be 100.3 TWh·year−1 in the EU [6] and 259.9 TWh·year−1 in the USA [7].
Surface chemistry and topography should be appropriately tuned in order to achieve hydrophobicity. Surface topography significantly influences wetting behavior, and a combination of surface roughness and low surface energy is essential for achieving superhydrophobicity that cannot be achieved on a smooth surface [8].
The interactions between water droplets and surfaces with topography can be effectively described by the Cassie–Baxter equation [9] or by Wenzel’s equation [10]. When a liquid drop completely fills the structures beneath it, it is in the Wenzel state, while a drop sitting on a composite surface of solid and air is described by the Cassie state. The key factor governing these interactions at Cassie–Baxter mode is the solid surface fraction, denoted as Φs [9]. In contrast, in Wenzel’s equation, the dominant topographic parameter is the surface roughness, indicated as r [10]. The solid surface fraction (Φs) is the fraction of solid in contact with liquid, and surface roughness (r) is the ratio of the actual surface area to the projected area [4]. When studying hydrophobic surfaces, having a low Φs can be advantageous because it reduces the solid-liquid contact, which, in turn, can promote water repellency.
The equations that are used in order to predict the contact angle in the case of Wenzel [10] and Cassie-Baxter [9] are as follows:
Wenzel:
Cassie-Baxter:
When a rough hydrophobic surface is studied, the selection between the Wenzel and Cassie-Baxter models depends on the droplet contact angle on a smooth surface and the roughness [11]. Specifically, the critical contact angle, θcrit, is calculated with Eq. 5 and is used to predict the wetting mode [12, 13].
When θy is lower than the θcrit, the expected regime is Wenzel and impregnated Cassie–Baxter states. When θy is higher than the θcrit, then the Cassie-Baxter model is more possible [12].
The wettability in condensation environments can be divided into modes of humidity condensation, namely dropwise (DwC) and filmwise (FwC) condensation. Superhydrophilic surfaces promote filmwise condensation, resulting in the formation of a water film on the surface as condensation proceeds. This liquid film introduces an additional thermal resistance layer and reduces the condenser’s efficiency [13] by creating an unwanted thermal barrier on the metal surface. In contrast, DwC has proven to be highly efficient for heat transfer especially when accompanied by high condensate removal, yielding heat transfer coefficients significantly higher than those measured during FwC [14,15,16]. Nevertheless, the onset phenomena in DwC are still under active investigation [17]. In DwC, condensates initially form small droplets on the surface, which gradually grow through direct condensation and coalescence until they are removed by gravity, thus clearing/sweeping the heat transfer surface and enabling new droplets to form [13, 18].
Surface topography can be achieved through various methods, such as wire electric discharge machining [19,20,21,22,23], laser machining [19, 24, 25], and photolithography [4, 26]. Cao et al. [19] and Wang et al. [27] used wire EDM in order to introduce grooves on aluminum alloy and titanium alloy, respectively. They subsequently treated the surfaces with silane to achieve hydrophobicity; however, their investigation did not delve into the condensation mode. Shirsath et al. [21] studied the effect of laser and wire EDM texturing and concluded that wire EDM is capable for pillar formation, which enhance the hydrophobicity. Electrical discharge machining (EDM) is a versatile manufacturing method that uses electric discharges between a wire electrode and a conductive workpiece to precisely remove material and create intricate shapes [28, 29]. It is suitable for both mass production and precision machining, making it valuable in modern manufacturing where high-volume output and precision are needed. EDM can work with a wide range of conductive materials, including various hardness levels, and can achieve micrometer-level tolerances by adjusting parameters like wire-to-workpiece distance, voltage, and conductivity [17].
In the present study, wire electrical discharge machining was employed to engineer surface topography and fabricate two different microstructural patterns over stainless steel 304 specimens in order to compare their performance in terms of hydrophobicity and water condensation. Grooved specimens were further chemically functionalized by applying trichloro-1H,1H,2H,2H-perfluorooctyl silane via chemical gas phase deposition (CVD) at 80 °C. Such surface functionalization leads to surfaces with lower surface energy [30]. This study delves into the intricate relationship between surface hydrophobicity, achieved through the manipulation of surface chemistry and topography, and its direct impact on condensation modes, specifically in the realm of heat transfer applications. While prior studies have extensively explored the effects of surface roughness using EDM and chemistry on hydrophobicity [27, 31, 32], a notable gap remains in understanding how these factors precisely influence condensation modes, notably dropwise (DwC) and filmwise (FwC) condensation. These modes play a pivotal role in determining the efficiency of heat transfer processes [13]. Furthermore, this study evaluates the efficacy of different microstructural patterns, fabricated through wire electrical discharge machining (EDM) on stainless steel 304 specimens, in terms of both hydrophobicity and condensation behavior. Specifically, the study addresses a significant gap in current research by shedding light on the transition from the Wenzel to Cassie-Baxter state in wetting behavior. This comprehensive approach not only contributes to theoretical advancements but also holds practical implications for designing surfaces tailored to specific condensation modes, thereby driving innovations in heat transfer efficiency.
2 Materials and methods
Stainless steel 304 specimens, with dimensions of 29 mm × 29 mm × 2 mm, were engrooved using wire electrical discharge machining using a wire of circular geometry, with a nominal diameter of 0.25 mm. The wire EDM process resulted in distinct patterns in one or two planar directions, depending on the specific conditions applied. Then, the engrooved specimens were further chemically functionalized (Table 1).
The manufacturing process of electrical discharge machining for each specimen was the same and consisted of the following basic steps, as visually represented (Fig. 1):

Schematic illustration of sectional view of wire electrical discharge machining steps. Numbering indicates the steps taken to induce the surface topography. Steps 3–5 are then repeated (step 6) until the edge of the coupon to yield the final modified specimen
-
1.
Initialization: The process begins by establishing contact with the workpiece (stainless steel 304 specimen). This point of contact is where the electric discharge occurs between the wire and the workpiece.
-
2.
Setting the origin: The measured distance is recorded by the EDM machine and serves as the reference plane for the operation. The cutting depth is then defined with respect to this reference plane.
-
3.
Cutting: The wire is advanced towards the workpiece in the Y-direction as per the predefined cutting depth parameter.
-
4.
Retracting: After cutting, the wire is retracted to a safe distance to prepare for the next step.
-
5.
Moving: The wire is shifted along the perpendicular axis (either in the X- or Z-direction) as determined by the specified pitch parameter.
-
6.
Repetition: Steps 3 to 5 are iterated as necessary to achieve the desired results (Fig. 2).
Fig. 2 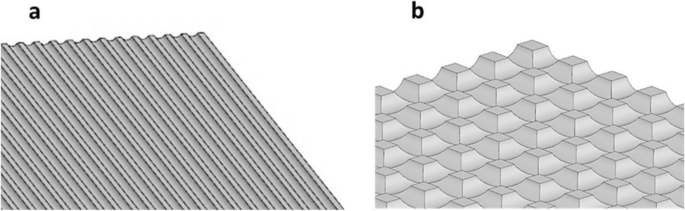
Schematic illustration of specimens resulting geometry after EDM: a one-directional canals, b pyramidal structures, following the procedure shown in Fig. 1

Various combinations of pitch, cutting depth, and current parameters yield varying results, at identical current settings and using the same material for the workpiece.
The grooved specimens were cleaned following these steps: first were rinsed with doubly distilled water and acetone, and finally oven dried at 100 °C for 20 min. The clean and dry specimens were initially treated by immersing them in 1 M H3PO4 solution for 10 min at 25 °C, followed by washing with doubly distilled water and oven drying at 100 °C for 20 min. Then, the specimens were functionalized with (trichloro-1H,1H,2H,2H-perfluorooctyl silane) 10% v/v in hexane via gas phase deposition, as described before [33, 34]. All prepared samples are listed in Table 1.
Scanning electron microscope (SEM) images were obtained with a FEI SEM QUANTA 200. The surface wettability was evaluated using a KINO SL200 KS optical contact angle meter, applying the Young-Laplace fitting method. The contact angle and the roll-off angle were measured placing different volumes of water droplets (5, 10, 15, 20, 30 µL) at room temperature. Condensation phenomena were recorded under 80% relative humidity (RH) at 30 °C in a custom-made water condensation chamber [35]. The specimen surface was maintained at 10 °C using a Peltier module. Prior to any measurement, coupons were oven dried at 100 °C for 20 min. FT-IR spectra of the coatings were recorded using a Shimadzu IR QATR 10 spectrophotometer, single reflection ATR (attenuated reflectance accessory). The electrochemical measurements, electrochemical impedance spectroscopy (EIS) and Tafel polarization, were conducted in 0.1 M H2SO4 with an AMETEK VersaStat3 Potentiostat/Galvanostat Station through a three-electrode setup. Samples with an exposed surface area of 1 cm2 were assigned as working electrode (WE), a platinum mesh as counter electrode (CE), and an aqueous Ag/AgCl (3.5 M KCl) as reference electrode (RE). Before the test, a 1-h equilibration time was allowed for each specimen exposed to the 0.1 M H2SO4. EIS measurements were conducted by applying a 10-mV sinusoidal alternate low-voltage perturbation with the frequency ranging from 105 to 0.001 Hz, 10 points per decade. The equivalent circuit was produced, using the EC-Lab software to compute the resistance and capacitance values. Potentiodynamic polarization curves were obtained at a scan rate of 0.2 mV s−1 with a scan range of −0.5 to 0.5 V vs. RE. All electrochemical tests were conducted at room temperature (25 ± 2 °C) and repeated a minimum of thrice to confirm repeatability.
3 Results and discussion
3.1 Surface characterization
3.1.1 Resulting surface pattern
The resulting surface pattern exhibits distinct characteristics for the two different specimens, SS-CAN and SS-PY. In the case of SS-CAN, the surface displays directional canals with a depth of 100 μm and a width of 270 μm, and the flat regions between adjacent canals have a width of 320 μm (Fig. 3). Conversely, for SS-PY, the surface features pyramidal structures with grooves measuring 70 mm in depth and 250 μm in width, and the flat tops of the pyramidal structures have a width of 360 μm (Fig. 4).

a, b SEM images for specimens with directional canals for SS-CAN, c microscope (5×) photos of SS-CAN, and d schematic illustration of cross-sectional view of SS-CAN

a, b, c SEM images for specimen with pyramidal structures SS-PY, d microscope (5×) photos of SS-PY, and e schematic illustration of cross-sectional view of SS-PY
The EDM is expected to lead to rough surfaces with adhered discharge etching particles [27]. The surface roughness (Ra) of the flat SS initially was 0.03 μm. After EDM on the flat surface, the roughness became equal to 0.92 μm. This means that the resulting surface of the engrooved specimens exhibits micro-roughness.
The actual surface area, peak area, and valley area were calculated using Siemens NX software (Table 2).
3.1.2 FT-IR
IR spectra of bare stainless steel 304, phosphoric acid-etched, and silane-coated coupons can be seen in Fig. 5. Although the exact assignment of all bands is difficult due to the complex nature of the silane and phosphate layer growth on stainless steel surface, comparison of the IR spectra after each step reveals the effect of H3PO4 on surface treatment and the creation of anchoring points for subsequent functionalization with PFOTS. H3PO4 treatment and subsequent silane deposition induce the appearance of some new bands in the ATR-IR spectrum. More specifically, the band at 1340 cm−1 has been assigned to the P=O stretching of surface-bound phosphate groups. Bands in the region of 950–1500 cm−1 have been reported for various stretching modes of P(OH)2 and P–O moieties [36]. C–F vibrational modes can be observed in the range of 1100–1250 cm−1, while the band at 817 cm−1 is attributed to Si–C bond stretching [37]. Several bands at high energy wavenumbers can be assigned to C–H and Fe–O–H [38] bands; other bands towards the nIR region can be assigned to Fe–O [38] species formed on the surface after H3PO4 treatment.

ATR FT-IR spectra of specimens of SS (black trace), after treatment with SS-PA (red trace), SS-PA-P (blue trace). Major bands observed at various wavenumbers are indicated with arrows showing the respective modes of vibration
3.1.3 Corrosion evaluation
In order to evaluate the corrosion protection efficiency that the silane coating provides, electrochemical measurements were performed on the flat stainless steel 304 specimen with PFOTS chemical functionalization. The potentiodynamic polarization curves of the bare stainless steel and stainless steel with silane functionalization are shown in Fig. 6. The parameters, which are obtained by the polarization curves using Eq. 6 and Eq. 7 [39], are shown in Τable 3.

Tafel curve for flat specimens SS and SS-PA-P in 0.1 M H2SO4, inset: corrosion rate for flat specimens SS and SS-PA-P in 0.1 M H2SO4
The corrosion current density (icorr.) was calculated by analyzing the Tafel regions with Versastat software. Corrosion rates (in mm y−1) were calculated using Eq. 6:
where EW is the metal equivalent weight, icorr. is the current density in µA cm−2, and d is the density in g cm−3. The EW for SS 304 is equal to 25.12 in accordance with ASTM G102 [39], and the density is equal to 7.99 g cm−3.
The corrosion protection efficiency (PE%) can be calculated from the measured icor. values using Eq. 7:
where \({i}_{corr}^{0}\) is the corrosion current of the bare metal and \({i}_{corr}\) is the corrosion current of the coated samples.
Comparison of the stainless steel 304 specimen, with the functionalized specimen with silane, SS-PA-P, reveals that icorr. has decreased and the corrosion potential (Ecorr.) has increased, which indicates that the coating provides the steel with anti-corrosive protection. Furthermore, the corrosion protection efficiency reaches 82.9%, which is a significant decrease of corrosion rate. After the surface functionalization, the corrosion rate is 3.1 × 10⁻³ mm·year−1 (Table 3), which is considered a mild corrosion for heat recovery applications [40].
Figure 7a illustrates the Nyquist diagram of the SS and SS-PA-P specimens. The distinctive semicircle shape observed in the Nyquist diagram for the SS-PA-P confirms the presence of a resisto-capacitive phenomenon, as illustrated in the proposed equivalent model shown in Fig. 7a. This equivalent circuit is known as “undamaged coating circuit” model [41]. In the case of undamaged coatings, the electrochemical response to an electrochemical impedance spectroscopy (EIS) perturbation can be effectively characterized by a resistor-capacitor circuit in series with a resistor. This circuit contains a capacitive element, 𝐶𝑐, which originates from the dielectric properties of the coating, in parallel with a resistance, R1, that corresponds with the resistivity of the coating to electrolytic conduction, which is calculated equal to 944.7 × 10³ ± 1.75 ohms cm−2. The capacitance of the coating is an important parameter to measure during coating failure [42]. The capacitance of SS-PA-P (Cc) is equal to 90.8 × 10⁻⁶ ± 8.6 × 10⁻¹² F cm−2; this value is high in comparison to most capacitance values, which tend to be in the range of 0.1 to 1 nF cm−2. This happens because the most coatings are relatively thick, and the coating capacitance is inversely proportional to thickness [42]. The resistance indicated by Rsol captures conductance losses in the solution between the reference electrode and the coating surface.

a Nyquist diagram for SS and SS-PA-P specimen, inset: equivalent electrical circuit of SS-PA-P, and b Bode diagram for SS-PA-P specimen
At a frequency of 0.001 Hz, the impedance of the SS-PA-P specimen measures equal to 784 × 103 ohms (Fig. 7b), which is near to the limit begins [43]. In contrast, the bare SS specimen exhibits an impedance of 241 × 103 ohms at the same frequency. This disparity underscores the protective effect provided by the coating, as higher impedance values at this frequency signify enhanced corrosion resistance of the material [44].
3.2 Surface wetting characteristics
3.2.1 Contact angle measurements
To evaluate the surface wetting characteristics, the roll-off angles and contact angles of water droplets were measured on the surface of each specimen. For specimens featuring directional canals (SS-CAN and SS-CAN-PA-P), the measurements were assessed in two scenarios: one with the grooves perpendicular to the observation line (Fig. 8a) and the other with the grooves oriented parallel to the observation line (Fig. 8b). In the case of pyramidal structures, the direction did not affect the measurements.

Schematic illustration of a perpendicular to the observation line view and b parallel to the observation line view, and c contact angle measurements of 10-µL water droplet
The flat specimen stainless steel is hydrophilic with a contact angle equal to 76° ± 1°. After the EDM process on the flat specimen, the contact angle becomes 92° ± 1° (Fig. 8c). Furthermore, the roughness increased from 0.03 to 0.92 μm. It is observed that the machining caused an increase in the contact angle in comparison to the flat specimen SS, but these contact angle values are close to the contact angle of the flat specimen after the EDM procedure. Furthermore, Fig. 9 (1a) demonstrates that water droplets spread within the canals. This phenomenon explains the significant difference in contact angles observed in untreated engrooved specimens, such as SS-CAN, in the perpendicular, 50° ± 2°, and parallel, 107° ± 2°, cases. The silane functionalization dramatically increased the contact angle, and also in the case of parallel grooves, the droplet is better shaped (Fig. 9 (2a)). Specifically, SS-CAN-PA-P (parallel) and SS-PY-PA-P became superhydrophobic [45], with contact angles of 150° ± 2° and 151° ± 1°, respectively. The chemically functionalized, non-grooved flat specimen, SS-PA-P, exhibits a contact angle of 120° ± 3°. The synergistic effect of surface roughness and low surface energy is imperative for achieving superhydrophobicity, as roughness induces a wetting behavior that would not be achieved otherwise [8].

a Stereoscope top view of (1) SS-CAN, (2) SS-CAN-PA-P, (3) SS-PY, and (4) SS-PY-PA-P. b Water contact angle of (1) SS-CAN perpendicular, (2) SS-CAN-PA-P perpendicular, (3) SS-PY, and (4) SS-PY-PA-P. c Water contact angle of (1) SS-CAN parallel and (2) SS-CAN-PA-P parallel
The water droplets on grooved specimens before chemical functionalization (SS-CAN, SS-PY) are in the Wenzel state, since the surface is completely wetted from water (Fig. 9 (1c) and (3b)). This was expected, because the flat surface of stainless steel after EDM and SS-EDM exhibits a contact angle equal to 92° ± 1°, which is below the critical contact angle which was calculated using Eq. 5 and was equal to 137° for SS-CAN and 149° for SS-PY (Table 4). The predicted regime for SS-PY-PA-P is Wenzel-impregnated Cassie-Baxter; however, in Fig. 9 (4b), it showed that there is air trapped inside the valleys. So, the water droplet on SS-PY-PA-P transitions into an impregnated Cassie-Baxter regime rather than being in a complete Wenzel state. This conclusion was also reported by Maghsoudi et al., who studied hierarchical superhydrophobic surfaces [12]. The transition from Wenzel to Cassie-Baxter was achieved after the functionalization with low surface free energy silane.
Bico et al. mention that the Cassie-Baxter state is considered thermodynamically stable if this condition is satisfied [46]:
where θγ is the contact angle of the flat surface, which is equal to 138°. The surface roughness and solid surface fraction were calculated using Eqs. 1 and 2 (Table 4). In the case of SS-CAN-PA-P, this condition is satisfied, indicating stable Cassie-Baxter state. In contrast, for SS-PY-PA-P, the non-fulfillment of this condition signifies the absence of thermodynamic stability in the Cassie-Baxter mode.
3.2.2 Roll-off angle measurements
Roll-off angle measurements are crucial in understanding surface wetting behavior. Determining the angle at which a droplet begins to roll off a surface provides valuable insights into its hydrophobic or hydrophilic properties.
In the case of flat stainless steel specimen (SS), with contact angles 76° ± 1° and 120° ± 3°, before and after chemical functionalization, respectively, the water droplets with volumes of 5, 10, 15, 20, and 30 µL were observed to be pinned on the surface, as illustrated in Fig. 10. When examining engrooved specimens with canals, SS-CAN and SS-CAN-PA-P, in perpendicular measurements, it was observed that droplets with a volume greater than 15 µL started sliding off (Fig. 10). Conversely, in parallel measurements to the observation line, water droplets were pinned on SS-CAN for all water droplet volume and slid on SS-CAN-PA-P when the volume exceeded 20 µL. This indicates that the direction of the canals with respect to gravity, as illustrated in Fig. 10, affects the roll-off angle, with the vertical direction resulting in a lower roll-off angle. The difference in the sliding behavior of water droplets between the different directions is because the vertical direction of the canals provides a direct path for water droplets to flow along, allowing them to navigate.

Roll-off angle measurements of all specimens for droplet volume equal to 5, 10, 15, 20, and 30 µL, and inset: graphic illustration of the specimens at perpendicular and parallel to the observation line
The pyramidal pattern exhibited different behaviors, with pinned droplets before functionalization. Upon functionalization with PFOTS, sliding of the droplets occurs at a volume as low as 15 µL. This happens because in the case of SS-PY, the surface is wetted in the Wenzel mode, and the surface inside the grooves is equal to 637 mm2, which is larger than the concave area in the case of SS-CAN. This results in a larger volume of water being confined within the valleys. Furthermore, in the case of SS-PY-PA-P, the Cassie-Baxter mode is not thermodynamically stable so this negatively affects on the roll-off angle.
3.2.3 Water condensation
Contact angle measurements offer valuable quantitative insights into surface wettability. However, for a comprehensive understanding of water condensation mechanisms on surfaces, it is essential to investigate the condensation phenomena in detail. Generally, low surface energy promotes dropwise and improves droplet mobility and rate of surface renewal [3]. However, condensation mode investigation is particularly critical because a high contact angle does not solely determine and guarantee the occurrence of dropwise condensation [35]. Del Col et al. [47] studied the condensation mode on the hydrophobic surface and they observed filmwise condensation. The effects of micromachining on water condensation mode and droplet coalescence were studied in an environment with 80% relative humidity (RH) and an ambient temperature 30 ± 2 °C.
On an untreated flat SS304 surface, a continuous liquid film (i.e., filmwise condensation) forms (Fig. 11). Conversely, hydrophobic surface functionalization with PFOTS highlights a different narrative. The engrooved specimen after the functionalization with silane, SS-CAN-PA-P, and SS-PY-PA exhibits dropwise condensation. The droplets in the case of SS-PY-PA-P and SS-CAN-PA-P are bigger in comparison to the chemically functionalized flat specimen, SS-PA-P. Specifically, the mean value of the droplet diameter at 30 min is 0.09 cm, 0.16 cm, and 0.13 cm for specimens SS-PA-P, SS-PY-PA-P, and SS-CAN-PA-P, respectively. A larger droplet diameter in the same exposure time indicates a higher mass of water that has changed phase from gas to liquid. Assuming spherical droplet shapes for SS-PA-P, SS-PY-PA-P, and SS-CAN-PA-P, the calculated condensate water masses for each droplet are 0.38 mg, 2.14 mg, and 1.15 mg, respectively. Higher water mass indicates a higher water harvest rate and higher latent heat transfer coefficient (HTC) in accordance to Eq. 8 [3].
where \(\dot{m}\) is the rate of water harvesting. As for SS-PA-P, the calculated heat transfer coefficient is 41 W m−2 K−1. In the case of SS-CAN-PA-P, the ratio of the chord of the drop in contact with the surface to the radius of the droplet is determined to be 0.56. Figure 9 (2c) illustrates that the surface conforms to the Cassie-Baxter model, with only the peaks being wetted. Consequently, the wetted surface area of each droplet may be estimated as low as 4.7 10−7 m2, and as a result, the HTC is equal to 170 W m−2 K−1. In the case of SS-PY-PA-P, the ratio of the chord of the drop in contact with the surface to the radius of the sphere is calculated which is equal to 0.58. Figure 3 (2c) indicates that the droplet is at impregnated Cassie-Baxter state. Accordingly, the wetted surface area is approx. 5.2 10−7 m2, and the calculated HTC is equal to 284 W m−2 K−1. Nagar et al. [3] using similar condensation setup reported that inducing hierarchical structures over aluminum plates can achieve HTC equal to 50 W m−2 K−1, whereas bare aluminum had HTC, less than 40 W m−2 K−1, when ΔT is 8 °C. These findings underscore that surface topography enhances the heat transfer features. In the present case, micromachining in combination with chemical functionalization over stainless steel 304 had, as a result, a significant enhancement, almost by a factor of 7, thus reaching thermal properties of superior alloys but prone to corrosion and thermal oxidation.

Water condensation on SS, SS-PA-P, SS-PY-PA-P, and SS-CAN-PA-P specimens for 0, 5, 10, 30, and 60 min exposure in environment with 80% relative humidity (RH) and ambient temperature 30 ± 2 °C
4 Conclusion
In conclusion, the combined effects of micromachining and chemical functionalization triggered a transition from Wenzel to Cassie-Baxter or impregnated Cassie-Baxter regimes. Initially, the engrooved specimens exhibited complete wetting in the Wenzel mode. However, following the low-energy surface silane treatment, the contact angles increased, shifting the regime to Cassie-Baxter for specimens with directional canals and to impregnated Cassie-Baxter for those with pyramidal patterns.
There was a different behavior observed between the specimens with canals and pyramidal pattern in the roll-off angle experiments. The specimens with the canals exhibit lower roll-off angles in comparison to flat specimens and specimens with pyramidal pattern. Furthermore, the direction of the canals also affects roll-off angles, with vertically oriented canals resulting in lower roll-off angles; this observation was also mentioned by Yoshimitsu et al. [31].
In a high-humidity environment, the micromachined surfaces demonstrated improved water condensation compared to untreated flat SS304 surfaces. Furthermore, it was observed that in the case of engrooved chemical functionalized specimens, droplets with higher diameter in comparison to flat specimens were observed. The latter induces a remarkable effect on the water condensation and up to seven times higher latent heat transfer coefficient.
References
Wang H, Wang Q, Huo L et al (2023) High-efficient laser-based bionic surface structuring for enhanced surface functionalization and self-cleaning effect. Surf Interfaces 37:102691. https://doi.org/10.1016/j.surfin.2023.102691
Sotoudeh F, Mousavi SM, Karimi N et al (2023) Natural and synthetic superhydrophobic surfaces: a review of the fundamentals, structures, and applications. Alexandria Eng J 68:587–609. https://doi.org/10.1016/j.aej.2023.01.058
Nagar A, Kumar R, Srikrishnarka P et al (2021) Scalable drop-to-film condensation on a nanostructured hierarchical surface for enhanced humidity harvesting. ACS Appl Nano Mater 4:1540–1550. https://doi.org/10.1021/acsanm.0c03032
Lo C-C, Chen L-J (2022) Dropwise condensation on single-micro-scale roughness hydrophobic surfaces. Surf Interfaces 33:102281. https://doi.org/10.1016/j.surfin.2022.102281
Cho H, Preston D, Zhu Y, Wang E (2016) Nanoengineered materials for liquid–vapour phase-change heat transfer. Nat Reviews Mater 2:16092. https://doi.org/10.1038/natrevmats.2016.92
Papapetrou M, Kosmadakis G, Cipollina A et al (2018) Industrial waste heat: estimation of the technically available resource in the EU per industrial sector, temperature level and country. Appl Therm Eng 138:207–216. https://doi.org/10.1016/j.applthermaleng.2018.04.043
Johnson I, Choate WT, Davidson A (2008) Waste heat recovery. Technology and Opportunities in U.S. Industry. United States
Quéré D (2008) Wetting and roughness. Annu Rev Mater Res 38:71–99. https://doi.org/10.1146/annurev.matsci.38.060407.132434
Cassie ABD, Baxter S (1944) Wettability of porous surfaces. Trans Faraday Soc 40:546–551. https://doi.org/10.1039/TF9444000546
Wenzel RN (1936) Resistance of solid surfaces to wetting by water. Ind Eng Chem 28:988–994. https://doi.org/10.1021/ie50320a024
Adera S, Naworski L, Davitt A et al (2021) Enhanced condensation heat transfer using porous silica inverse opal coatings on copper tubes. Sci Rep 11:10675. https://doi.org/10.1038/s41598-021-90015-x
Maghsoudi K, Momen G, Jafari R (2023) The thermodynamic stability of the Cassie–Baxter regime determined by the geometric parameters of hierarchical superhydrophobic surfaces. Appl Mater Today 34:101893. https://doi.org/10.1016/j.apmt.2023.101893
Goswami A, Pillai SC, McGranaghan G (2021) Surface modifications to enhance dropwise condensation. Surf Interfaces 25:101143. https://doi.org/10.1016/j.surfin.2021.101143
Vourdas N, Jouhara H, Tassou SA, Stathopoulos VN (2019) Design criteria for coatings in next generation condensing economizers. Energy Procedia 161:412–420. https://doi.org/10.1016/j.egypro.2019.02.095
Ahlers M, Buck-Emden A, Bart H-J (2019) Is dropwise condensation feasible? A review on surface modifications for continuous dropwise condensation and a profitability analysis. J Adv Res 16:1–13. https://doi.org/10.1016/j.jare.2018.11.004
Liang X, Kumar V, Ahmadi F, Zhu Y (2022) Manipulation of droplets and bubbles for thermal applications. Droplet 1:80–91. https://doi.org/10.1002/dro2.21
Zhang S, Zhou J, Hu G et al (2023) Process characteristics of electrochemical discharge machining and hybrid methods: a review. Int J Adv Manuf Technol 129:1933–1963. https://doi.org/10.1007/s00170-023-12452-4
Wang X, Xu B, Chen Z et al (2022) Review of droplet dynamics and dropwise condensation enhancement: theory, experiments and applications. Adv Colloid Interface Sci 305:102684. https://doi.org/10.1016/j.cis.2022.102684
Cao D, Ji S, Zhao J et al (2022) Design and superhydrophobic performance analysis of the rectangular-groove microstructure coated by nanocoatings. Mater Chem Phys 291:126539. https://doi.org/10.1016/j.matchemphys.2022.126539
Ouyang L, Liu J, Xiao Y et al (2022) One-step preparation of a superhydrophobic surface by electric discharge machining with a carbon fiber brush electrode. Langmuir 38:9853–9862. https://doi.org/10.1021/acs.langmuir.2c00916
Shirsath GB, Muralidhar K, Pala RGS, Ramkumar J (2019) Condensation of water vapor underneath an inclined hydrophobic textured surface machined by laser and electric discharge. Appl Surf Sci 484:999–1009. https://doi.org/10.1016/j.apsusc.2019.04.076
Prakash V, Priyadarshni N, Das AK, Chattopadhyay S (2022) Fabrication of hydrophobic surface on Ti6Al4V by WEDM process for surgical instruments and bioimplants. Int J Adv Manuf Technol 118:1111–1123. https://doi.org/10.1007/s00170-021-07857-y
Li Z, Li W, Xun M, Yuan M (2023) WEDM one-step preparation of miniature heat sink with superhydrophobic and efficient heat transfer performance. Int J Adv Manuf Technol 127:1873–1885. https://doi.org/10.1007/s00170-023-11679-5
Cai Y, Chang W, Luo X et al (2018) Superhydrophobic structures on 316L stainless steel surfaces machined by nanosecond pulsed laser. Precis Eng 52:266–275. https://doi.org/10.1016/j.precisioneng.2018.01.004
Chen Z, Yang J, Liu H et al (2022) A short review on functionalized metallic surfaces by ultrafast laser micromachining. Int J Adv Manuf Technol 119:6919–6948. https://doi.org/10.1007/s00170-021-08560-8
Rykaczewski K, Paxson AT, Anand S et al (2013) Multimode multidrop serial coalescence effects during condensation on hierarchical superhydrophobic surfaces. Langmuir 29:881–891. https://doi.org/10.1021/la304264g
Wang M, Peng Z, Li C et al (2022) Multi-scale structure and directional hydrophobicity of titanium alloy surface using electrical discharge. Micromachines 13(6):937. https://doi.org/10.3390/mi13060937
Nafi MA, Jahan MP (2023) Functional surface generation by EDM—a review. Micromachines 14(1):115. https://doi.org/10.3390/mi14010115
Shen D, Ming W, Ren X et al (2021) Progress in non-traditional processing for fabricating superhydrophobic surfaces. Micromachines 12(9):1003. https://doi.org/10.3390/mi12091003
Stamatopoulos C, Milionis A, Ackerl N et al (2020) Droplet self-propulsion on superhydrophobic microtracks. ACS Nano 14:12895–12904. https://doi.org/10.1021/acsnano.0c03849
Yoshimitsu Z, Nakajima A, Watanabe T, Hashimoto K (2002) Effects of Surface structure on the hydrophobicity and sliding behavior of Water droplets. Langmuir 18:5818–5822. https://doi.org/10.1021/la020088p
Zhang Q, Wang Y, Qin Z et al (2023) Study on surface fabrication and drag reduction performances of gradient hydrophobic aluminum alloy. Opt Laser Technol 163:109379. https://doi.org/10.1016/j.optlastec.2023.109379
Nanou P, Konstantaras J, Zarkadoulas A et al (2023) Development and evaluation of corrosion resistance and hydrophobic properties of thermal sprayed coatings over carbon steel. Key Eng Mater 963:27–36. https://doi.org/10.4028/p-sth09H
Nanou P, Zarkadoulas A, Pandis P et al (2023) Micromachining on stainless steel 304 for improved water condensation properties. Key Eng Mater 962:19–26. https://doi.org/10.4028/p-FwZKv7
Nanou P, Konstantaras J, Zarkadoulas A et al (2023) Construction, evaluation, and performance of a water condensation test unit. Adv Sci Technol 133:35–43
Ben Salah M, Sabot R, Refait P et al (2015) Passivation behaviour of stainless steel (UNS N-08028) in industrial or simplified phosphoric acid solutions at different temperatures. Corros Sci 99:320–332. https://doi.org/10.1016/j.corsci.2015.07.025
Dowling DP, Nwankire CE, Riihimäki M et al (2010) Evaluation of the anti-fouling properties of nm thick atmospheric plasma deposited coatings. Surf Coat Technol 205:1544–1551. https://doi.org/10.1016/j.surfcoat.2010.10.010
Hwang S, Umar A, Dar G et al (2014) Synthesis and characterization of iron oxide nanoparticles for phenyl hydrazine sensor applications. Sens Lett 12:97–101
ASTM International (2004) ASTM G102-89. Calculation of Corrosion Rates and Related Information from Electrochemical measurements. ASTM West Conshohocken, PA
Bahadori A (2017) Chap. 15 - corrosion in pipelines and piping systems. In: Bahadori A (ed) Oil and gas pipelines and piping systems. Gulf Professional Publishing, Boston, pp 395–481
Policastro SA, Anderson RM, Hangarter CM et al (2023) Incorporating physics-based models into equivalent circuit analysis of EIS data from organic coatings. Coatings 13. https://doi.org/10.3390/coatings13071285
Loveday D, Peterspm P, Rodgers B (2004) Evaluation of organic coatings with electrochemical impedance spectroscopy - part 2: application of EIS to coatings. JCT CoatingsTech 1:88–93
Gray LGS, Appleman BR (2003) EIS electrochemical impedance spectroscopy - a tool to predict remaining coating life? J Protective Coat Linings 20:66–74
Wang L, Wang X, Liu T et al (2023) Bio-inspired self-healing and anti-corrosion waterborne polyurethane coatings based on highly oriented graphene oxide. Npj Mater Degrad 7:96. https://doi.org/10.1038/s41529-023-00415-9
Wei Y, Wang F, Guo Z (2023) Bio-inspired and metal-derived superwetting surfaces: function, stability and applications. Adv Colloid Interface Sci 314:102879. https://doi.org/10.1016/j.cis.2023.102879
Bico J, Thiele U, Quéré D (2002) Wetting of textured surfaces. Colloids Surf a 206:41–46. https://doi.org/10.1016/S0927-7757(02)00061-4
Del Col D, Parin R, Bisetto A et al (2017) Film condensation of steam flowing on a hydrophobic surface. Int J Heat Mass Transf 107:307–318. https://doi.org/10.1016/j.ijheatmasstransfer.2016.10.092
Funding
Open access funding provided by HEAL-Link Greece. This research has been co-financed by the European Regional Development Fund of the European Union and Greek national funds through the Operational Program Competitiveness, Entrepreneurship and Innovation, under the call “Special Actions AQUACULTURE – INDUSTRIAL MATERIALS – OPEN INNOVATION IN CULTURE” (project code: T6YBP-00350 and T6YBP00483).
Author information
Authors and Affiliations
Contributions
All authors contributed to the study as follows: conception and design by PN, AZ, NV, NO, and VS. Material preparation, data collection, and analysis were performed by PN, AZ, PP, and VS and specimens texturing by IT, IK, and DA. The first draft of the manuscript was written by PN and AZ. All authors commented on previous versions of the manuscript. All authors read and approved the final manuscript.
Corresponding author
Ethics declarations
Competing interests
The authors declare no competing interests.
Additional information
Publisher’s Note
Springer Nature remains neutral with regard to jurisdictional claims in published maps and institutional affiliations.
Rights and permissions
Open Access This article is licensed under a Creative Commons Attribution 4.0 International License, which permits use, sharing, adaptation, distribution and reproduction in any medium or format, as long as you give appropriate credit to the original author(s) and the source, provide a link to the Creative Commons licence, and indicate if changes were made. The images or other third party material in this article are included in the article's Creative Commons licence, unless indicated otherwise in a credit line to the material. If material is not included in the article's Creative Commons licence and your intended use is not permitted by statutory regulation or exceeds the permitted use, you will need to obtain permission directly from the copyright holder. To view a copy of this licence, visit http://creativecommons.org/licenses/by/4.0/.
About this article

Cite this article
Nanou, P., Zarkadoulas, A., Pandis, P.K. et al. Inducing hydrophobicity in stainless steel 304 by mechanical texturing and chemical functionalization. Int J Adv Manuf Technol (2024). https://doi.org/10.1007/s00170-024-13701-w
Received:
Accepted:
Published:
DOI: https://doi.org/10.1007/s00170-024-13701-w