
Abstract
Laser powder bed fusion (L-PBF) is an additive manufacturing technique that provides an opportunity to create complex NdFeB magnets, potentially enhancing their performance. L-PBF possesses its own processing challenges, such as porosity/cracks and thermal stresses due to rapid cooling. This study focused on optimizing the parameters and the use of elevated temperature (300–550 °C) powder bed heating to reduce defect generation. This paper includes a detailed process parameter investigation, which revealed samples with a maximum energy product, (BH)max, of 81 kJ/m3 (remanence, Br 0.72 T; coercivity, Hci 891 kA/m) without post/pretreatment, which are the highest (BH)max and Br for L-PBF-processed NdFeB commercial powder. It was observed that all the high-magnetism samples possessed high density, but not all the high-density samples possessed high magnetism. The SEM images and discussions are academically valuable since they clearly illustrate grain formation and morphology in the melt pool, areas where the literature provides limited discussion. Furthermore, this paper incorporates quantitative phase analyses, revealing that the magnetic properties increase with increasing volume fraction of the strong magnetic phase Nd2Fe14B. Another significant contribution of this paper is that it is the first study to investigate the effect of heated bed on L-PBF-NdFeB alloys. The density of the samples and Br can be improved with the use of elevated powder bed heating, while the Hc decreases. The (BH)max can also be improved from 55 to 84 kJ/m3 through elevated powder bed heating. The maximum magnetic properties obtained with the heated bed (400 °C) were as follows: Br, 0.76 T; Hci, 750 kA/m; and (BH)max, 84 kJ/m3.
1 Introduction
NdFeB magnets are among the most commonly used permanent magnets and are commonly found within electric motors. Due to their high coercivity Hc, high remanence Br, and high energy product (BH)max, they are therefore highly desirable for use within electric motor applications [1] and can retain their magnetism for long periods of time. However, eddy currents occur in the magnetic core during the operation of magnetic devices, which can cause a temperature increase within the magnet, subsequently reducing its magnetic performance [2, 3]. Due to the low Curie temperature of NdFeB magnets, they are sensitive to eddy currents; isolated-segmented permanent magnets are designed to avoid/reduce eddy current losses by decreasing the eddy current path with isolation layers [4]. With the use of more complex shaped magnets, efficient cooling channels can be integrated to reduce temperature build-up and prevent unnecessary eddy current losses within the magnet [5]. In addition to cooling channels, the enhancement of magnet efficiency is achievable through shape design, wherein the geometric configuration significantly impacts magnetic properties. Specialized designs have been developed to optimize key features such as magnetic field strength and distribution. The overall shape and dimensions of a magnet play a crucial role in influencing its magnetic strength. For instance, manipulating the length of a magnet while maintaining a constant cross-sectional area can result in an improved magnetic field. In pursuit of intricate magnet designs, research has been conducted analyzing four distinct shapes: fan-shaped, arc-shaped, ring-shaped, and a self-proposed electromagnet. The findings indicated that arc-shaped magnets exhibited the highest field intensity, measuring 0.6 Tesla [6]. Similarly, other research revealed that triangular magnets outperform trapezoidal or skewed-shaped counterparts in terms of the induced electromotive force and output power in axial flux permanent magnet synchronous generators [7]. Additionally, investigations have demonstrated a 50% increase in motor output power with V-shaped magnets, with the potential for further enhancements using curved-shaped magnets [8].
There are a number of production methods capable of manufacturing NdFeB magnets, and the most common are sintering, hot deformation, and injection molding [9]. However, with these conventional manufacturing techniques, it can be challenging to produce complex/intricate-shaped NdFeB magnets. The most common production method for NdFeB magnets is sintering. It is a powder metallurgy-based process involving powder blending, compaction, subsequent sintering in a furnace, machining, and surface treatment and magnetization [10]. In contrast, additive manufacturing (AM) is a layer-by-layer additive process in which a magnet is built from powder or wire feedstock. With its slower cooling rates, sintering leads to larger grain sizes in the final magnet, while AM, with higher cooling rates, produces finer grain sizes [8] that may impact magnetic properties[11]. In terms of complexity, sintering is limited due to traditional molding and pressing methods, whereas AM allows for intricate and complex geometries. Sintering generates material waste through machining processes for final shapes, while AM generally produces less waste as the material is selectively deposited. Additionally, in sintering, magnetization typically occurs after the process, exposing the magnet to a strong external magnetic field [10, 12, 13]. In AM, magnetization can be integrated into the process or performed afterward. On the other hand, injection molding (IM) is the most widespread method for producing polymer-bonded magnets. Although the injection molding (IM) technique enables the production of complex designs, polymers are mixed within these injection-molded NdFeB magnets, subsequently reducing their magnetic performance [14, 15]. Machining can also be used as an option for integrating complexity within a component’s geometry; however, this approach is not viable due to the brittle structure of NdFeB.
Additive manufacturing (AM) presents an opportunity to create complex geometries from various feedstocks. Fused deposition modeling (FDM) [16], big area additive manufacturing (BAAM) [17], binder jetting [18], and powder bed fusion [19,20,21,22] are AM techniques that have thus far been used for the processing of NdFeB. With polymer-based AM techniques (e.g., binder jetting) for the indirect production of NdFeB components, low magnetic properties are generated due to the inclusion of polymers within the feedstock, reducing the volume fraction of the magnetic structure and creating porosity within the component after the curing of the polymer binder. Previous results have shown that the density of binder jetted magnets is nearly half that of sintered magnets, 3.54 g/cm3 [18] and 7.5 g/cm3 (Arnold Magnetic Tech), respectively. Additionally, when the binder jetted magnet is compared with conventional polymer-based magnets, compression-bonded magnets, and IM magnets, the remanence of the binder jetted magnets is lower than that of both the IM and compression-bonded magnets (binder jet magnet, 0.3 T; IM magnet, 0.5 T; compression-bonded magnets, 0.65 T) [14]. FDM produces parts with a lower density than IM and sintered magnets; the density percentage of the FDM sample is 3.57 g/cm3 while that of the IM sample is 4.35 g/cm3 [16] and that of the sintered magnet is 7.5 g/cm3. The remanence of the FDM-printed sample is 0.31 T [16], that of the IM sample is 0.38 T [16], and that of the sintered magnet is 1.2 T (by Arnold Magnetic Tech). The magnetic properties of the parts produced using BAAM are greater than those of the parts produced using the IM magnet by a narrow margin but still less than those of the sintered magnets (BAAM magnet Br = 0.51 T, IM magnet Br = 0.48 T [17], sintered magnet Br = 1.2 T by Arnold Magnetic Tech).
Direct processing of NdFeB without the need for a binder can be achieved using powder bed AM techniques that employ a high-energy scanning source to selectively melt the powder. This scanning source can either be a laser or an electron beam; however, there is a risk of smoking using an electron, meaning that electron beams charge the powder and displace it from the powder bed. This may not only affect the melting quality but also elevate the powder within the build chamber, which can damage the electron melting system [23]. Many powders, including Ti–Al [24], Inconel alloys [25], and the rare earth permanent magnet Mn-Al [26], are at risk of smoking. Hence, the powder needs to be preheated and sintered before fully melting with an electron beam, inhibiting powder jumping [24,25,26,27].
Alternatively, lasers can be used to process the material within the powder bed using L-PBF. The laser powder bed fusion processing parameters for NdFeB powder were investigated, and it was found that high-density parts (with a relative density of up to 86%) can be obtained by the energy line (laser power W/laser speed mm/s) between 0.032 and 0.048 W/mm [28]. Various L-PBF scan parameters, such as the laser power (LP), laser focus (LF), point distance (PD), exposure time (ET), and hatch distance (HD), and their effects on the properties of processed NdFeB parts were studied by [29]. During processing, the samples were built on a steel substrate plate that was connected to a larger copper substrate. The copper substrate acted as a heat sink during laser-generated heat buildup within the powder bed and built platform. The results show that the grain sizes within the samples were reduced to 1 µm, which is smaller than those produced using commercial sintered magnets. It was found that high cooling rates are essential for obtaining a Nd2Fe14B phase and fine grains that also increase coercivity. The maximum properties achieved were Hci, 695 kA m−1; Br, 0.59 T; and (BH)max, 45 kJm−3. The density of the produced magnet was 7 g/cm3, which is 92% of the theoretical density [29]. Moreover, it was suggested that the processing window for NdFeB is narrow and that a small change in laser power can cause destabilization of the melt track. In addition, the powder layer thickness must be adequate to achieve a high relative density of the samples [21]. Bittner et al. had been able to generate some of the highest magnetic properties using L-PBF with a coercivity of 886 kA/m, a remanence of 0.63 T, and a density of up to 90%. Stable processing was achieved with an energy density between 0.6 and 2.3 J/mm2 [19].
Moreover, magnetic properties can be enhanced by element intergranular addition, which is one of the methods used to improve the coercivity of sintered magnets [30,31,32,33,34]. An intergranular addition of a low melting point eutectic alloy (Pr0.5Nd0.5)3 (Cu0.25Co0.75) was used for SLM-produced NdFeB. The results show that the coercivity of the samples improves with the presence of a low-melting paramagnetic alloy between the Nd2Fe14B phase grains [35]. On the other hand, heat treatment is a post-processing method known to enhance the coercivity of sintered magnets [36, 37], and it has been reported that it increases the magnetic properties of SLM-NdFeB-printed magnets as well [38] (where the samples were printed with “sintered magnet alloy” and “near-stoichiometric alloy” powders, which were specifically prepared for this study). Furthermore, the use of a copper-rich NdFeB alloy has been found to improve the coercivity of SLM-ed magnets [39]. The highest coercivity of SLM NdFeB magnets was reported in this study, with the help of heat treatment. The double scanning technique is another method for improving density and magnetic properties by reducing voids and cracks. The results indicate that the second scan with half laser power after a full power scan does not cause undesirable phase formation [40] On one side, laser powder bed fusion (LPBF) systems equipped with single and three-beam lasers were employed to produce NdFeB components. This study investigated various process parameters, including the type of laser (pulsed or continuous wave), and their impact on magnetic properties. Utilizing the synchronized three-beam method with a two-zone scanning strategy resulted in an increase in the maximum magnetic energy product of 33.42 kJ/m.3. Furthermore, the processing time substantially decreased by 38% compared to that of the single-beam method [41].
On the one hand, a specific real-life application of laser powder bed fused (L-BPF) NdFeB magnets has not yet been extensively documented in the literature. However, the adoption of L-PBF for NdFeB magnets is an area of ongoing research and development. It is known that permanent magnets, such as NdFeB, can be incorporated into the rotor to create a magnetic field [1] Hence, the potential applications of L-PBF-produced NdFeB magnets include electric motors. The use of NdFeB magnets with cooling channels [8] could be one of the potential uses of L-PBF-produced NdFeB in electric motor applications. AM has the potential for the integration of magnets into rotor structures with precise alignment, contributing to improved magnetic flux and motor efficiency. It is well known that customized designs and the ability to optimize the distribution of magnetic materials by AM enhance the performance of motors [42].
Additionally, it has been reported that AM methods are more cost-effective than traditional methods, particularly for small-batch production. The production volume is a significant independent factor, while customization and complexity are considered interchangeable in terms of their impact [43]. More specific studies indicate that magnets produced using Big Area Additive Manufacturing (BAAM) exhibit superior cost-effectiveness compared to injection-molded magnets, with comparable or even enhanced performance [44]. However, there is a lack of specific cost-effectiveness studies on laser powder bed–fused NdFeB magnets. Nevertheless, considering the known advantages of AM technology, such as design complexity without additional tool or machining costs and minimal material waste, it is anticipated that L-PBF holds potential as a cost-effective method for producing NdFeB magnets.
Table 1 compares the magnetic properties of AM and the sintered magnets. L-PBF-processed NdFeB is superior to polymer-based AM techniques in terms of density and magnetic properties, while it is inferior to sintered magnets. Increasing the volume fraction of magnetic powder (f) may improve the magnetic properties since the energy product, (BH)max, is proportional to f2 [18].
The origin of the high remanence of the NdFeB magnet is the highly anisotropic 2:14:1 tetragonal phase (in this case, Nd2Fe14B), called the hard magnetic phase and represented by θ. This phase has a high saturation magnetization and anisotropy constant, which results in high magnetization. To obtain the optimum magnetic performance, fine and homogenously distributed Nd2Fe14B phases surrounded by an amorphous phase, which isolates adjacent grains and ensures high coercivity, are needed [45]. Therefore, it is important to develop optimum AM processing conditions to attain this desired microstructure. In this study, L-PBF was used to process NdFeB powder, and the main objective is to improve the density of L-PBF-printed magnets, reduce defects, and understand the effect of density and pre-heating on magnetic properties.
Preheating and rescanning reportedly reduce residual stresses in L-PBF processing of standard alloys (e.g., 316 L stainless steel [50] and Ti6Al4V [51]); thus, the use of pre-heating is examined in this paper. The expectation is that a reduction in cracks and porosity within NdFeB samples can be achieved by reducing thermal stresses, with the potential to alter and improve magnetic properties.
2 Materials and methods
This study used a commercial NdFeB powder with a spherical morphology sourced from Magnequench (MQP-S-11–9-20,001). Powders were L-PBF processed using an Aconity Mini (for preliminary experimentation) and an Aconity Lab (for elevated temperature powder bed heating). Both systems use a 200-W continuous-mode laser with a 1070 nm wavelength and 50 µm and 80 µm laser spot sizes. Cubic samples (10 × 10 × 10 mm) were processed under a purged argon atmosphere (maintaining oxygen levels below 200 ppm). For the powder bed heat experiments, the samples were processed using the Aconity Lab L-PBF system. Powder bed temperatures were set between 300 and 550 °C in 50 °C increments with oxygen levels below 50 ppm. The temperatures of the powder bed were checked using a gun pyrometer. The densities of the samples were analyzed using the Archimedes density test in water. The morphology of the grains was analyzed using a Nikon optical microscope after etching using nital to reveal the grain boundaries. Phase analysis was performed using an XRD system, PANalytical X’Pert3 (reflection). The magnetic properties were tested using a Helmholtz coil-fluxmeter and a permeameter by Arnold Magnetic Technologies. The internal porosity analysis was performed using a Micro CT (Nikon Metrology XTH 225/320 LC). SEM analysis was performed using Inspect F and Inspect F50.
2.1 Powder characterization
Commercial magnetic NdFeB powder (MQP-S-11–9-20,001) possessed particle sizes of d10 = 20.1 µm, d50 = 41.1 µm, and d90 = 70.3 µm (measured using a Mastersizer 3000 laser diffraction analyzer). Figure 1 shows the powder morphology, and Table 2 shows the composition of the powder.
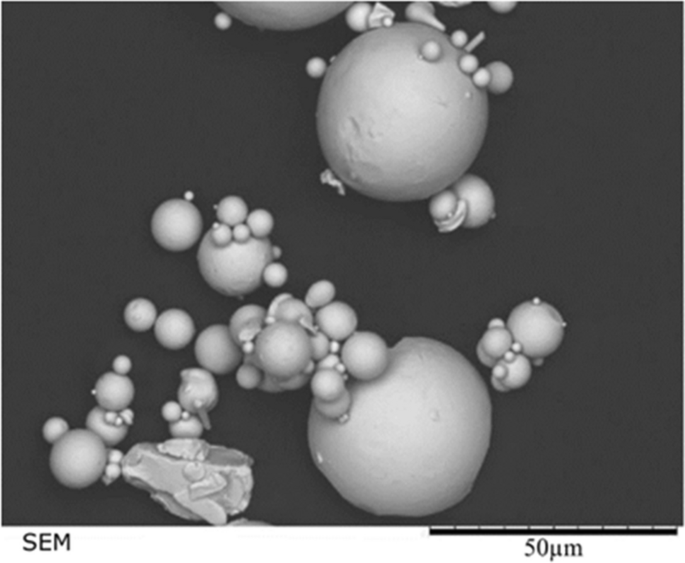
SEM image of the NdFeB powder MQP-S-11–9-20,001
2.2 Experimental parameters
In this study, the L-PBF parameters laser power (LP), laser speed (LS), hatch distance (HD), layer thickness (LT), and energy density (ED = LP/(LS*HD*LT)) were studied and optimized to attain high-density defect-free components. The experimental setup comprises two stages. The primary objective of the first stage is to identify relatively safe combinations of laser power and laser speed and, subsequently, safe EL while keeping the LT and HD fixed. This approach is taken before delving into more detailed process parameters. The intention is to establish a foundational understanding in stage 1 before progressing to more comprehensive analyses in stage 2.
In the first stage, the processing parameters were set based on published papers by Urban et al. [46] and Kolb et al. [28]. The former paper identified that samples with laser power (LP) ranging from 40 to 55 W and laser speed (LS) from 1200 to 2000 mm/s exhibited higher magnetic polarization, with a LT and HD of 20 µm. Furthermore, their density results indicated that a laser power within the range of 40–55 W and a laser speed between 1000 and 3000 mm/s resulted in relatively high densities. Higher laser powers up to 90 W were also investigated. Consequently, for the initial stage of the experiment, it was decided to set the laser speed between 1000 and 3000 mm/s and the laser power from 40 to 100 W, with a fixed LT of 20 µm, as per the published paper. The HD was fixed at 30 µm due to early experimental failures observed with the combination of 20 µm LT and 20 µm HD. All combinations of first-stage process parameters set with LP between 40 and 100 W; LS between 1000 and 3000 mm/s; LT, 20 µm; and HD, 30 µm are detailed in the Appendix. On the other hand, the latter paper indicated that an energy density (EL), calculated as LP/LS, between 0.03 and 0.05 Ws/mm [28] yielded the highest relative density. Therefore, only process parameters within this EL range were utilized in the first stage, as shown in the Appendix.
In the second stage, the parameter design was based on the outcomes of the first stage. In this stage, experiments were broadened to investigate the effect of HD, in addition to investigating the effect of higher laser powers up to 200 W and wider laser speed range from 1500 to 5500 mm/s, in addition to a wider energy density range of 20–130 J/mm3.
A summary of the printing parameters is shown in Table 3.
3 Results and discussion
3.1 Preliminary experiment, first stage
There was no successful printing below a laser power of 60 W, as shown in Fig. 2a (samples 1 to 5). It is assumed that the low laser power (below 60 W) was insufficient to melt the NdFeB powder. Interestingly, the failed samples from 1 to 5 (LP, 40–50 W) in Fig. 2a have the same ED as the successfully printed samples near them. Despite all the EDs being between 50 and 83 J/mm3, the only successful printing was obtained with an LP of 60 W and above. Additionally, the damage of the samples (samples 6 to 9) is due to the failure of nearby samples. This is because the broken pieces and layers from the failed samples (samples 1 to 5) are carried onto these samples by a wiper during powder layer deposition. Sample 6 and sample 8 were repositioned and reprinted successfully, as shown in Fig. 2b.

Processed samples using Aconity mini, LP a samples 1–2; 40 W; samples 3–5, 50 W; samples 6–9, 60 W; samples 10–13, 70 W; samples 14–15, 80 W; b sample 16, 80 W; samples 19–22, 90 W; samples 24–26, 100 W. ED 50–83 J/mm.3, scan parameters can be seen in Table 4 (red arrows indicate defects) (samples 17–18–20 and sample 23 were not printed due to software errors)
Some defects are observed on the corners and the bottom of the samples (shown by the red arrows in Fig. 2a). It is possible that the temperature differences between the cold building platform and the hot melted powder cause thermal stresses and subsequently cause these defects and cracks on the bottom of the samples. As the printing progresses, the new layers are melted on the previously melted hot layer. The temperature differences between the layers decrease as the building progresses, reducing the thermal stresses on the top part of the samples. Table 4 shows the detailed process parameters for the samples produced in Fig. 2. The process window is LP from 40 to 100 W in 10-W increments, HD 30 µm and LT 20 µm.
Figure 3a shows that the density of the samples increases with increasing laser energy density. The highest density was achieved using 100 W, 95.72%, sample 24, while sample 6 had approximately the same energy density as sample 24 but used 60 W LP, generating a 91.52% sample density. Both of these samples are indicated with red circles in Fig. 3a, and their micro CT scan is shown in Fig. 4. It can be seen that the higher LP samples have higher densities than the lower LP samples in the same energy density range. Another important aspect worth noting is the pronounced effect of laser power on the part density. Varying the laser power affects the minimum energy density required for achieving 91% dense NdFeB L-PBF parts. Figure 3a illustrates an inverse relationship between LP and the minimum ED needed for the effective melting of NdFeB powder in the L-PBF process. At 60 W LP, a minimum ED of 80 J/mm3 is needed, whereas at 80 W LP, the minimum ED required to achieve 91% dense parts decreases to 59 J/mm3. This suggests that the laser power has a more significant impact on NdFeB melting in the laser powder bed fusion process. The processing quality is more likely dependent on the laser power; however, increasing the ED also increases the density of the samples, as shown in Fig. 3a. Figure 3b shows a similar trend for the magnetic remanence values. Higher remanence values were achieved using higher laser powers. The maximum Br, 0.658 T, was obtained using 100 W (sample 24, red circle in Fig. 3b), while the Br value of sample 6 is 0.591 T, red circle in Fig. 3b. Sample 6 was processed using 60 W of LP and contains more lack of fusion (LoF) porosities than sample 24 (as shown in Fig. 4a and b), while their HD and LT remain the same (the energy densities are nearly the same, 74 J/mm3 and 80 J/mm3). These LoF porosities reduce the percentage of magnetic structure in the components and hence reduce the Br. Additionally, two main phases were detected in sample 6 and sample 24, namely soft magnetic α-Fe and hard magnetic Nd2Fe14B, as shown in Fig. 4c. It is assumed that the greater amount of the a-Fe phase in sample 6 reduces the Br content by reducing the volume percentage of the hard magnetic phase and because of the soft magnetic structure of α-Fe [29]. The greater amount of the a-Fe phase and the lower amount of the Nd2Fe14B phase in sample 6 are likely due to the low LP/LS ratio, which causes lower cooling rates.

a Relationship between the energy density, sample density, and laser power; b relationship between sample density, remanence, and laser power

Micro-CT images; a sample 24, LP 100 W–ED 74 J/mm3 and b sample 6, LP 60 W–ED 80 J/mm3, side view of the samples; c XRD patterns of printed samples 6 and 24, where the blue arrow points to the α-Fe phase
The first stage of the experiments was used to narrow the process parameter window to reduce the risk of failure and to control the effect of the laser power and laser speed on both the density and magnetic properties. In the second stage, the process parameter window was widened based on the preliminary results.
3.2 Effect of laser power and energy density on sample density
As the laser power increases to 100 W, the density increases, as identified within the preliminary experiments. However, further investigations on the laser power show that the density of the samples starts to decrease after 120–130 W despite the energy densities being within the same range as those of the lower laser power samples, as shown in Fig. 5. The reason for this reduction in sample density may be the result of the higher scan speeds. The combination of high laser speed and high laser power generates unstable melt pools that result in low-density samples. It is also worth noting that increasing the laser power above 130 W may cause excessive laser energy exposure, causing overheating of the powder and the creation of keyholes within the melt pool; hence, the sample density decreases.
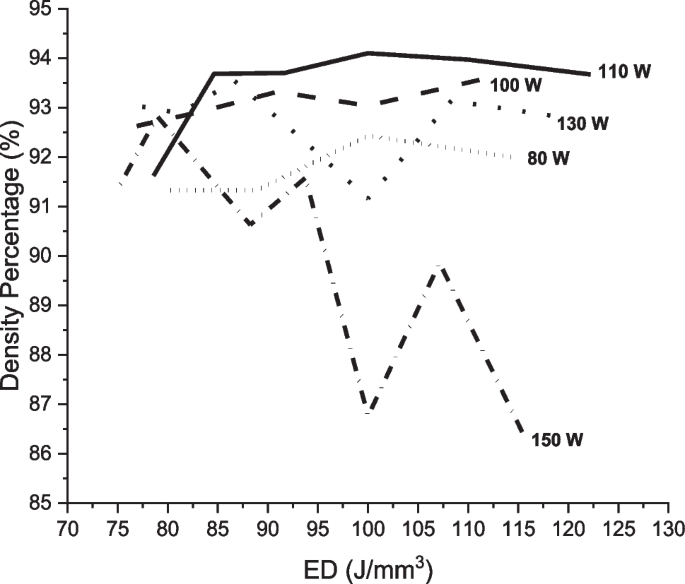
Relationships between the ED and density of the samples with various laser powers (80–150 W, HD 20 µm–LT 20 µm)
The laser speed should be low enough to allow sufficient melting and powder consolidation, and the laser power should be high enough to melt the powder but needs to be low enough to avoid overheating the powder. In this study, the successful laser power range is defined between 60 and 130 W, based on the results in Figs. 2 and 5.
Moreover, no sample could be produced above 125 J/mm3 due to the excessive energy density causing material evaporation. High energy densities created keyholes within the melt pool, creating extremely brittle samples. It is essential to maintain the energy density below the maximum critical ED value, 125 J/mm3, to avoid keyhole pores. In addition, high EDs cause higher residual stresses within the sample [30, 31, 52, 53] The combination of tensile stresses occurs on top of the samples due to the material shrinkage caused by rapid cooling, and the compressive stresses on the bottom of the sample [34, 54] cause cracks [47] and consequently material delamination. It is essential to maintain the energy density below the critical ED value (in this study, 125 J/mm3) to reduce cracks, delamination, partial distortion [47], and keyhole pores. However, it is also necessary to generate sufficient energy density to prevent a lack of fusion porosity.
Figure 6a shows that the high-density sample (95.72%) uses an ED 74 J/mm3 while Fig. 6b shows the lack of fusion pores in the low ED sample (ED 50 J/mm3, sample density percentage 88.37%). Additionally, the very high LP/fast LS combination (200 W/5500 mm/s) negatively impacts the geometric integrity of the sample, as shown in Fig. 7a and b.
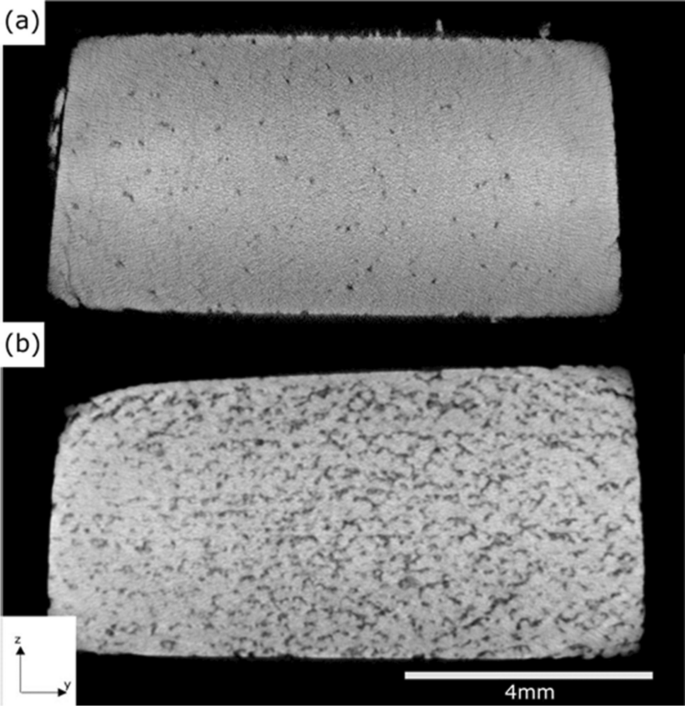
Micro-CT scans of a sample 74 J/mm3 (100 W, 2250 mm/s, 95.72%) and b sample 50 J/mm.3 (90 W, 3000 mm/s, 88.37%)

a 90.9 J/mm3 (200 W, 5500 mm/s, 20 µm HD 20 µm LT) and b 92.85 J/mm3 (140 W, 3500 mm/s, 20 µm HD, 20 µm LT), sample size 10 mm × 10 mm × 10 mm
3.3 Magnetic test results/relationship between density and remanence
The densities of the 78 samples plotted with respect to LP from 70 to 200 W and LS from 1500 to 5000 mm/s are shown in Fig. 8a. Since the energy density takes into account four independent process parameters \((ED=LP/(LS*HD*LT),\) the HD and LT were kept constant. The red areas represent regions of high density within the samples. The results show that the maximum obtained density was 7.066 g/cm3, which is 94%, based on the theoretical density of NdFeB magnets, which is 7.5 g/cm3. Furthermore, the remanence values of 57 of the 78 samples were tested by a Helmholtz coil and fluxmeter, and the results are plotted in Fig. 8b. The arrows in Fig. 8b show the direction of increasing scan speed; consequently, the solidification process is faster, resulting in higher remanences. The results correspond to published results by J. Jaćimović et al. [29]. Generally, the remanence increases as the sample density increases, as shown in Fig. 8c. All the high magnetic samples have a high density; however, not all the high density samples are highly magnetic. Figure 8d shows that higher Br values are obtained for ELs between 0.03 and 0.04 W/mm with EDs between 75 and 100 J/mm3. The Br value decreases to 0.03 T by increasing EL to 0.05 Ws/mm and ED to 125 J/mm3. It is concluded that the magnetic properties are related not only to the density of the samples but also to the cooling rate. The following section will discuss in more detail the analysis of the specific parameter contributions to the phases and magnetic properties.

a The Archimedes density results of the samples as a function of the laser speed and laser power; b the remanence of the samples, tested by a Helmholtz coil and fluxmeter, as a function of the laser speed and laser; c the dependence of the remanence on the density percentage of the samples; d the dependence of the remanence on the energy density, where the red line is the 0.04 Ws/mm EL, (HD, 20 µm and LT, 20 µm)
3.4 Relationship between the phase and magnetic properties
The maximum energy product, (BH)max, is one of the essential magnetic properties used to evaluate the performance of permanent magnetic materials. It is the maximum BH value in the second quadrant of the hysteresis loop [35]. Thus, the remanence, Br, needs to be considered to improve the magnetic performance. In our case, the XRD analyses show that the remanence, Br, increases as the volume fraction of the Nd2Fe14B phase increases, as shown in Fig. 9a. The reason for this increase is the high saturation magnetization of the Nd2Fe14B phase, which improves the remanence [55]. Coercivity is the resistance to demagnetization of the magnet, and thus, it is the other important magnetic property to assign to high-performance magnets [56]. High magnetocrystalline anisotropy is one of the requirements for high coercivity. Low magnetocrystalline anisotropy is observed in high-symmetry systems, such as Fe, which means that there are many easy axes in the structure, and magnetic domains are easily aligned in many different directions by an external field. However, in less symmetrical systems with high magnetocrystalline anisotropy, such as the tetragonal Nd2Fe14B phase, there are only two axes whose domains can easily align. In this phase, more energy is needed to change the domain structure. Therefore, magnetic domain motion is restricted, preventing decoupling between domains, which improves coercivity [55]. Graph b in Fig. 9 shows the increase in the intrinsic coercivity, Hci, value with increasing volume fraction of the Nd2Fe14B phase, possibly resulting from the high magnetocrystalline anisotropy of the Nd2Fe14B phase. There is a clear increasing trend in the Br value with increasing volume fraction of the Nd2Fe14B phase, as shown in Fig. 9a, while there is a decreasing trend in the Br and Hci values with increasing volume fraction of the α‒Fe phase, as shown in Fig. 9c and d. This decrease is because the magnetically soft α-Fe phase reduces the amount of the hard magnetic phase, Nd2Fe14B, and reduces the remanence. Furthermore, since α-Fe is a soft magnetic phase and easily demagnetized, it acts as the center of reversed magnetic domains, lowering the coercivity [29].

Relationships between a the volume fractions of Nd2Fe14B and Br; b the volume fractions of Nd2Fe14B and Hci; c the volume fractions of α-Fe and Br; and d the volume fractions of α-Fe and Hci
The smaller the residual sum of squares is, the better the fit of the data, and the greater the residual sum of squares is, the poorer the fit of the data. The errors of Hci/a-Fe and Hci/Nd2Fe14B are high. Even for the generally decreasing intrinsic coercivity trend observed with increasing a-Fe phase and decreasing Nd2Fe14B phase, the relationships between these phases are not linear. Therefore, it is confirmed that Hci is related not only to the phase but also to the microstructure [21]. On the other hand, even though the fitting is greater in the Br/Nd2Fe14B and Br/a-Fe graphs, the error values are not 0. This is possibly due to the cracks and porosities within them, which affect the amount of magnetic phase Nd2Fe14B in the samples.
3.5 Relationship between the phase/laser power and the phase/laser speed
The relationship between the laser power and magnetic properties was investigated for the LP samples from 100 to 180 W with 10-W increments, LS 3500 mm/s, HD 20 µm, LT 20 µm. The results are shown in Fig. 10. The maximum Br value, 0.74 T, was obtained at LP 130 W, and the highest Hc value, 737 kA/m, was obtained at LP 120 W. The decrease in Br and Hci values after 130 W and 120 W, respectively, is similar to that found in the reduction in density of the samples after 120–130 W. The reason behind the decrease in Br and Hci is the decreasing density of the samples due to the high EL, which produces an unstable melt pool in the powder bed. The samples with a 140-W laser power have EL = 0.04 Ws/mm and ED = 100 J/mm3, and the samples having higher laser powers than 140 W result in higher EL and ED values, which reduces Br, which supports the results in Fig. 8d. The trends in the laser power Br and laser power Hci graphs are related to the volume fraction of the Nd2Fe14B and α-Fe phases. The increase in Br is directly proportional to the increasing volume fraction of the Nd2Fe14B phase and decreasing α-Fe phase, as shown in Fig. 10.

Relationships between the LP, Br, and Hci volume fractions of Nd2Fe14B and α-Fe, LS 3500 mm/s, LT 20 µm, and HD 20 µm
Figure 11 shows the effect of laser speed on the Br value. Br improves from 0.389 T to 0.622 T with a decrease in LS from 3250 to 2000 mm/s. An increase in LS was expected to improve the Br value since it increases the cooling rate. However, it was noted that the ED is very low and not capable of fully melting the powder. Low EDs cause poor fusion; hence, there is a lack of fusion porosity [47]. In Fig. 11, Br improves from 0.389 to 0.622 T by decreasing the laser speed due to the increase in ED from 38 to 62 J/mm3. It is also observed that the EL is above 0.04 Ws/mm for the samples with higher Br, 0.52 T, and above. However, they are not negatively affected by the high EL rates, which was expected based on the previously discussed result in Fig. 8d. This is because the HD of the samples plotted in Fig. 11 is 40 μm, while it is 20 μm for the samples plotted in Fig. 8d. A high HD causes poor melting characteristics and hence requires a slower scan speed, causing a higher EL to be able to melt the powder.
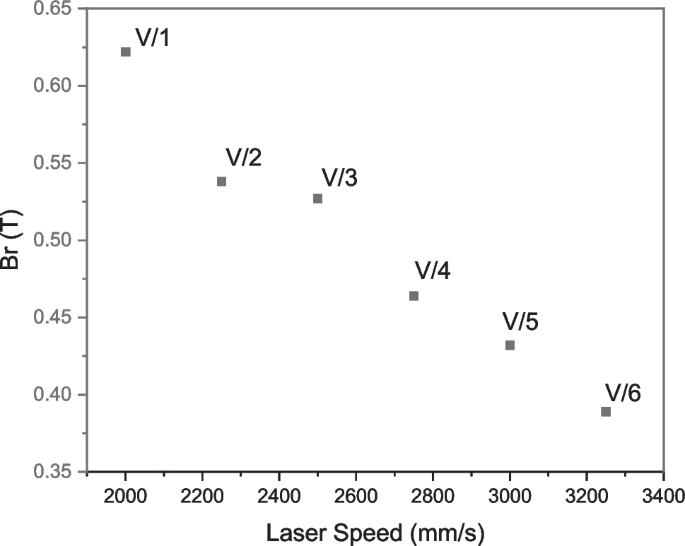
Br and density of the sample with respect to laser speed, HD 40 µm and LT 20 µm, taken by a Helmholtz coil and fluxmeter
It was found that the volume fraction of the Nd2Fe14B phase is 92% in sample V/3-Br 0.527 T; 90% in sample V/5-Br 0.432 T; and 88.12% in sample V/6-Br 0.389 T, while the volume fractions of a-Fe is 5.28%, 8.08%, and 10.63%, respectively. The greater amount of the Nd2Fe14B phase in the high-Br samples is shown in the XRD patterns in Fig. 12. It is known that a high Br content mainly originates from the hard phase [21]. The density of the samples fluctuates between 90.53 and 93.33%. The maximum Br sample also has the maximum density of 93.33%. The parameters of the analyzed samples are shown in Table 5. LP was kept constant at 100 W, LS was set from 2000 to 3250 mm/s, HD was 40 µm, and LT was 20 µm.

XRD pattern of sample V/1-V/3-V/4-V/5, which is plotted in Fig. 11
3.6 Heated bed
The temperature on the build platform was measured using a thermocouple to ascertain the actual temperature on the build platform before being subjected to the heated bed printing.
The temperature difference between the system (data collected from the thermocouple fitted under the heated bed) and the temperature on the build platform (data collected by the thermocouple connected on the build platform, which is placed on the heated bed) was measured. The thermocouple measurement results are plotted in Fig. 13a. The difference is small, between 10 and 100 °C, until 380 °C, after which it increases to 160 °C until cooling starts at 75 min.
It was then decided to use a heated bed with low temperatures of 200 °C and 400 °C with the following process parameters: 130 W LP 3500 mm/s, LS 20 µm, LT 30 µm HD to investigate how the system works without compromising the samples at high temperatures. Both temperature trials failed due to the extremely brittle samples being created and due to the incomplete fusion/attachment of the sample to the build platform. The temperatures of the samples were checked using a gun pyrometer. The temperature of the printed sample at 200 °C (thermocouple temperature in the system) was 400 °C (checked by gun pyrometer), and the temperature of the sample processed at 400 °C (thermocouple temperature in the system) was 600 °C (checked by gun pyrometer). Pyrometer measurements were taken from the surface of the samples. Figure 13b shows the temperature differences between the sample and the system temperature in detail. The temperature difference between the sample and the system was 100 °C at a 380 °C system temperature; then the temperature difference increased to 280 °C by increasing the system temperature to 580 °C. It was concluded that the temperature difference increases with increasing set/system temperature and cannot be fully relied upon.

a Build platform temperature vs. time versus software temperature vs. time; b sample temperature vs. time versus software temperature vs. time
The excessive heat within the build platform, generated in combination with the heated bed and laser, made it difficult to produce samples because the first couple of layers did not attach to the build platform. A possible explanation for this may be due to material evaporation caused by excessive heating. The other possibility is that rapid cooling, especially if the bed temperature is too high, can lead to quick and uneven contraction. This can result in stress within the material and affect adhesion to the build platform. It was therefore decided to turn off the heater during the first half of the build to ensure that the samples attached to the platform consistently and did not break due to the powder deposition wiper movement. The heater was then turned on for the second half of the build. The entire building consisted of 335 layers, and the heated bed was turned on at layer 185. A gun pyrometer was used to check the temperature of the samples in the closed chamber after the end of each heated bed trial.
The selected bed temperatures for the subsequent experiments were initially intended to range from 480 to 880 °C, following the heat treatment temperatures for NdFeB magnets in the literature [37]. However, the temperatures in our study were set between 300 and 550 °C with 50 °C increments since the prior heated bed investigation showed that the sample temperatures were far above the software temperatures: 480 °C for the 380 °C software temperature, 650 °C for the 480 °C software temperature, and 780 °C and 860 °C for the 580 °C software temperature, as presented in Fig. 13b.
3.7 Effect of the heated bed on the density and magnetic properties of the samples
The heated bed improved the density of the samples from 90 to over 96%. Despite this improvement in density, there is no increasing trend between the rising bed temperature and the sample density. The average density of the samples is 93.93% at 300 °C, 96.66% at 350 °C, 93.80% at 400 °C, 94.60% at 450 °C, 96.4% at 500 °C, and 96.3% at 550 °C (Fig. 14). The fluctuations in the densities of the three samples at every bed temperature from 300 to 550 °C are likely related to the instability of the building platform. Figure 15 shows the printed samples at 300 °C and 500 °C. It is deduced that the delamination near the top surfaces and the corners indicated by the red arrows are related to the faster cooling rates on the top of the samples. Printing at higher bed temperatures, such as 550 °C, may introduce greater thermal stress during cooling. The rapid cooling rate or thermal contraction at this temperature could lead to delamination, particularly at the top layers. In contrast, a lower bed temperature, such as 300 °C, may provide a more gradual cooling process, reducing the risk of thermal stress-induced delamination.

Relationship between the bed temperature and sample density; the red points are the average density of the samples

Heated bed-printed samples; bed temperatures at a 300 ℃ (410 ℃); b 500 ℃; and c 500 ℃. The temperatures in the parentheses were checked with a gun pyrometer after the printing finished (sample size: 10 mm × 10 mm × 10 mm); the red arrows point to the cracks and delamination
A clear improvement is observed in the density of the samples produced with the heated bed, as shown in Fig. 16a. Despite the Br increments not following the density increment trend, the heated bed improves the Br and (BH)max values, as shown in Fig. 16a and b. Br increases from 0.61 to 0.76 T, while (BH)max increases from 55 to 84 kJ/m3. Moreover, there is a trend in the (BH)max. Despite the fluctuations in the Br and Hc values, the (BH)max decreases as the heated bed temperature increases from 400 to 550 °C. Regardless of the decreasing trend in the (BH)max, it is still superior to that of the room-temperature-printed sample. In contrast, the Hc value drops dramatically with the heated bed, from 1000 to below 850 kA/m, as shown in Fig. 16b. In summary, the increasing heated bed temperature shows no trend in either the Br or Hc values, while (BH)max decreases with increasing heated bed temperature. It is concluded that the heated bed increases the density of the sample, hence increasing the remanence by increasing the percentage of the magnetic content in the entire structure. The heated bed decreases the cooling rate, which is expected to result in a lower percentage of the θ phase in the samples. However, Fig. 16a shows improvements in the Br values; hence, it is concluded that the effect of density improvement is greater than the effect of lower cooling rates on Br. Even though the heated bed reduces the cooling rates with extra energy input from bed heating, the cooling rates are still much higher than the cooling rate required for the θ phase.

Relationships between a the density percentage of the sample and the heated bed temperature; Br and heated bed temperature; b (BH)max and heated bed temperature; Hci and heated bed temperature. Magnetic tests were performed with a permeameter from Arnold Magnetic Technologies (RT, room temperature proceed sample)
3.8 Microstructural evaluation of heated bed printing
The microstructures of the heated bed samples are different from those of the room-temperature samples. The grain morphology in the room-temperature samples is more globular than that in the heated bed samples, as shown in Fig. 17. In comparison, the dendritic grains observed in the heated bed samples are mostly oriented in the direction of the building, as shown in Fig. 17a, b, and c. The decrease in the intrinsic coercivity of the heated bed samples may be related to dendritic grain formation. The lower cooling rates of the heated bed cause in situ heat treatment during and after the build, allowing grains to grow larger, while high cooling rates in the room temperature process result in finer grains. It is known that the smaller grains increase the coercivity [14, 22], and it is known from the literature that homogenously distributed grains are needed to improve coercivity [57]. In addition, irregularly shaped grains and grain boundaries also reduce the coercivity [55]. Thus, it can be deduced that the dendritic grains and the larger grains in the heated bed samples could be the reason for the decrease in intrinsic coercivity within the samples when using the heated bed. However, Br improved with the use of the heated bed, possibly due to the lower porosity in the heated bed samples.

SEM images of the heated bed-printed samples a at 400 °C, b at 450 °C, and c at 500 °C; d the RT-printed sample; the red arrows indicate the z-axis build direction
The microstructural evolution of the NdFeB-heated bed-printed sample is complicated due to the different cooling rates in the melt pool zone (MPZ) and the heat-affected zone (HAZ). Two different grain morphologies were observed in the MPZ and HAZ. Figure 18 shows the top view of the sample at 400 °C. The grains in the MPZ are more spherical and smaller than those in the HAZ. Since the grains in the HAZ were exposed to heat from the previously scanned powder, they had more time to grow. Hence, grain sizes gradually decrease from the bottom of the MPZ to the top of the MPZ, as shown in Fig. 18d.

SEM micrographs of the L-PBF-heated bed-printed samples at 400 °C-top view a laser scan tracks of the microstructure; b melt pool zone (MPZ) and heat-affected zone (HAZ); c a closer look at the HAZ; and d coarse and fine grain areas in the MPZ; red arrows indicate the z-axis
Figure 19 shows the cross-section of the 400 ℃ sample. The melt pool lines can be seen in Figs. 19a and b. A closer look at the HAZ and MPZ shows that equiaxed grains are observed in the MPZ, while columnar grains are observed in the HAZ/melt pool line, as shown in Fig. 19c and d, respectively.

SEM micrographs of L-PBF-heated bed-printed samples at 400 ℃ cross-section: a melt pool lines; b closer evaluation at the melt pool line (HAZ) and melt pool zone (MPZ); c fine grains in the MPZ; and d closer evaluation at the HAZ
In the samples produced at 400 °C, columnar dendritic grains are observed only at the melt pool line (HAZ), and globular and equiaxed grains are observed in the MPZ. A different microstructure is observed in the 500 °C–printed samples. The higher temperatures cause the columnar dendritic grains to be not only in the melt pool line but also in the melt pool zones since the heat-affected area expands into the melt pool zone, as shown in Fig. 20a and b. The grains in the MPZs are mostly columnar dendrites, where they narrow and cross each other and cause slower cooling rates, which allows for dendritic growth. However, there are still globular/equiaxed grains in the middle of the larger MPZ where the cooling rates are faster, as shown in Fig. 20 c and d.

SEM micrographs of L-PBF heated bed samples at 500 ℃ cross-section: a laser scan tracks/melt pool lines on the sample; b closer view of the overlapped melt pool zones (MPZ); c middle of the MPZ with finer grains; and d closer view of the HAZ and MPZ
4 Conclusions
-
In this study, L-PBF processing conditions were studied with the aim of optimizing the component density and observing the resultant magnetic properties of NdFeB magnets.
-
There are defects in the samples, mainly on the sample edges and at the bottom of the samples near the build platform. These defects may result from the temperature differences between the build platform and the hot melted powder above them. The temperature difference between the layers decreases as the build progresses, reducing the thermal stresses on the top of the samples.
-
A high laser power/high laser scan speed combination of 100 W/3000 mm/s created higher sample density and remanence values than a low laser power/low laser scan speed combination of 60 W/1250 mm/s, both of which resulted in nearly the same energy density. It is concluded that the printing quality is more likely dependent on the laser power; however, increasing the energy density also increases the density of the samples. The greater amount of α-Fe phases detected in the low laser power/low laser scan speed combination can be attributed to the low Br, in addition to the increased lack of fusion pores within them. In addition, it is essential to maintain the laser power above 50 W to melt the powder.
-
The density of the samples increases with increasing laser power up to 120–130 W and then starts to decrease. It is essential to set a high enough energy density value to melt the powder well. However, it is also essential not to exceed the critical energy density to avoid material boiling and excessive keyhole formation during printing. Therefore, one of the key points in obtaining high-density samples is to maintain the energy density below a critical energy density value. In this study, the critical energy density was 125 J/mm3.
-
Improving the sample density is not the only concern when trying to maximize magnetic performance; there is no linear relationship between the remanence and the density. All the high-magnetism samples had high density, but not all the high-density samples had high magnetism. It can therefore be concluded that the cooling rates, hence the phases and the microstructure, are vital considerations when trying to understand the generated magnetic properties. The energy line (laser power/laser scan speed) is another important parameter that needs to be considered. This study revealed that an energy line between 0.03 and 0.04 Ws/mm resulted in a higher remanence. In contrast, the remanence tends to decrease with increasing energy to 0.05 Ws/mm. It was found that the higher Br samples were obtained with energy lines between 0.03 and 0.04 Ws/mm and with energy densities between 75 and 100 J/mm3, while the Br values decreased with increasing energy lines to 0.05 Ws/mm and energy densities to 125 J/mm3. It is also concluded that the high-Br samples are a result of faster scans.
-
The magnetic properties are highly dependent on Nd2Fe14B, which is a strong magnetic phase and a magnetically soft α-Fe phase. A higher magnetic phase (Nd2Fe14B) was detected in the samples with higher Br and Hci values. In contrast, the lower α-Fe phase found in the samples has higher Br and Hci values.
-
Up to 95.72% dense samples were obtained with an energy density below 100 J/mm3 and an energy line between 0.028 and 0.45 Ws/mm.
-
The maximum properties obtained by parameter optimization are Br 0.72 T and BHmax 81 kJ/mm3. These are the highest properties obtained in the published literature to date with MQP-S-11–9-20,001 by L-PBF without postprocessing or element doping.
-
The density percentage of the samples improved with the use of the heated bed (increasing from 90 to 96%). However, no linear relationship is observed within the elevated bed temperature range and density increase. The instability of the heated bed is one of the reasons for fluctuations in the density of the samples.
-
The remanence of the samples increased with the heated bed, while the intrinsic coercivity decreased. The former is related to the sample density increase and possibly a higher θ phase, and the latter is related to the larger and more dendritic grains in the heated bed samples. Br is related to the θ phase in the samples, while intrinsic coercivity is related to the phase distribution and homogeneity and the composition of the grain boundary phases. The non-uniform and irregular Nd-rich phase reduces the coercivity.
-
In this paper, while changes in grain morphology and their impact on coercivity were partially elucidated through SEM images of heated bed samples, a comprehensive investigation, including EBSD analyses, would significantly enhance the understanding of the influence of laser parameters on grain morphology [58, 59]. A more in-depth analysis, encompassing aspects such as grain size, grain shape, orientation, and the consequential alterations in magnetic properties, is a good recommendation for future studies. Exploring the grain texture of LPBF-produced NdFeB and its correlation with magnetic properties would contribute valuable insights to the evolving field of additive manufacturing of NdFeB magnets.
-
It was observed that the dendritic-shaped grains are larger and greater in number in the high-temperature-heated bed samples due to their slower cooling rates.
-
The maximum properties obtained by the heated bed are as follows: Br, 0.76 T; Hci, 750 kA/m; and (BH)max, 84 kJ/m3 at 400 °C.
-
Systematic experiments with variations in bed temperature and relevant printing parameters are needed to determine the optimal temperature range for effective layer adhesion and minimal delamination on top of the samples while achieving the desired magnetic properties.
-
L-PBF processing of NdFeB powder is highly sensitive and challenging due to the rapid cooling rates generated during this process. The magnetic properties can be improved by optimizing the process parameters and through the use of a heated bed. However, the magnetic properties of these materials are still lower than those of their conventionally sintered counterparts, which are approximately Br 1–1.3 T and Hci 870–2700 kA/m (data taken from Arnold Magnetic Technologies).
Data availability
The data that support the findings of this study are available from the corresponding author, Kübra Genç, upon reasonable request.
References
Rahman MA (1993) Modern electric motors in electronic world IECON Proceedings (Industrial Electronics Conference) 2:644-648. https://doi.org/10.1109/iecon.1993.339004
Yoshida K, Hita Y, Kesamaru K (2000) Eddy-current loss analysis in PM of surface-mounted-PM SM for electric vehicles. IEEE Trans Magn 36(4 PART 1):1936–1940. https://doi.org/10.1109/20.877826
Hu Y, Zhu S, Liu C (2017) Magnet eddy-current loss analysis of interior PM machines for electric vehicle application. IEEE Trans Magn 53(11):1–4. https://doi.org/10.1109/TMAG.2017.2700850
Wang XWX, Li JLJ, PSP Song (2006) Design optimization and eddy current losses analysis of permanent magnets in PMSM. 2006 12th Biennial IEEE Conference on Electromagnetic Field Computation, vol. 38, no. 2, p. 4244, https://doi.org/10.1109/CEFC-06.2006.1632979
Yin H, Huang S, Li H (2018) Study on the influence of internal water cooling system on the loss of permanent magnet synchronous motor. AIP Conf Proc 1971. https://doi.org/10.1063/1.5041185
Srinivas K, Murtaza Q, Aggarwal AK (2019) Effect of shape of magnet on the machining of workpiece. Int J Recent Technol Eng 8(2 Special Issue 11):2909–2913. https://doi.org/10.35940/ijrte.B1367.0982S1119
Amin S, Madanzadeh S, Khan S, Bukhari SSH, Akhtar F, Ro JS (2022) Effect of the magnet shape on the performance of coreless axial flux permanent magnet synchronous generator. Electr Eng 104(2):959–968. https://doi.org/10.1007/s00202-021-01338-x
Jaćimović J et al (2017) Net shape 3D printed NdFeB permanent magnet. Adv Eng Mater 19(8):1–7. https://doi.org/10.1002/adem.201700098
Brown D, Ma BM, Chen Z (2002) Developments in the processing and properties of NdFeb-type permanent magnets. J Magn Magn Mater 248(3):432–440. https://doi.org/10.1016/S0304-8853(02)00334-7
Access O (2011) The preparation of sintered NdFeB magnet with high-coercivity and high temperature-stability The preparation of sintered NdFeB magnet high-coercivity and high temperature-stability, https://doi.org/10.1088/1742-6596/266/1/012052
Li WF, Ohkubo T, Hono K, Sagawa M (2009) The origin of coercivity decrease in fine grained Nd-Fe-B sintered magnets. J Magn Magn Mater 321(8):1100–1105. https://doi.org/10.1016/j.jmmm.2008.10.032
Oono N, Sagawa M, Kasada R, Matsui H, Kimura A (2011) Production of thick high-performance sintered neodymium magnets by grain boundary diffusion treatment with dysprosium-nickel-aluminum alloy. J Magn Magn Mater 323(3–4):297–300. https://doi.org/10.1016/j.jmmm.2010.09.021
Lee MW, Bae KH, Lee SR, Kim HJ, Jang TS (2017) Microstructure and magnetic properties of NdFeB sintered magnets diffusion-treated with Cu/Al mixed DyCo alloy-powder. Arch Metall Mater 62(2):1263–1266. https://doi.org/10.1515/amm-2017-0189
Paranthaman MP et al (2016) Binder jetting : a novel NdFeB bonded magnet fabrication process. 68(7):1978–1982. https://doi.org/10.1007/s11837-016-1883-4
Brown DN (2016) Fabrication, processing technologies, and new advances for RE-Fe-B magnets. IEEE Trans Magn 52(7):1–9. https://doi.org/10.1109/TMAG.2016.2535482
Huber C et al (2016) 3D print of polymer bonded rare-earth magnets, and 3D magnetic field scanning with an end-user 3D printer. Appl Phys Lett 109(16). https://doi.org/10.1063/1.4964856
Li L et al (2016) Big area additive manufacturing of high performance bonded NdFeB magnets. Sci Rep 6:1–7. https://doi.org/10.1038/srep36212
Li L, Post B, Kunc V, Elliott AM, Paranthaman MP (2017) Additive manufacturing of near-net-shape bonded magnets: prospects and challenges. Scr Mater 135:100–104. https://doi.org/10.1016/j.scriptamat.2016.12.035
Bittner F, Thielsch J, Drossel WG (2020) Laser powder bed fusion of Nd–Fe–B permanent magnets. Prog Addit Manuf 5(1):3–9. https://doi.org/10.1007/s40964-020-00117-7
Urban N, Meyer A, Kreitlein S, Leicht F, Franke J (2017) Efficient near net-shape production of high energy rare earth magnets by laser beam melting. Appl Mech Mater 871:137–144. https://doi.org/10.4028/www.scientific.net/amm.871.137
Skalon M et al (2019) Influence of melt-pool stability in 3D printing of NdFeB magnets on density and magnetic properties. Materials 13(1):139. https://doi.org/10.3390/ma13010139
Jacimovic J, Christen T, Dénervaud E (2020) Self-organized giant magnetic structures via additive manufacturing in NdFeB permanent magnets. Addit Manuf 34(May):101288. https://doi.org/10.1016/j.addma.2020.101288
Popov V, Koptyug A, Radulov I, Maccari F, Muller G (2018) Prospects of additive manufacturing of rare-earth and non-rare-earth permanent magnets. Procedia Manuf 21(2017):100–108. https://doi.org/10.1016/j.promfg.2018.02.199
Cordero ZC, Meyer HM, Nandwana P, Dehoff RR (2017) Powder bed charging during electron-beam additive manufacturing. Acta Mater 124:437–445. https://doi.org/10.1016/j.actamat.2016.11.012
Zhao X, Dadbakhsh S, Rashid A (2021) Contouring strategies to improve the tensile properties and quality of EBM printed Inconel 625 parts. J Manuf Process 62:418–429. https://doi.org/10.1016/j.jmapro.2020.12.007
Radulov IA et al (2019) Production of net-shape Mn-Al permanent magnets by electron beam melting. Addit Manuf 30:100787. https://doi.org/10.1016/j.addma.2019.100787
Jonner CJ et al (2019) High-quality, high-speed EBM 3D printing by the integration of high-performance electron sources. EBMPerform, no. 666788, pp 1–18. https://ec.europa.eu/research/participants/documents/downloadPublic?documentIds=080166e5cab4848b&appId=PPGMS
Kolb T et al (2016) Laser Beam Melting of NdFeB for the production of rare-earth magnets,” 2016 6th International Electric Drives Production Conference, EDPC 2016 - Proceedings, pp. 34–40. https://doi.org/10.1109/EDPC.2016.7851311
Jaćimović J et al (2017) Net shape 3D printed NdFeB permanent magnet. Adv Eng Mater 19(8). https://doi.org/10.1002/adem.201700098
Tang XT, Lu ZW, Sun AZ (2019) The effect of sintered Nd-Fe-B with Dy infiltration to the plating crafts. J Magn Magn Mater 475:10–13. https://doi.org/10.1016/j.jmmm.2018.11.080
Cui XG et al (2017) Magnetic properties and microstructure of sintered Nd–Fe–B magnets with intergranular addition of Ni powders. J Alloys Compd 726:846–851. https://doi.org/10.1016/j.jallcom.2017.08.061
Zhang P, Liang L, Jin J, Zhang Y, Liu X, Yan M (2014) Magnetic properties and corrosion resistance of Nd-Fe-B magnets with Nd64Co36intergranular addition. J Alloys Compd 616:345–349. https://doi.org/10.1016/j.jallcom.2014.07.085
Jin C et al (2016) Magnetic properties and phase evolution of sintered Nd-Fe-B magnets with intergranular addition of Pr–Co alloy. J Alloys Compd 670:72–77. https://doi.org/10.1016/j.jallcom.2016.02.006
Zhang P, Ma T, Liang L, Yan M (2014) Influence of Ta intergranular addition on microstructure and corrosion resistance of Nd-Dy-Fe-B sintered magnets. J Alloys Compd 593:137–140. https://doi.org/10.1016/j.jallcom.2014.01.055
Volegov AS et al (2020) Additive manufacturing of heavy rare earth free high-coercivity permanent magnets. Acta Mater 188:733–739. https://doi.org/10.1016/j.actamat.2020.02.058
Vial F, Joly F, Nevalainen E, Sagawa M, Hiraga K, Park KT (2002) Improvement of coercivity of sintered NdFeB permanent magnets by heat treatment. J Magn Magn Mater 242–245:1329–1334. https://doi.org/10.1016/S0304-8853(01)00967-2
Zhang Y et al (2018) Post-sinter annealing influences on coercivity of multi-main-phase Nd-Ce-Fe-B magnets. Acta Mater 146:97–105. https://doi.org/10.1016/j.actamat.2017.12.027
Goll D, Trauter F, Bernthaler T, Schanz J, Riegel H, Schneider G (2021) Additive manufacturing of bulk nanocrystalline FeNdB based permanent magnets. Micromachines (Basel) 12(5). https://doi.org/10.3390/mi12050538
Tosoni O et al (2023) High-coercivity copper-rich Nd-Fe-B magnets by powder bed fusion using laser beam method. Addit Manuf 64. https://doi.org/10.1016/j.addma.2023.103426
Pelevin IA et al (2023) New scanning strategy approach for laser powder bed fusion of Nd-Fe-B hard magnetic material. Metals (Basel) 13(6). https://doi.org/10.3390/met13061084
Yu KS et al (2022) Additive manufacturing of NdFeB magnets by synchronized three-beam laser powder bed fusion. Opt Laser Technol 146. https://doi.org/10.1016/j.optlastec.2021.107604
Fraser CJ (2002) Electrical machines. The Mechatronics Handbook, pp. 20–33–20–51. https://doi.org/10.1201/9781420037043-13
Pereira T, Kennedy JV, Potgieter J (2019) A comparison of traditional manufacturing vs additive manufacturing, the best method for the job,” in Procedia Manufacturing, Elsevier B.V., pp. 11–18. https://doi.org/10.1016/j.promfg.2019.02.003
Zhou X, Paranthaman MP, Sutherland JW (2023) Comparative techno-economic assessment of NdFeB bonded magnet production: injection molding versus big-area additive manufacturing. ACS Sustain Chem Eng 11(36):13274–13281. https://doi.org/10.1021/acssuschemeng.3c01942
Rong C, Shen B (2018) Nanocrystalline and nanocomposite permanent magnets by melt spinning technique. Chin Phys B 27(11):117502. https://doi.org/10.1088/1674-1056/27/11/117502
Urban N, Huber F, Franke J (2017) Influences of process parameters on rare earth magnets produced by laser beam melting. 2017 7th International Electric Drives Production Conference, EDPC 2017 - Proceedings, vol. 2017-Decem, pp. 1–5, 2018, https://doi.org/10.1109/EDPC.2017.8328149
Wu J, Aboulkhair NT, Degano M, Ashcroft I, Hague RJM (2021) Process-structure-property relationships in laser powder bed fusion of permanent magnetic Nd-Fe-B. Mater Des 209:109992. https://doi.org/10.1016/j.matdes.2021.109992
Urban N, Meyer A, Keller V, Franke J (2018) Contribution of additive manufacturing of rare earth material to the increase in performance and resource efficiency of permanent magnets. Appl Mech Mater 882:135–141. https://doi.org/10.4028/www.scientific.net/amm.882.135
Bittner F, Thielsch J, Drossel WG (2021) Microstructure and magnetic properties of Nd-Fe-B permanent magnets produced by laser powder bed fusion. Scr Mater 201:113921. https://doi.org/10.1016/j.scriptamat.2021.113921
Waqar S, Guo K, Sun J (2022) Evolution of residual stress behavior in selective laser melting (SLM) of 316L stainless steel through preheating and in-situ re-scanning techniques. Opt Laser Technol 149:107806. https://doi.org/10.1016/j.optlastec.2021.107806
Ali H, Ma L, Ghadbeigi H, Mumtaz K (2017) In-situ residual stress reduction, martensitic decomposition and mechanical properties enhancement through high temperature powder bed pre-heating of selective laser melted Ti6Al4V. Mater Sci Eng, A 695(April):211–220. https://doi.org/10.1016/j.msea.2017.04.033
Yue H (2022) Effects of energy density on the mechanical properties, residual stress and thermal-fatigue of Fe-Cr alloy fabricated by laser directed energy deposition, pp 0–31. https://doi.org/10.21203/rs.3.rs-2342095/v1
Zhang S, Xu S, Zheng W, Han J (2022) Study of the effect of SLM energy density on residual stress and microstructure of porous bone scaffolds in cubic structures. Int J Simulat Multidiscipl Des Optim 13. https://doi.org/10.1051/smdo/2022016
Chen C, Chang S, Zhu J, Xiao Z, Zhu H, Zeng X (2020) Residual stress of typical parts in laser powder bed fusion. J Manuf Process 59:621–628. https://doi.org/10.1016/j.jmapro.2020.10.009
Oster NT (2012) Generation and characterization of anisotropic microstructures in rare earth-iron-boron alloys, p 134. https://doi.org/10.31274/etd-180810-2741
Lewis LH, Jiménez-Villacorta F (2013) Perspectives on permanent magnetic materials for energy conversion and power generation. Metall Mater Trans A Phys Metall Mater Sci 44(SUPPL. 1). https://doi.org/10.1007/s11661-012-1278-2
Fidler J, Skalicky P (1987) Metallurgical factors determining the coercivity of ND-FE-B magnets. Mikrochim Acta 91:115–124. https://doi.org/10.1007/BF01199483
Pérez-Ruiz J, González-Barrio H, Sanz-Calle M, Gómez-Escudero G, Munoa J, de Lacalle LL (2023) Machining stability improvement in LPBF printed components through stiffening by crystallographic texture control. CIRP Ann 72(1):141–144. https://doi.org/10.1016/j.cirp.2023.03.025
Pérez-Ruiz JD, de Lacalle LNL, Urbikain G, Pereira O, Martínez S, Bris J (2021) On the relationship between cutting forces and anisotropy features in the milling of LPBF Inconel 718 for near net shape parts. Int J Mach Tools Manuf 170. https://doi.org/10.1016/j.ijmachtools.2021.103801
Acknowledgements
The authors gratefully acknowledge Justin Mitchell and Doug Walston from Arnold Magnetic Technologies for Helmholtz coil tests /Magnetic Tests. The authors would like to thanks the EPSRC Future Manufacturing Hub in Manufacture using Advanced Powder Processes (MAPP) (EP/P006566/1) for their support during this investigation.
Funding
This study was funded by the Republic of Türkiye Ministry of National Education, HiETA Technologies Limited, and Equipmake.
Author information
Authors and Affiliations
Contributions
Conceptualization, Kübra Genç; data curation, Kübra Genç and Sirapob Toyting; formal analysis, Kübra Genç; funding acquisition, Kamran Mumtaz; investigation, Kübra Genç and Sirapob Toyting; methodology, Kübra Genç; project administration, Kübra Genç; supervision, Kamran Mumtaz and Iain Todd; validation, Kübra Genç; visualization, Kübra Genç and Sirapob Toyting; writing—original draft, Kübra Genç; and writing—review and editing, Kamran Mumtaz and Enrique Galindo-Nava.
Corresponding author
Ethics declarations
Competing interests
The authors declare no competing interests.
Additional information
Publisher's Note
Springer Nature remains neutral with regard to jurisdictional claims in published maps and institutional affiliations.
Appendix 1
Appendix 1
Sets of parameters based on the studies by Urban et al. and Kolb et al. Process parameters not numbered in the table were excluded from the initial stage of the experiment since their respective EL values fell outside the range of 0.03–0.05 Ws/mm
Sample ID | Laser power, W | Laser speed, mm/s | Energy line, Ws/mm |
|---|---|---|---|
1 | 40 | 1000 | 0.04 |
2 | 40 | 1250 | 0.032 |
40 | 1500 | 0.026666667 | |
40 | 1750 | 0.022857143 | |
40 | 2000 | 0.02 | |
40 | 2250 | 0.017777778 | |
40 | 2500 | 0.016 | |
40 | 2750 | 0.014545455 | |
40 | 3000 | 0.013333333 | |
3 | 50 | 1000 | 0.05 |
4 | 50 | 1250 | 0.04 |
5 | 50 | 1500 | 0.033333333 |
50 | 1750 | 0.028571429 | |
50 | 2000 | 0.025 | |
50 | 2250 | 0.022222222 | |
50 | 2500 | 0.02 | |
50 | 2750 | 0.018181818 | |
50 | 3000 | 0.016666667 | |
60 | 1000 | 0.06 | |
6 | 60 | 1250 | 0.048 |
7 | 60 | 1500 | 0.04 |
8 | 60 | 1750 | 0.034285714 |
9 | 60 | 2000 | 0.03 |
60 | 2250 | 0.026666667 | |
60 | 2500 | 0.024 | |
60 | 2750 | 0.021818182 | |
60 | 3000 | 0.02 | |
70 | 1000 | 0.07 | |
70 | 1250 | 0.056 | |
10 | 70 | 1500 | 0.046666667 |
11 | 70 | 1750 | 0.04 |
12 | 70 | 2000 | 0.035 |
13 | 70 | 2250 | 0.031111111 |
70 | 2500 | 0.028 | |
70 | 2750 | 0.025454545 | |
70 | 3000 | 0.023333333 | |
80 | 1000 | 0.08 | |
80 | 1250 | 0.064 | |
80 | 1500 | 0.053333333 | |
14 | 80 | 1750 | 0.045714286 |
15 | 80 | 2000 | 0.04 |
16 | 80 | 2250 | 0.035555556 |
17 | 80 | 2500 | 0.032 |
80 | 2750 | 0.029090909 | |
80 | 3000 | 0.026666667 | |
90 | 1000 | 0.09 | |
90 | 1250 | 0.072 | |
90 | 1500 | 0.06 | |
90 | 1750 | 0.051428571 | |
18 | 90 | 2000 | 0.045 |
19 | 90 | 2250 | 0.04 |
20 | 90 | 2500 | 0.036 |
21 | 90 | 2750 | 0.032727273 |
22 | 90 | 3000 | 0.03 |
100 | 1000 | 0.1 | |
100 | 1250 | 0.08 | |
100 | 1500 | 0.066666667 | |
100 | 1750 | 0.057142857 | |
23 | 100 | 2000 | 0.05 |
24 | 100 | 2250 | 0.044444444 |
25 | 100 | 2500 | 0.04 |
26 | 100 | 2750 | 0.036363636 |
Rights and permissions
Open Access This article is licensed under a Creative Commons Attribution 4.0 International License, which permits use, sharing, adaptation, distribution and reproduction in any medium or format, as long as you give appropriate credit to the original author(s) and the source, provide a link to the Creative Commons licence, and indicate if changes were made. The images or other third party material in this article are included in the article's Creative Commons licence, unless indicated otherwise in a credit line to the material. If material is not included in the article's Creative Commons licence and your intended use is not permitted by statutory regulation or exceeds the permitted use, you will need to obtain permission directly from the copyright holder. To view a copy of this licence, visit http://creativecommons.org/licenses/by/4.0/.
About this article

Cite this article
Genç, K., Toyting, S., Galindo-Nava, E. et al. Laser powder bed fusion of NdFeB and influence of powder bed heating on density and magnetic properties. Int J Adv Manuf Technol (2024). https://doi.org/10.1007/s00170-024-13605-9
Received:
Accepted:
Published:
DOI: https://doi.org/10.1007/s00170-024-13605-9