
Abstract
The implementation of a PLM is a great process of change, representing a critical phase due to the inertia that characterizes some organizations. This evidence especially occurs in industry new to PLM, such as the fashion one, where a lack of clear guidelines for implementation significantly increases the risk of failure of that process. In addition, an adequate project management approach that actively includes final users during the whole process will avoid the mismatch between outcomes and requirements. To support an efficient and effective introduction of PLM, it is then important to define a structured implementation method that involves all interested users from the early stages. A literature review has been conducted as preliminary step to investigate if bottom-up approaches to PLM implementation in fashion industry have already been studied. Based on the evidences from literature review, a framework was therefore defined, detailing the step-by-step procedure to follow for effectively implement a PLM considering the peculiarities of the fashion industry. To give evidence of the applicability of the proposed framework, it has been successfully used during the implementation process of a PLM software in a real context. The Italian company involved in the case study, Graziella, belongs to the gold-working district of Arezzo, in Tuscany, and has been working for more than 60 years in the gold jewellery sector.
1 Introduction
The acronym PLM (product lifecycle management) has a wide meaning, being considered business model based on a strategic approach to managing processes, information and resources to support a dynamic configuration of the product lifecycle. PLM was born in the 80s in the aerospace and automotive sectors, but it has recently become important also in other industries, such as the fashion one.
The fashion industry is currently worth around $300 billion, which is expected to rise to over $360 billion by 2025.Footnote 1 In this context, Italy stands out with 24 of the 100 largest fashion and luxury companies operating worldwide.Footnote 2 The fashion sector is a dynamic reality that has witnessed radical transformations in recent years. First, the lifecycle of products is getting shorter and shorter because customers require new products faster than ever. Second, fashion companies have to manage a very large number of stock keeping units (SKUs), due to the combinatorial explosion of variants. Finally, supply chain networks show a higher complexity because companies have started to outsource non-core activities in a global scenario. The trade-off between the characteristics listed above and the mandatory outstanding quality level to be guaranteed on the market justifies the growing interest of this sector for PLM. This tool allows companies to create and update a unique archive that contains all the information related to the products, avoiding the proliferation of data. It facilitates collaboration and real-time sharing of updated information along the entire supply chain. Thanks to PLM, it is also possible to make internal processes more efficient, eliminating activities without added value. Although the benefits of PLM are clear, it is a process of change that is not always easy to implement, being often time-consuming and leading to inefficiencies if not well-managed.
To understand how these issues could be approached, a literature review on Scopus database has been conducted to frame the topic. The used keywords were “PLM” or “Product Lifecycle Management” associated with the term “Fashion” or others that refer to the main product categories that characterize the fashion sector (i.e. “Apparel”, “Garment”, “Gold-working”, “Footwear”, “Jewellery”, “Leather”, “Textile”). This research results in 143 papers, but 88 of them have been excluded according to the following criteria: (i) publication date of 2000 or later; and (ii) title and/or abstract focused on the reviewed topic.
Only 6 of the remaining 55 papers have dealt with PLM implementation in the fashion industry, but a single reference for a detailed and structured application framework, covering all the phases from the initial ones to the post go live ones, is still missing.
D’Avolio et al. [3] provide points for reflection for academics and entrepreneurs who are trying to reach a full PLM implementation in their business, aligned to the best practices. D’Avolio et al. [4] conduct a case study to describe PLM implementation and merge business processes with enabling information technologies. This article, differently from the one proposed, has the limit to investigate only the earlier phase of a PLM implementation. D’Avolio et al. [5] compare current practices in conducted PLM implementation projects with the PLM implementation guidelines from the literature review, also covering the post-implementation stages. Unlike the present work, this paper reports the guidelines present in the literature, but they do not focus on identifying a step-by-step process that covers the whole project of PLM implementation. D’Avolio et al. [6] propose a framework for effective implementation of PLM in the fashion industry based on four consecutive phases: identification of business issues and needs, model process and data, identification of PLM business objects and a scenario analysis to select a PLM solution, without describing the detailed implementation and tests needed before go-live. Li and Qi [11] present an Agile methodology but it focuses only on the implementation step. Vezzetti et al. [20] propose a PLM implementation framework in the textile industry but it does not provide clear guidelines from a managerial point of view.
According to this overview, in the following paragraphs, an implementation framework is proposed and applied in a real context.
The paper is structured as follows: in the first section, the proposed PLM implementation framework is presented and described in detail in all its phases; the second section presents the main evidence from the case study; finally, the main conclusions and further developments are listed in the last section.
2 Methodology
The proposed framework aims to identify a PLM implementation roadmap in order to make the application steps of this software more effective within companies. The starting point has been the model proposed by Vezzetti et al. [20], improved to overcome its limitations.
To support an efficient introduction of a software, it is important to define a structured implementation method that involves all interested users from the early stages. According to this, a focus has been made on mapping the needs of key users involved in the lifecycle management of products, confirming the attention paid on using a bottom-up strategy [1, 15]. Beside this, the proposed framework has been developed to include clear, quantitative and objective guidelines for PLM implementations in real scenarios, due to the evidence that a rigorous procedure to follow increases the successfulness of these processes [2] Moreover, details to the most effective project management approach to be used during the implementation process are given to define how to gain the expected results with the less unneeded efforts.
The 4-steps implementation methodology proposed in the present work is shown in Fig. 1.
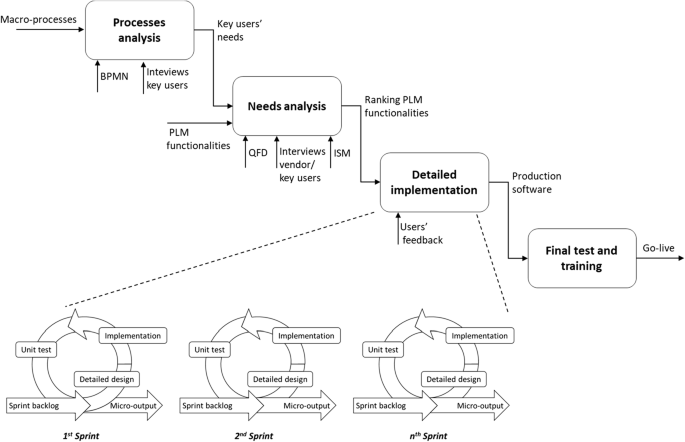
Proposed implementation framework
From a project management perspective, compared to the sequential model developed by Vezzetti et al. [20], Fig. 1 shows the proposed hybrid Waterfall-Agile implementation framework. The hybrid approach has been chosen to gain benefits from both of them, as widely confirmed by the literature [10, 16,17,18]. On the one hand, the 4 steps are sequential each other, following a Waterfall approach to guarantee a structured planning of the main phases of the project. On the other hand, the implementation step (i.e. “Detailed implementation” in Fig. 1) follows an Agile approach, providing micro-releases to be tested by key users after each time-boxed sprint. This approach, as confirmed in literature for deployment activities, ensures frequent feedback from the final users to avoid mismatches between users’ requirements and functions released at the end of the project.
Going deeper in details, the first phase of the proposed model concerns the analysis of the processes (i.e. “Processes analysis” in Fig. 1). For implementation in fashion supply chains, the macro-processes involved are the ones identified by Fani et al. [7] for that industry: (i) design, (ii) prototyping, sampling and engineering, (iii) sourcing, (iv) production and (v) ordering and retail. Each one of them has to be splitted in activities, mapped with the Business Process Model and Notation (BPMN) standard. It is a well-known graphic modelling inspired by flowcharts, often chosen for being easy to understand even by operating staff. To map the process, it is then necessary to consult the involved key users. Semi-structured interviews are used as efficient method to collect data to fully understand company realities through a bottom-up approach [12]. Each activity reported in the BPMN mapping has to be linked to the identified macro-processes, in order to focus the implementation of the only PLM functionalities connected to them. After a second round of interviews, the needs related to each activity described in the mapping are identified to highlight the main issues key users have to face with.
Starting from the list of user needs, the second implementation phase begins (i.e. “Needs analysis” in Fig. 1). During this phase, the analysis is focused on identifying which are the main PLM functionalities that meet the customers’ needs, solving the related issues. In analogy to Vezzetti et al. [20], the tool used to identify that match is the relationship matrix of the Quality Function Deployment (QFD) approach. In addition, for implementation in fashion supply chains, the proposed model includes the PLM functionalities focused on that industry identified through a detailed literature review by Fani et al. [7]. First, during the second round of semi-structured interviews, key users were asked to declare an importance score (di) to each need on a Likert scale from 1 to 5, where 1 indicates the lowest degree of importance and 5 the highest. The relative importance (\( {d}_i^{\prime } \)) is then calculated as follows:
For the compilation of the relationship matrix, semi-structured interviews with vendors are planned, aimed at understanding which PLM functionalities are able to satisfy each specific users’ need and to what extent. If there is correlation, it is quantified using a scale of three values: 1, 3 and 9. The value 1 is used if the correlation is weak, 3 if it is medium and 9 if the correlation is strong. The matrix of relations is then filled with numerical values, indicated with rij in Fig. 2.
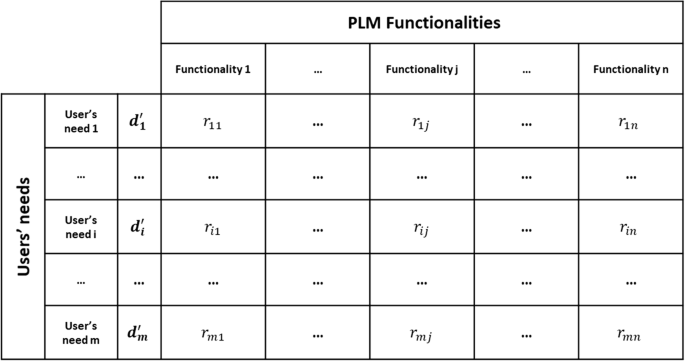
QFD relation matrix
In order to obtain a ranking of the PLM functionalities, in analogy to Vezzetti et al. [20], the independent scoring method (ISM) is used. The absolute importance of each PLM functionality, indicated with wj, is calculated as the sum of the relative importance of each user need (di′) multiplied by the value that identifies how much a j-th functionality satisfies each specific request (rij):
The relative importance of each functionality is therefore calculated as follows:
The ranking of the PLM functionalities is obtained sorting them in descending order of relative importance.
Compared to Vezzetti et al. [20], the “Guidelines formalization” phase was replaced by two phases (i.e. “Detailed implementation” and “Final test and training” in Fig. 1). This choice is linked to the fact that, compared to Vezzetti et al. [20], the present work aims to go beyond the definition of a list of PLM functionalities to be implemented. In particular, a more detailed description of the phases that follow the analysis of processes and needs is included in the present work, covering the approaches to be adopted from the implementation to the autonomous use of the solution by final users.
Looking at the “Detailed implementation” phase, as mentioned before, an Agile approach is followed to effectively guarantee the results of the project. The ranking of PLM functionalities coming from the previous phase represents the input of this step. Depending on the specific use-case, some of those functionalities could be developed immediately while others postponed to next project waves that follow the go-live of the first one. According to the Agile approach, the deployments related to the project first wave are splitted on time-fixed sprints, usually covering the range of 1 to 4 weeks [19]. Based on literature evidences [9, 18], each sprint consists of the three phases shown in Fig. 1:
-
“Detailed design”, which provides the definition, review and validation of the deployments to be included in the sprint final release.
-
“Implementation”, in which functions included in the sprint are released by developers first in the development environment and, after their approval, in the test environment.
-
“Unit test”, in which key users verify the functions released in the test environment, giving feedback for possible changes and improvements. This phase ends with the release of a micro-output in the production environment.
In the final step (i.e. “Final test and training” in Fig. 1), key users conduct an integration and system test. This step is useful to verify that the PLM software works as expected [13], and no problems occur in the interaction between the individual micro-outputs that have been independently developed during each sprint. After the previous tests, a training phase is scheduled, during which all users are trained on the use of the software. The relevance of this step is related to the fact that one of the main causes of failure during software implementation is the lack of adequate user training [8, 14]. The output of this phase is the go-live, representing the moment when the software tested only by key users is made available to all the interested users. Finally, it will be necessary to provide a post-go-live phase, during which the software house supports final users to solve problems that could arise immediately after the adoption of the new tool.
3 Results
To demonstrate the applicability of the proposed framework, it has been concretely used within Graziella company during the whole PLM implementation process. This single-case study does not have the purpose to validate the framework but to give evidence about its usability in a real scenario.
Graziella Group S.p.a. is an Italian fashion company founded in 1958 by Graziella Buoncompagni, the current Honorary President, who began to create handcrafted gold jewellery characterized by a personal and innovative style at a very young age. From the past small laboratory in the province of Arezzo (Tuscany) to the new headquarter inaugurated in 2000, Graziella has become an international leader in the world of fashion and luxury made in Italy.
As “step zero” for the application of the proposed framework, the macro-processes to be included in the PLM implementation project have been identified during the kick-off meeting, choosing among the ones identified by Fani et al. [7]. More in details, the macro-processes of design, prototyping, sampling and engineering, sourcing and ordering and retail have been taken into consideration.
According to the “Process analysis” step, the BPMN mapping standard has been used to highlight activities, resources and documentation involved during the selected macro-processes. The result is shown in Fig. 3.

BPMN mapping for Graziella company
Each activity identified in the BPMN mapping has been reconducted to one of the macro-processes identified in the previous step, as shown in Table 1.
At this point, semi-structured interviews to the key users identified during the kick-off meeting have been realized to understand the main needs connected to each mapped activity (i.e. Table 5 in Appendix).
The output of the first step is the list of the users’ needs that will be the input for the second step. Key users’ needs have been grouped into 10 macro-categories, as shown in Table 2.
Looking more in details at the listed general needs, one of the users’ needs for the first mapped activity (i.e. “Market analysis”) is having tools to support market analysis. In particular, users need support to the development and consultation of new market trends. Furthermore, it is important to analyze sales of previous seasons for the various reference markets in order to understand if the results were consistent with expectations and, consequently, if they are replicable for the current season.
The “Market analysis” activity in the current AS IS configuration is based on the compilation of an Excel sheet containing information related to the target market (e.g. competitors, main products, price range). Photos and inspirations are collected during business travels to understand the potential buyers’ preferences. However, these data are not currently stored in a structured way, making having a single interface a primary need: in this way, these data could be easily consulted by final users. The same need has been also highlighted for storing files related to the raw prototypes obtained from 3D scans and reworked by suitable graphics software. Similarly, it is also requested for photos and data related to samples and final products used for the catalogue.
During the interview, another need highlighted by the key users has been that a timed flow of activities with clear deadlines has never been established. This is one of the main reasons of inefficiency during the order collection phase, which represents the first contact between company and customers during fairs. For example, catalogues with photos associated with specific barcodes are often not ready, making sales agents unable to collect orders in a structured way. It often happens that samples to be shown to customers do not match the initial requirements, because to meet the fair date, there was no time to effectively carry out the activities needed and non-compliance with the specifications emerged. According to this, defining project timelines allows a greater awareness of all the actors on meeting deadlines. For instance, due dates must be defined for both the validation of raw prototypes and sharing the Preliminary and Technical Sheets. In addition to a punctual definition of deadlines, a need to insert blocks to the process flow has emerged. In particular, the activity related to the “Industrial code creation” can only take place once raw prototypes have been validated by the Creative department, to avoid the creation of unnecessary industrial codes for not-approved products. Another block must be inserted before the validation of samples, so that the subsequent “BOM Creation” activity will be done only once the sample has been approved.
At various points along the product development process, the need to digitize product data emerges. The Creative Box Sheet is a simple Word file where information relating to the products are entered (e.g. line, creative theme, basic technology), as well as the Preliminary Sheet, an evolution of the previous one that includes the industrial code of the finished product. The Technical Sheet for each product is also a Word file where the Catalogue department manually enters information such as the required semi-finished products, main suppliers and price range. The digitization of these parameters makes the process more efficient and less error prone. In general, all the information contained in the current information systems must therefore be digitized, such as those relating to the BOMs and the finishing packages.
Several actors throughout the development process make changes and updates to the various documents. All interested users must have access to the updated versions of them to avoid errors that arise from the use of incorrect information relating to the products. Examples of documents to be consulted are the following:
-
The Creative Box Sheet
-
The Preliminary Sheet
-
The Technical Sheet
-
Documents related to raw prototypes
-
BOM updates emerged during the product development and realization or following changes requested during the order collection phase (e.g. information related to the product weights, updates of the price range, changes of product finishes due to customer requests).
Everyone has a specific responsibility within the product development flow, so a need that has emerged is to give specific privileges to specific user groups. For instance, only the staff of the product development office can fill in and edit the Creative Box Sheet, while the staff of the Catalogue department is the only one who can fill in and modify the Preliminary and Technical Sheets. Finally, the BOM can be created and edited only by the Production staff and the Catalogue department.
Product development is a process that involves cross-functional teams and the timely communication about the realization of raw versions of products and their evolutions among the various actors is a necessity that emerges along the process. The most important information to be shared for the Graziella company is related to the following:
-
The creation of the Creative Box Sheet
-
The validation of raw prototypes and samples
-
The creation of industrial codes for finished product and semi-finished product
-
The massive generation of barcodes
-
The BOM updates in the pre- and post-order collection phase.
Parallelly with the implementation of the PLM, the company is carrying out a software selection to evaluate the introduction of cataloguing and order collection tools. The integration with these tools is therefore required, as well as with the graphics software already used in the prototyping phase (e.g. CAD, ZBrush, Matrix and Adobe Photoshop).
Some procedures currently managed on the company’s information systems must be automated to both reduce time-consuming activities and data entry errors. The guided creation of industrial codes and barcodes according to the product master characteristics (e.g. product line, mood) and the relative finishes are particularly important. The guided association of finishes to collections and finished products must also be reproduced.
An automatic price updating procedure will have to be introduced according to the weight variation. When the final price is defined, the estimated cost for the finished product is calculated. In the current configuration, this evaluation is based on the raw materials and not on the industrial costs. For gold jewellery, in fact, the cost has been always calculated according to the specific weight and title, also because the cost of the manufacturing process is almost irrelevant, but on silver items, it has a significant impact. According to this, the need that emerges is therefore to evaluate the final cost not only based on raw materials but also on the type of processing.
In the second step of the proposed methodology, structured interviews to users allow to establish an absolute importance score for each need identified in the previous step. This score is established using the Likert scale (di) and then the relative importance score (\( {d}_i^{\prime } \)) is calculated. The results are shown in Table 6 in Appendix.
In addition to users’ needs, the 27 PLM functionalities identified by Fani et al. [7] are also considered as input. The purpose of the “Needs analysis” step, in fact, is to identify a priority ranking of functionalities to be implemented in the company. As anticipated, two tools are used during this phase: the QFD relationship matrix and the ISM. The relationship matrix is filled according to structured interviews addressed to the software house that has been chosen for the implementation.
For instance, Fig. 4 shows the answers for the activity of the BPMN mapping related to the realization and validation of raw prototypes. On rows, the user needs declared for the analysed activity are listed, while columns show the PLM functionalities identified by Fani et al. [7]. Looking at the first row in Fig. 4, it refers to the emerging need in the prototyping phase related to the integration of PLM with graphics software, getting 2% as relative importance score (\( {d}_i^{\prime } \)) in the previous step. Moving to the results coming from this step, the involved software house declares that this need is completely satisfied by the integration software functionality, assigning a score of 9. On the other hand, also the product data management (PDM) and BOM management functionalities are involved, with an assigned score of 3. The evidence is that files and data extracted from the graphics software must be imported on the PLM, but also archived and linked to the BOMs, respectively. Finally, as shown in the following table, not all crossings are populated because not all the PLM functionalities on columns meet the needs on rows.
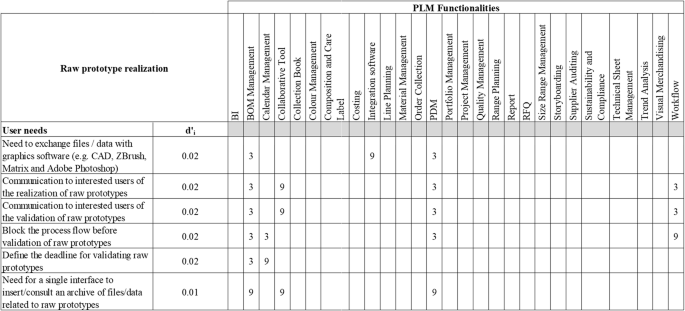
Example of filled QFD relationship matrix
Using the ISM, a ranking of the most appropriate PLM functionalities to meet the needs of the interviewed users was obtained, as shown in Table 3.
The most relevant functionalities resulting from the ranking (i.e. see Table 4) have been included in the first deployments, while others have been postponed to future project waves.
More in details, the five features having an importance scores lower than 2% in Table 4 and the workflow and calendar management functionalities have been excluded from the first project wave.. This choice has been done to reduce the overall deployment time, as these features can be postponed to a second project wave without impacting what was foreseen in the first wave. In addition, the cataloguing and order collection software are currently under selection. Finally, the features with an importance score of 0 will not be implemented at all.
For the Graziella case study, the features identified in the first wave have been divided into 10 sprints (i.e. see Table 3), according to the Agile approach used in the “Detailed implementation” phase. The work to be done in each sprint has been planned in meetings called “Pre-sprint planning meetings” that take place at the beginning of each iteration. The input of each sprint is, in fact, a direct consequence of the micro-output of the previous one and the feedback collected by the key users.
Each sprint has been a duration of 4 weeks, including 2 weeks for the “Detail design”, a week for the “Implementation” and a week for the “Unit test”. Each “Unit test” ended with the release in production of what has passed the test, while the rest have been rescheduled in the next sprint.
The first sprint concerns the definition of the hierarchical structure and the relative master data. More in details, this sprint aimed at defining attributes, variations by season, markets, collections, themes and product categories, representing the basis for all the other sprints, and for this reason, it has been done first.
The second sprint (i.e. “Colour Management and relative Master Data”) is directly linked to the Colour Management PLM function: in this phase, adherence to standards for the definition of colour and coding rules is established.
The third sprint (i.e. “Material Management and relative Master Data”) is linked to the Material Management PLM functionality. The previous Colour Management functionality is preparatory to this module as the rules for associating colours with materials are defined at this stage.
The fourth sprint (i.e. “Article Management and relative Master Data”) is linked to the functions of Colour and Material Management: in this phase, the rules for associating colours and materials to the articles are established. It is also connected to BOM Management because in this phase, the article code is established, representing the starting point for the development and the detailed description of the BOM.
The fifth sprint (i.e. “BOM Management”) establishes the information that must be contained in the BOMs along the different phases of the product lifecycle, from prototyping, to sampling, to production. The functions of Colour Management and Material Management are preparatory to this phase since relevant information to be included in a BOM refers to the colours and materials associated with the article.
The sixth sprint (i.e. “Line & Range Planning”) allows to implement procedures for a structured planning and a correct definition of the mix of products per market.
In the seventh sprint (i.e. “Cost sheet”), rules that allow users to define a preventive cost from the first stages of product development are established. That cost will then be updated by proceeding in development, up to the definitive one. The definition of the cost is directly linked to aspects such as materials, colours and BOMs: for this reason, the functions of Colour Management, Material Management and BOM Management are preparatory.
The eighth sprint (i.e. “Documentation”) is used to manage all documents within the PLM. It is directly linked to the realization of the line and range planning, which include documents such as the collection form (i.e. the “Creative Box Sheet” for the Graziella company), as well as the Technical Sheet Management functionality. It is also linked to the Collaborative Tool and PDM functions, as it is at this stage that documents containing updated product data can be organized in a single shared space available to all interested users. Furthermore, the possibility of associating with each document different states that identify its level of maturity (i.e. creation, validation or obsolescence) allowed by the PDM functionality is guaranteed.
The ninth sprint (i.e. “Definition of user profiles and allowed actions”) is directly linked to the PDM functionality. In this phase, specific privileges are established for groups of users, determining the allowed actions which can be read only, write, modify and delete information within the sections of the PLM and related documents.
The tenth sprint (i.e. “PLM-AS400 Integration”) plans to structure the data import/export procedures between AS400 and the PLM (e.g. import from AS400 to the PLM of customer and supplier master data; export from the PLM to AS400 of articles, materials, colours master data).
4 Conclusion and future developments
From an academic point of view, this work led to the definition of a structured methodology for implementing a PLM software in the fashion industry that bridged the gap existing in the literature.
To do this, the method proposed by Vezzetti et al. in [20] has been expanded and improved in some of its points. The macro-processes and functionalities focused on the fashion industry identified by Fani et al. [7] are respectively introduced as input in the “Process analysis” and “Needs analysis” phases, to ensure the definition of guidelines dedicated to that sector. The main advantage gainable with this industry-oriented approach is to drastically reduce the probability of failure of software implementations that include standard functionalities despite dedicated ones. Standardization, in fact, could result in a misalignment with the peculiarities of the sector, increasing the risk of failure to meet the specific requirements of the final users.
Instead IDEF0 (ICAM DEFinition for Function Modelling), BPMN is used as mapping standard because it is more suitable for the representation of business processes that must be computerized.
The “Detailed implementation” and the “Final test and training” steps, only marginally described in the single item “Guideline formalization” proposed by Vezzetti et al. [20], are extensively detailed to be effectively used in concrete scenarios. Unclear guidelines, in fact, introduce subjectivity in key activities such as the selection of the PLM functionalities to implement and their priority that could lengthen project time. For instance, errors in the identification of the PLM functionalities, ranked by priority, that really meet the users’ requirements result in unnecessary developments and extra-efforts needed to manage ongoing change requests.
To reinforce those results, the most appropriate project management method for the different phases was detailed, according to the well-known evidence that it is useful to adopt a hybrid Waterfall-Agile implementation model to get the benefits of both. As shown in Fig. 1, in fact, the first two steps and the last one will follow a Waterfall approach, while the central part of the project is carried out with an Agile approach, which provides micro-releases in production environment of functionalities tested and shared with customers. This overcomes the main limit of a pure Waterfall approach, allowing the collection of feedback from final users after each time-boxed sprint instead of when the whole implementation is completed.
The methodology was conceived as a guideline in a concrete context, assuming value also from a managerial point of view. The applicability of this model was confirmed by the case study of the Graziella company, which successfully implemented a PLM system using this methodology. Figures and tables in the sections “Results” and “Appendices”, in fact, resume the step-by-step results obtained from the application of the proposed framework. This single-case study does not have the purpose to validate the framework but to give evidence about its usability in a real scenario. To reinforce the added value, future developments plan to widen the analyzed sample by involving other companies in the fashion sector.
Further researches could also include the application of the proposed framework to other industries in which PLM is emerging, such as the food one. The implementation on other sectors requires the identification of the macro-processes and PLM functionalities specific for those industries through a detailed literature review. Once they have been defined, the procedure to follow for an effective PLM implementation is the one described in the present paper. New companies involved as case studies, belonging to the fashion industry or not, will then require interviews to new key users. They could result in different BPMN-mapped activities and both detailed and general key users’ needs, as well as different scores in the QFD relationship matrix and project sprints for the ranked PLM functionalities.
Finally, new studies could envisage the extension of the implementation methodology to other software, such as the ones related to the quality control and the warehouse management, as well as management software.
Data availability
The paper has no associated data.
Notes
Kantar, “Fashion Innovation Week”, Lugano, April 2019
Deloitte, “Global Powers of Luxury Goods”, 2019
Abbreviations
- BI:
-
Business intelligence
- BOM:
-
Bill of Material
- BPMN:
-
Business Process Model and Notation
- ICAM:
-
Integrated Computer-Aided Manufacturing
- IDEF0:
-
ICAM DEFinition for Function Modelling
- ISM:
-
Independent Scoring Method
- PDM:
-
Product data management
- PLM:
-
Product lifecycle management
- QFD:
-
Quality function deployment
- RFQ:
-
Request for quotation
- SKU:
-
Stock keeping unit
References
Amoako-Gyampah K (2007) Perceived usefulness, user involvement and behavioral intention: an empirical study of ERP implementation. Comput Hum Behav 23(3):1232–1248
Bokinge M, Malmqvist J (2012) PLM implementation guidelines - relevance and application in practice: a discussion of findings from a retrospective case study. Int J Prod Lifecycle Manag 6(1):79–98
D'Avolio E, Bandinelli R, Rinaldi R (2015) Towards PLM maturity assessment in the fashion industry. Proc Summer Sch Francesco Turco:118–123
D’Avolio E, Bandinelli R, Rinaldi R (2016a) How product development can be improved in fast fashion industry: an Italian case. IFIP Adv Inf Commun Technol 467:718–728
D’Avolio E, Bandinelli R, Rinaldi R (2016b) PLM implementation and adoption features: From theory to practice in two high fashion companies. Proc Summer Sch Francesco Turco:76–80
D'Avolio E, Bandinelli R, Rinaldi R (2017) A process-oriented framework for PLM implementation in fashion companies. Int J Prod Lifecycle Manag 10(3):191–209
Fani V, Bandinelli R, Bindi B (2020) PLM functionalities in the fashion industry. Preliminary results of a classification framework. IFIP Adv Inf Commun Technol 594:527–537
Ha YM, Ahn HJ (2014) Factors affecting the performance of Enterprise Resource Planning (ERP) systems in the post-implementation stage. Behav Inform Technol 33(10):1065–1081
Hayata T, Han J (2011) A hybrid model for IT project with Scrum. Proc IEEE Int Conf Serv Oper Logist Informatics SOLI:285–290
Lesmana IPD, Karimah NK, Widiawan B (2016) Agile-Waterfall hybrid for prevention information system of dengue viral infection: a case study in Health Department of Jember, East Java, Indonesia. Int Conf ICT Knowl Eng:1–6
Li X-S, Qi G-N (2008) Integrated product model to support implementation of product lifecycle management. J Zhejiang Univ Eng Sci 42(3):418–424
Louise Barriball K, While A (1994) Collecting data using a semi-structured interview: a discussion paper. J Adv Nurs 19(2):328–335
Madni AM, Sievers M (2014) System of systems integration: key considerations and challenges. Syst Eng 17(3):330–347
Nicolaou AI (2004) ERP systems implementation: drivers of post-implementation success. IFIP TC8/WG8.3 Int Conf:589–597
Plo L, Robin V, Girard P (2016) Understanding PLM system concepts to facilitate its implementation in SME: the real case study of POULT. IFIP Adv Inf Commun Technol 492:512–522
Rahmanian M (2014) A comparative study on hybrid IT project management. Int J Comput Inf Technol 3(5):1096–1099
Salinas EM, Boyne L (2012) Hybrid waterfall agile development for the federal space. In: PMI® global congress 2012—North America, Vancouver, British Columbia, Canada. Project Management Institute, Newtown Square
Shimoda A, Yaguchi K (2017) A method of setting the order of user story development of agile – waterfall hybrid method by focusing on common object. Proc IIAI Int Congr Adv Appl Inf, IIAI-AAI:301–306
Sliger M (2011) Agile project management with Scrum. In: PMI® global congress 2011—North America, Dallas, TX. Project Management Institute, Newtown Square
Vezzetti E, Alemanni M, Macheda J (2015) Supporting product development in the textile industry through the use of a product lifecycle management approach: a preliminary set of guidelines. Int J Adv Manuf Technol 79(9–12):1493–1504
Acknowledgments
The case study included in this work has been carried out within the Graziella company. The authors would like to thank Elena Ghezzi, Marco Marchini and Augusto Tocca for actively participating to all the phases of the project and their precious support in the validation of the implementation framework.
Funding
Open Access funding provided by Università degli Studi di Firenze.
Author information
Authors and Affiliations
Contributions
V.F. designed and performed the framework, derived the models and analyzed the data, with the support of R.B. C.F. and B.B. helped carry out the test case. V.F. and C.F. wrote the manuscript in consultation with R.B.
Corresponding author
Ethics declarations
Conflict of interest
The authors declare that they have no conflict of interest.
Ethical approval
All procedures performed in studies involving human participants were in accordance with the ethical standards of the institutional and/or national research committee and with the 1964 Helsinki declaration and its later amendments or comparable ethical standards.
Consent to participate
Informed consent was obtained from all individual participants included in the study.
Consent to publish
The participant has consented to the submission of the case report to the journal.
Code availability
The paper has no associated software
Additional information
Publisher’s note
Springer Nature remains neutral with regard to jurisdictional claims in published maps and institutional affiliations.
Appendix
Appendix
Rights and permissions
Open Access This article is licensed under a Creative Commons Attribution 4.0 International License, which permits use, sharing, adaptation, distribution and reproduction in any medium or format, as long as you give appropriate credit to the original author(s) and the source, provide a link to the Creative Commons licence, and indicate if changes were made. The images or other third party material in this article are included in the article's Creative Commons licence, unless indicated otherwise in a credit line to the material. If material is not included in the article's Creative Commons licence and your intended use is not permitted by statutory regulation or exceeds the permitted use, you will need to obtain permission directly from the copyright holder. To view a copy of this licence, visit http://creativecommons.org/licenses/by/4.0/.
About this article

Cite this article
Fani, V., Falchi, C., Bindi, B. et al. Implementation framework for PLM: a case study in the fashion industry. Int J Adv Manuf Technol 113, 435–448 (2021). https://doi.org/10.1007/s00170-021-06623-4
Received:
Accepted:
Published:
Issue Date:
DOI: https://doi.org/10.1007/s00170-021-06623-4