
Abstract
Underground reinforced concrete (RC) structures, such as tunnels and pipelines, are frequently employed in urban areas and are designed to withstand both static and seismic loads, including those that occur during earthquakes. However, the inspection of deteriorated underground structures has yielded valuable findings for the civil engineering community, highlighting the need for further experimental investigation of the various damage mechanisms affecting RC tunnels under different loading conditions. This research presents a comprehensive experimental study aimed at elucidating the damage mechanisms of underground RC structures exposed to various loading conditions. Specifically, the study includes experimental testing of the corrosion of tunnel reinforcement and an investigation into the overall performance of corroded tunnels. The experimental results indicate that existing vertical loads significantly impact the lateral carrying capacity and ductility of RC tunnels.
Introduction
Engineering is a discipline that encompasses safety, performance, and cost-efficiency in the design and construction of various projects, including buildings, bridges, electronic devices, and software systems. With the current economic climate, governments are striving to reduce project costs, particularly for infrastructure projects and utilities. Implementing cost-reduction strategies can benefit the economy and the environment by mitigating material waste and reducing environmental pollution. The impact of cost optimization is evident in the designs of all engineers, making research into design optimization incredibly significant. By conducting research and implementing cost-effective solutions, engineers can reduce material usage, lower environmental footprints, and establish sustainable engineering practices.
A comprehensive investigation was conducted on a specific type of infrastructure RC tunnels to achieve these goals. These structures require meticulous design to withstand all types of loading conditions, including those experienced during construction and those encountered in the final operating condition. Such loading conditions may include vertical and lateral loads, which can place substantial stress on the structure. During the design phase, long-term loading conditions must also be considered to ensure the structure remains safe and stable over its lifespan. One of the significant challenges in designing RC structures is corrosion, which can significantly undermine the reinforcement and structural integrity of the system. Corrosion can occur due to a variety of factors, including environmental exposure, chemical reactions, and aging. Therefore, in the design phase, engineers must take into account all possible loading cases to ensure the structure withstands the intended loads and remains robust and resilient. By incorporating these considerations into the design process, engineers can develop structures that can withstand a range of loading conditions and remain safe and stable over their lifespan.
Over the lifespan of these critical structures, numerous failures have occurred under different loading conditions such as the failure of mountain tunnels during the 1999 Chi-earthquake in Taiwan [1], the damage caused by landslides to tunnel during the 2004 mid-Niigata prefecture earthquake [2], and accident in Sasago highway tunnel in Japan [3].
The primary objective of this research is to evaluate the performance of RC tunnels (single-cell type) under diverse loading conditions. Small-scale specimens were constructed and tested to assess various factors such as the impact of confinement on the structure, the effects of horizontal cyclic loading under varying vertical surcharge loading values, and the impact of corrosion under both vertical and horizontal cyclic loading conditions. By analyzing these experiments’ results, engineers can better understand how these structures perform under different loading scenarios and identify potential weak areas that may require further attention. This information is critical for developing performance-based design systems and maintenance strategies to ensure the long-term durability and safety of these structures.
In a prior study, an RC box culvert that had been in service for 13 years as a discharge water channel was subjected to horizontal two-way cyclic loading after being artificially corroded. The corrosion process involved immersing the specimen in a container filled with a 3% NaCl solution and applying a direct current of 20 for 16 days. The degree of corrosion was determined using two methods: the weighted difference (JCI method) and the other strength difference. The maximum extent of steel corrosion, as measured by the weighted difference method, was found to be approximately 10%. The findings indicate that the maximum level of steel corrosion, which was approximately 10%, corresponds to a loss of around 30% of the horizontal load capacity [4].
Another study [5] focuses on developing damage control strategies for underground RC structures that are exposed to service and seismic loads. The objective is to gain a comprehensive understanding of the behavior of these structures under diverse loading conditions and to establish effective strategies for mitigating the damage caused by these loads. To achieve this goal, the study involves a combination of experimental and numerical investigations into the structural behavior of underground RC structures. The experimental investigations include field assessments of existing structures, and laboratory tests on scaled models, while the numerical investigations involve simulations to model the behavior of these structures under different loading conditions. The findings of this study could improve the safety and longevity of underground RC structures and inform the development of effective damage control strategies.
The objective of the previous study was to examine the impact of vertical cyclic loading on underground structures while considering confinement conditions at varying depths below the ground surface. To achieve this, a series of experiments were conducted using small-sized mortar models with a reinforcement ratio of 0.35%. By altering the depth of the models, the study aimed to understand how the soil and depth of installation influenced the confinement load capacity of underground structures. The soil was poured and compacted to achieve a relative density of approximately 55%. Three specimens were tested, with the buried depths of the specimen (d) ranging from 14, 28, and 42 cm. The loading setup employed displacement control hydraulic loading at a rate of 0.3 mm/min, using a plate with dimensions of 500 × 500 × 9 mm. The authors emphasized the importance of using sufficiently stiff and large plates in the loading setup. The model and plate deflection were measured using pulse coders and ordinary transducers. The findings of the experiment indicated that the loading capacity increased with an increase in the buried depth, but this relationship was not linear with (d). The reduced load due to the depth of the specimen had a negative impact on seismic performance. The crack patterns showed a flexural mode of failure in the top slab [5].
This research aims to conduct comprehensive physical tests and analytical investigations on the performance of RC tunnels (single-cell type) under various loading conditions. The study will focus on examining the effects of confinement and in-confinement conditions on the vertical loading capacity of the tunnels, as well as the impact of horizontal one-way cyclic loading capacity with changing vertical load values. Additionally, the research will investigate the loss of both vertical and horizontal loading capacity with different percentages of corrosion. By analyzing the results of these investigations, the study aims to provide insights into the behavior of RC tunnels (single-cell type) under diverse loading scenarios and identify potential areas for improvement in their design and maintenance.
Methods
The small-scale mortar tunnel experiments were conducted using manual load cell tests to investigate the behavior of underground structures under vertical and horizontal cyclic loading conditions. The study also explored the differences between confinement and unconfinement conditions for vertical loading. As it was challenging to test horizontal loading under confinement conditions, vertical loading testing was conducted for the unconfinement test to ensure that the capacity between the two conditions did not significantly affect the results. Due to resource constraints, not all rebar was connected to the power supply used for corrosion testing. The specimens were designed to investigate the effects of changing several variables, including soil condition, the percentage of vertical load under horizontal cyclic loading, and the extent of corrosion under both vertical and horizontal loading.
Test setup
Figure 1 illustrates the vertical loading test setup and instructions used in the study. The tests were conducted on a specimen placed in compact sand with a minimum depth of fifty centimeters, and bottom fixed boundary condition. A single load variable differential transformer (LVDT) was employed to measure the vertical displacement at the top slab. A group of specimens was used to compare the vertical capacity with and without confinement. To provide a more realistic simulation, the diameter of the specimens could not exceed 95 cm, due to resource constraints. The sand basin pot was made from an incompressible steel sheet, and the specimen was closed during testing from its two sides using a wooden sheet and bonding material, then filled with h-soil equal to 20 cm.

Vertical test setup
Figure 2 depicts the horizontal cyclic loading test setup and instructions used in the study. The specimen was secured to the table with four bolts, with the specimen’s geometric center aligned with the vertical load. The vertical load was applied to one-third of the length of the upper slab, and the vertical displacement was measured at the middle geometric center of the top slab during both vertical and horizontal cyclic loading. As the vertical load decreased during horizontal loading, the vertical loading was increased to the necessary loading percentage. The horizontal loading was applied at the middle geometric center of the upper top slab, and the horizontal displacement was measured using three LVDTs, two of which were located at the top point of a wall, while the remaining LVDT was at the bottom of the wall. The measurements from the two LVDTs at the top were averaged, and then the resulting value was subtracted from the bottom LVDT measurement.

Horizontal one-directional cyclic test setup
Figure 3 shows the author’s corrosion preparation setup and instructions. A conductive wire was connected around all rebar reinforcement before the pouring process. The corrosion specimens were treated as all other specimens with pure water for 28 days. The corrosion specimens then were placed in a container filled with a 5% NaCl solution and an electrical current of 0.2 A as shown in Eq. 1 was used to determine the time for specific corrosion percentages [6].

Artificial electrical corrosion method
Eight specimens were poured for four corrosion parentage. Each corrosion percentage specimen was tested under vertical loading and the other for horizontal cyclic loading. The weight of specimen rebar reinforcement was measured before pouring and after testing (JCI method) to verify Eq. 1 as shown in Table 1.
Specimen’s dimensions and reinforcement arrangement
The specimens’ dimensions were made from a designed utility tunnel dimensions with a scale down of one-eighth. Plywood was used as the formwork. Figure 4 shows the author’s final specimens’ dimensions. The rebar reinforcement was also scaled down with the same percentage taking into account the difference in rebar reinforcement yield stress (Fy) value. The reinforcement value takes into consideration the location of the extreme bending moment. Figures 5, 6 and 7 shows the rebar reinforcement of small-scale specimens.

Section dimensions arrangement of specimens

Section reinforcement arrangement of specimens

Stress-strain curve for bar diameter (1.9 mm)

Stress-strain curve for bar diameter (3.0 mm)
Material properties
Normal-weight concrete of c40 was used with a fine aggregate only (sand) size of 4.75 mm. For each mortar mix, three standard cubes (15 × 15 × 15 cm) samples and three small cubes (7.5 × 7.5 × 7.5 cm) samples were prepared at the time of casting the small-scale RC tunnel specimens. These mortar cubes were cured alongside the small-scale RC tunnel specimens and tested on the day of the specimen test. Because of small-scale specimens, non-commercial reinforcement was used. An “Addibond 65” was added to a mortar with water 1:3 to improve mortar bond strength. “Addibond 65” is a latex dispersion admixture based on styrene-butadiene rubber and is used for improving the properties of cement mortar and concrete, specifically with regard to rebar bond strength. It complies with ASTM C 1059, CMBI TECH. SPECS. No. CMBI 2012. An “Addicrete BV” was added to a mortar to increase workability. “Addicrete BV” is a water-reducing plasticizer and following concrete admixture. It complies with ASTM C 494-type A, EN 934–2, and ES 1899–1. Its normal dosages range from 0.15 to 0.3% of cement weight (about 0.5–1 kg/m3 concrete or 0.25–0.5 kg/100 L of water). Table 2 shows the actual mechanical properties of rebar reinforcement.
The proportions of components in a mortar mixture are determined based on the desired mortar properties and its intended use. These proportions are expressed as ratios of the components by volume or weight. Factors such as durability, strength requirements, environmental conditions, and application method are considered when establishing the proportions. Standardized guidelines or specifications may exist for specific applications, and adherence to these guidelines is crucial to ensure the mortar meets the required standards. Before pouring the specimens, the mortar’s properties were confirmed to meet the necessary criteria. Table 3 presents the final ingredients used in all specimen groups, while Table 4 displays the actual compressive strength of the crushed cubes during specimen pouring.
Loading procedure and measurement
The RC tunnel specimen was tested in a manual load cell with a capacity not exceeding 3 tons. The load is increased gradually firstly with load control methodology, then with displacement control methodology at an average rate of 0.1 mm/min. especially in horizontal cyclic loading. Figures 8, 9, 10 and 11 illustrate vertical and horizontal loading criteria. There are two types of loading methods applied to specimens: load control and displacement control. In load control methodology, each horizontal cycle is loaded at a constant rate of load in minimal time. For example, if the maximum load for the first cycle is 100 kg before unloading, the second cycle would be loaded with 200 kg before unloading. This means that the maximum load for each cycle increases by 100 kg. On the other hand, displacement control involves increasing each cycle by a constant maximum displacement, regardless of the load magnitude. Measurements were terminated when the applied load dropped with a marked value. In the confined vertical load test, the LVDT is inside the tunnel that impeded into the soil, so the LVDT did not read the actual soil displacement, and its reading was started with time from zero.

Load versus time along one of the vertical loading tests

Displacement versus time along the same sample vertical loading tests

Load versus time along one of the horizontal loading tests

Displacement versus time along the same sample horizontal loading tests
Results and discussion
The main focus of the experiments was to study the collapsing nature of underground structures under different loads and to investigate the long-term effect of rebar reinforcement corrosion on these types of structures. The results suggest that the corrosion of rebar reinforcement is a crucial factor that affects the stability of underground structures over time.
Overall, this section provides an analysis of the experimental results and sheds light on the behavior of small-scale mortar tunnels under various loads. The findings can be useful in designing more robust and durable underground structures that can withstand different types of loads and environmental conditions.
Experimental observations
All specimens of the test type exhibited similar behavior and failure. An inclined crack, as depicted in Fig. 12, emerged at approximately 75% of the maximum loading capacity. The crack spread beneath the two vertical loading rods, the top surface of the confined bottom slab, and the opposing wall from the horizontal load. Subsequently, the crack increased rapidly in width, causing the applied load to decrease suddenly. The crack in the top of the bottom slab is attributable to the soil's reaction.

General failure pattern of different types of tests
The appearance of an inclined crack is significant because it suggests that the material was subjected to tensile stress in a direction that was not aligned with the loading direction. This can be caused by a variety of factors, such as uneven loading.
The propagation of the crack through multiple areas of the specimen suggests that the material was not able to withstand the applied load, and the crack grew until the specimen was no longer able to support the load.
Result of confinement factor on vertical load test
Figures 13, 14 and 15 compare the recorded load–displacement curves and crack patterns for confinement and unconfinement tests. As illustrated, the confinement condition gives more load capacity and deformations than unconfinement. The difference in load capacity between confinement and the unconfinement test was within 5%. This minor difference in load capacity gives a good view of horizontal cyclic load tests without confinement conditions. The deformation of specimens in confinement conditions was more than in the unconfinement conditions due to soil reactions. As indicated in crack pattern figures, there were not specimens that failed in a shear for the confinement test although there were specimens that failed in the shear for unconfinement due to non-uniform loading.

Vertical load-displacement curve of G02-S02 and S04

Crack pattern for unconfinement specimen G02-S04-VUN

Crack pattern for confinement specimen G02-S02-VCO
Result of horizontal cyclic loading capacity test
During the test, the specimen was subjected to a series of cyclic horizontal loads that simulate the effects of real-world forces such as construction vertical loads, earthquakes, or vehicular traffic. The loads are applied using a manual load cell, and the response of the structure is measured using LVDTs and monitoring equipment. The test started with load control criteria and then displacement load criteria. This section illustrates horizontal cyclic loading capacity test results with the different percentages of maximum vertical capacity (nominal) unconfinement that acted as surcharge loads.
The test was typically conducted until the structure reached a specified failure criterion, which may include a specific displacement, deformation, or cracking level. The results of the test can be used to evaluate the performance of the structure, identify potential weaknesses, or design flaws, and inform future design improvements.
Horizontal cyclic loading capacity tests are often used to design and construct critical infrastructure such as bridges, high-rise buildings, and offshore structures. They are also used to research and develop new building materials and construction techniques to ensure their safety and durability under real-world conditions. Table 5 shows the test results commentary.

Horizontal cyclic load-displacement curve under zero vertical loads for G03-S03-HV0

Crack pattern for specimen G03-S03-HV0

Horizontal cyclic load-displacement curve under 1.0-ton vertical loads for G03-S01-HV1

Crack pattern for specimen G03-S01-HV1

Horizontal cyclic load-displacement curve under 1.6-ton vertical loads for G03-S02-HV1.6

Crack pattern for specimen G03-S02-HV1.6

Horizontal cyclic load-displacement curve under 2.5-ton vertical loads for G03-S04-HV2.5

Crack pattern for specimen G03-S04-HV2.5
Result of rebar reinforcement corrosion effect
Rebar reinforcement corrosion was a common problem in reinforced concrete structures, especially in harsh environments such as marine environments or areas with high levels of pollution. Corrosion of the rebar can lead to a reduction in the cross-sectional area, weakening the structural integrity of the concrete and potentially leading to structural failure. The corrosion of rebar reinforcement occurs due to the presence of chloride ions, which penetrate the concrete and react with the steel to form rust. The rust expands and can cause cracking and spalling of the concrete, further exposing the rebar to the environment, and accelerating the corrosion process.
Chloride ions were negatively charged ions that are formed when chlorine atoms gain an extra electron. They are highly soluble in water and are present in many natural and man-made environments, including seawater, soil, and industrial waste. The amount of chloride ions that can penetrate the concrete depends on several factors, including the chloride concentration in the environment, the permeability of the concrete, and the thickness of the concrete cover over the reinforcement. If the concentration of chloride ions exceeds a certain threshold, corrosion of the reinforcement may occur. Table 6 shows the results commentary of horizontal and vertical loading capacity test under corrosion effect.

Effect of confinement vertical load-displacement capacity under changing corrosion percentage on the group (G04) specimens

Crack pattern for specimen G04-S05 (6.3%)-VCO

Crack pattern for specimen G04-S06 (13.4%)-VCO

Crack pattern for specimen G04-S07 (13.5%)-VCO

Crack pattern for specimen G04-S08 (23.4%)-VCO

Effect of horizontal load-displacement capacity under changing corrosion 4.1% on the specimen G01-S01 (4.1%)-HVO

Crack pattern for specimen G04-S01 (4.1%)-HVO

Effect of horizontal load-displacement capacity under changing corrosion 10.2% on the specimen G01-S03 (10.2%)-HVO

Crack pattern for specimen G04-S03 (10.2%)-HVO

Effect of horizontal load-displacement capacity under changing corrosion 12.0% on the specimen G04-S02 (12.0%)-HVO

Crack pattern for specimen G04-S02 (12.0%)-HVO

Effect of horizontal load-displacement capacity under changing corrosion 19.4% on the specimen G04-S04 (19.4%)-HVO

Crack pattern for specimen G04-S04 (19.4%)-HVO
This section has presented details of the results and crack pattern details of analytical tests of vertical load capacity, and horizontal cyclic load capacity on underground structures, and studied the effect of corrosion with time. The following conclusion may be drawn:
-
(a)
The confinement and unconfinement with bottom rigid boundary condition results of vertical load capacity appeared that the change in load capacity is within 5%.
-
(b)
As shown in Fig. 19, there were shear failure crack patterns with need to be studied more and how to avoid this brittle failure.
-
(c)
As shown in Fig. 37, envelope curves of cyclic loading illustrated that the horizontal cyclic load capacity decreased with a decrease in the vertical surcharge load although it has given a large deformation with a decrease in the surcharge vertical load. This due to, lateral loads generate moments and shear forces in the walls, while vertical loads generate axial compression and moments in the walls. Thus, the reduction of compression forces due to vertical loads decreases lateral capacity under lateral loads.
Fig. 37 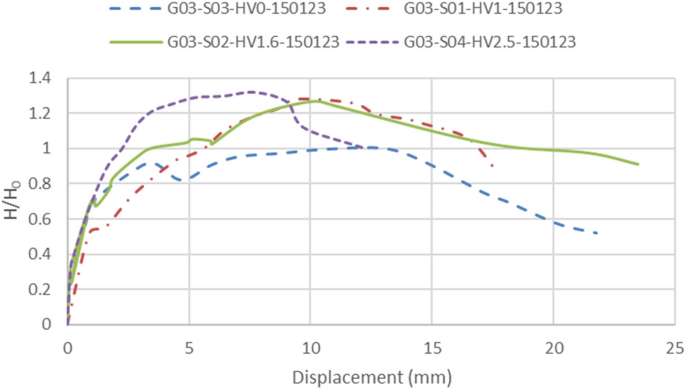
Envelope curves of horizontal cyclic loading under different nominal loads
-
(d)
Figure 38 illustrated the effect of corrosion under cyclic loading using envelope curves, it shows also that failure shapes of all corrosion percentages except 4.1% were different from specimens with no corrosion percentage.
Fig. 38 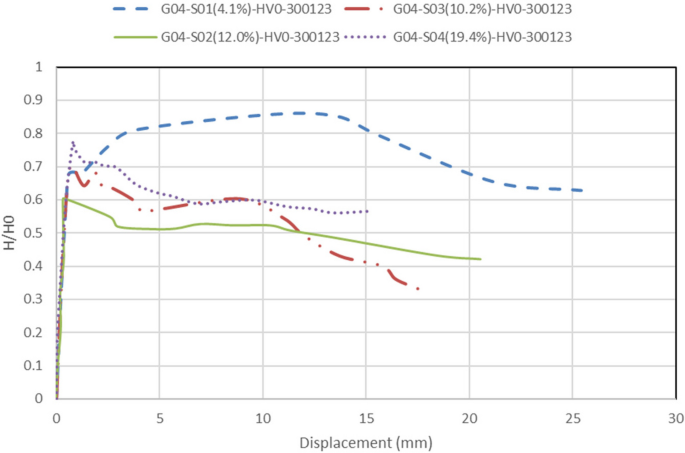
Envelope curves of horizontal cyclic loading under different corrosion percentages
-
(e)
As shown in Fig. 38 G04-S04 (19.4%)-HV0 results, that was a problem with the maximum horizontal load capacity. The maximum horizontal load is larger than 12% corrosion; this may be because of the non-corrosion uniformity.


Design charts
The results indicate that increasing the vertical load leads to an increase in the one-directional horizontal load capacity, but decreasing the vertical load leads to a decrease in the one-directional horizontal load capacity as shown in Fig. 39.

Effect of horizontal cyclic loading on the vertical load variation
The results shown in Fig. 40 summarize the reinforcement corrosion effect on the reduction of vertical loading capacities.

Corrosion effect on changing vertical load capacities
The results shown in Fig. 41 summarize the reinforcement corrosion effect on the reduction of one-directional horizontal loading capacities.

Corrosion effect on changing horizontal load capacities
Conclusions
This research aimed to gain a comprehensive understanding of the design of underground structures by examining their response to a variety of factors. The research project includes physical testing. The primary components of this thesis report are as follows:
-
(a)
The crack patterns observed in the confined specimens reveal cracks originating from the bottom of the top slab and the top of the bottom slab. Comparison of crack patterns from confined and unconfined cracks reveals that the confinement tests did not exhibit shear failures, unlike the un confinement tests, which experienced shear failures attributed to non-uniform loading.
-
(b)
In horizontal cyclic one-directional load tests, the crack patterns exhibit pronounced cracks at the middle of the wall. As the vertical sustained load increases, the crack patterns become even more aggressive.
-
(c)
In the tests conducted on corroded vertical confined specimens, the crack patterns were similar to those of non-corroded vertical confined specimens, except for wider crack widths. Clear evidence of flexure shear crack patterns was observed.
-
(d)
In the tests conducted on corroded horizontal one-directional cyclic specimens, the crack patterns were similar to those of non-corroded horizontal one-directional cyclic specimens, except for wider crack widths.
-
(e)
Impact of confinement on vertical load capacity indicated that the change in load capacity was minimal, with a difference not exceeding 5% between confinement and un-confinement conditions.
-
(f)
Confinement led to larger deformations with 25% from unconfined specimens due to the interaction between the soil and structure, as compared to un-confinement conditions.
-
(g)
By increasing the vertical sustained load to approximately 0.3, 0.5, and 0.75 times the maximum vertical unconfined load test, the one-directional horizontal load capacity increased by 1.28, 1.3, and 1.32 respectively compared to the horizontal onedirectional cyclic test performed with zero vertical load. This was accompanied by a subsequent decrease in deformations.
-
(h)
Because of, lateral loads generate moments and shear forces in the walls, while vertical loads generate axial compression and moments in the walls. Thus, the reduction of compression forces due to vertical loads decreases lateral capacity under lateral loads.
-
(i)
The corrosion levels 6.28, 13.39, 13.46, and 23.39 are directly associated with the decrease in vertical load capacities with 0.74, 0.66, 0.61, and 0.52 respectively.
-
(i)
The corrosion levels 4.14, 10.16, and 12.03 are directly associated with the decrease in horizontal one-directional cyclic load capacities with 0.86, 0.7, and 0.6 respectively. Simultaneously, it leads to un proportional decrease in deformations also.
Availability of data and materials
The datasets used and/or analyzed during the current study are available from the corresponding author on reasonable request.
Abbreviations
- RC :
-
ٌٌReinforced concrete
- D :
-
Depths of specimen
- LVDT:
-
Load variable differential transformers
- Rft:
-
Reinforcement
- F u :
-
Ultimate stress of rebar
- F y :
-
Rebar reinforcement yield stress.
- E :
-
Material Young’s modulus
- F cu :
-
Cube compressive stress at age 28 days
- F y :
-
Yield stress of rebar
- Ɛ :
-
Strain of rebar
- Ɛ y :
-
Yield strain of rebar
- P :
-
Vertical load at any point
- P 0 :
-
Normalized vertical confinement maximum load at zero corrosion percentage
- P u :
-
Maximum vertical unconfinement load
- P max :
-
Maximum vertical confinement load at any corrosion percentage
- Ɣ :
-
Vertical displacement at any point
- Ɣ 0 :
-
Normalized vertical displacement corresponding to normalized vertical confinement load
- Ɣ max :
-
Vertical confinement displacement corresponding to maximum confinement vertical load
- H :
-
Horizontal load at any point
- H 0 :
-
Normalized horizontal cyclic maximum load at zero vertical loads and zero corrosion percentage
- H max :
-
Maximum horizontal cyclic load
- Δ:
-
Horizontal displacement at any point
- Δ0 :
-
Normalized horizontal cyclic displacement corresponding to normalized horizontal load
- Δmax :
-
Horizontal displacement corresponding to maximum horizontal load
- R 2 :
-
The coefficient of determination
- Δw :
-
Corrosion amount
- C:
-
Bond parameter
References
Wang W, Wang T, Su J, Lin C, Seng CR, Huang TS (2001) Assessment of damage in mountain tunnels due to the Taiwan Chi-Chi Earthquake. Tunn Undergr Space Technol 16(3):133–150. https://doi.org/10.1016/s0886-7798(01)00047-5
Konagai K, Numada M, Zafeirakos A, Johansson J, Sadr A, Katagiri T (2005) An example of landslide-inflicted damage to tunnel in the 2004 Mid-Niigata Prefecture earthquake. Landslides 2(2):159–163. https://doi.org/10.1007/s10346-005-0057-1
Fujino Y, Siringoringo DM (2020) Recent research and development programs for infrastructures maintenance, renovation, and management in Japan. Struct Infrastruct Eng 16(1):3–25. https://doi.org/10.1080/15732479.2019.1650077
Takafumi, M., Matsumura, T., Endo, T. and Tachibana, Y. (2002). “Simulation of loading test of an RC box culvert with induced corrosion,” proc. Of JCI annual conference 24(2):1297–1302. https://framcos.org/framcos5/matsuo.simulation.pdf. (in japanese)
Okhovat & Maekawa, K. (2010). Damage control of underground RC structures subjected to service and seismic loads. A thesis submitted to the University of Tokyo, Japan, in partial fulfillment of the requirements for the degree of Doctor of Philosophy
Li Q, Jin X, Yan D, Fu C, Xu J (2021) Study of wiring method on accelerated corrosion of steel bars in concrete. Construct Build Mater 269:121286. https://doi.org/10.1016/j.conbuildmat.2020.121286
Acknowledgements
Not applicable.
Funding
Not applicable.
Author information
Authors and Affiliations
Contributions
All authors read and approved the final manuscript.
Authors’ information
Not applicable.
Corresponding author
Ethics declarations
Competing interests
The authors declare that they have no competing interests.
Additional information
Publisher’s Note
Springer Nature remains neutral with regard to jurisdictional claims in published maps and institutional affiliations.
Rights and permissions
Open Access This article is licensed under a Creative Commons Attribution 4.0 International License, which permits use, sharing, adaptation, distribution and reproduction in any medium or format, as long as you give appropriate credit to the original author(s) and the source, provide a link to the Creative Commons licence, and indicate if changes were made. The images or other third party material in this article are included in the article's Creative Commons licence, unless indicated otherwise in a credit line to the material. If material is not included in the article's Creative Commons licence and your intended use is not permitted by statutory regulation or exceeds the permitted use, you will need to obtain permission directly from the copyright holder. To view a copy of this licence, visit http://creativecommons.org/licenses/by/4.0/. The Creative Commons Public Domain Dedication waiver (http://creativecommons.org/publicdomain/zero/1.0/) applies to the data made available in this article, unless otherwise stated in a credit line to the data.
About this article

Cite this article
Abdelaal, A., Youssef, A. Experimental investigation on corroded and non-corroded RC tunnels under different loading conditions. J. Eng. Appl. Sci. 70, 146 (2023). https://doi.org/10.1186/s44147-023-00306-5
Received:
Accepted:
Published:
DOI: https://doi.org/10.1186/s44147-023-00306-5