
Abstract
Background
The protein source from fish meal is very important in trout feeding, but it is expensive and very scarce. Alternative nutrient sources are required to achieve sustainability as trout production rapidly grows in Peru. The objective of this research was to determine the proximate chemical composition and the apparent digestibility coefficient (ADC) of dry matter, organic matter, crude protein, crude fat, and digestible energy of hydrolyzed sheep (HSS) and alpaca (HSA) skins in juvenile rainbow trout.
Methods
A total of 450 fishes were randomly distributed in nine digestibility tanks, with 60.0 ± 1.32 g of initial weight and 6.4 kg/m3 of stocking density. The water quality parameters were as follows: pH 8.4, temperature 11.5 °C, and dissolved oxygen 6.2 mg/l. The skin hydrolysates were treated at 130 °C with 15 psi pressure for 120 min. Fish were fed a reference diet and an experimental diet containing 70% reference diet and 30% skin hydrolysate. The ingredients of the diets were mixed and then extruded at 95 °C with 4-mm diameter (Extruder Khal® EE800). The ADC was determined by the indirect method using insoluble ash as a non-digestible marker.
Results
The ADC in HSS and HSA was similar for dry matter (67.7 vs 69.1%), organic matter (66.9 vs 68.2%), crude protein (70.4 vs 70.1%), and digestible energy (3.35 vs 3.24 Mcal/kg DM), but crude fat values were different (12.3 vs 48.0%; p < 0.001, respectively).
Conclusion
The hydrolyzed sheep and alpaca skins had a high content of macronutrients with an acceptable apparent digestibility of nutrients, making them a viable alternative to improve the nutritive value of more economical feeds for rainbow trout feed.
Background
In recent years, Peru has become one of the main producers and exporters of fishmeal and fish oil; consequently, Peruvian aquaculture is expected to grow about 121% between 2016 and 2030 (FAO 2018). The production of rainbow trout (Oncorhynchus mykiss) has also been increased significantly lately, and in the Puno region alone, has reached ~ 43,290 t per year ([PRODUCE] Ministerio de la Producción 2017).
Trout are carnivorous, freshwater, predatory fish that require higher levels of protein and lipid from animal sources than other livestock species. Due to its high nutritional value, fish meal is generally included in feed. However, fish meal is relatively expensive and its production is constantly decreasing (Huntington and Hasan 2009). Therefore, evaluating new dietary protein sources from vegetables and animal origin for rainbow trout is important. Studies in rainbow trout have shown that it is possible to substitute raw materials, such as vegetables (Adelizi et al. 1998; Zhang et al. 2012; Daniel 2018; Ortiz-Chura et al. 2018) or other animal protein sources (Pfeffer et al. 1994; Steffens 1994; Pares-Sierra et al. 2014; Javaherdoust et al. 2019), in replace for fish meal without significantly affecting the nutrition composition and biological performance of the fish.
Rendered byproducts such as feathers and skins (collagen, elastin, and keratin) from domestic animal slaughterhouses are protein sources that could be used in fish feed (Cheng and Hardy 2002; Bureau 2006). However, the structure of the proteins and the disulfide bonds (S–S) of sulfur amino acids hinder digestion and limit the use of these byproducts. Thermal vapor pressure hydrolysis is a physical treatment that makes it possible to simplify complex molecules into simple components, improving the nutritional quality and value, as well as the availability of amino acids in animal byproducts (Moritz and Latshaw 2001). Feather hydrolysate has been proved to have high digestibility in rainbow trout (Bureau et al. 1999), and enzymatic treatment in the white shrimp improves amino acid utilization (Mendoza et al. 2001; Pfeuti et al. 2019).
The largest production of sheep (Ovis aries) and alpacas (Vicugna pacos) is in the Puno region of Peru. At the moment, the skins from sheep and alpacas do not have any commercial importance (Pacsi 2016), and interest in using these organic byproducts for animal nutrition has lagged by Peruvian producers. However, recently, the use of sheep and alpaca skin hydrolysates in feed rations for dairy cows, under natural hypobaric conditions, was beneficial for milk production and in reducing ration costs (Cahuascanco-Quispe et al. 2019). This result gives us to understand that we can also use these byproducts in rainbow trout feeding.
Therefore, a better understanding of the nutrient content and nutrient digestibility of the hydrolyzed skins of sheep and alpacas in juvenile trout feeding is very useful as the skins may be a less expensive nutrient source than fish meal. This research was conducted to determine the nutritional composition and apparent digestibility of dry matter, organic matter, crude protein, crude fat, and digestible energy of skin hydrolysates from sheep and alpaca (Pioval-2® meal) in juvenile rainbow trout.
Methods
Location
Experimental procedures were carried out in the Animal Nutrition Lab of Veterinary Medicine and Zootechnics Faculty at the National University of the Altiplano, Puno, Peru, at an altitude of 3828 m (15° 49′ 29″ S, 70° 00′ 56″ O). The digestibility assay was performed in a sedimentation column water recirculation system (0.5 l/s) equipped with a closed water treatment system, gravel filter (STF Filter System® Leri Model 002737), activated carbon filter, biological filter (clays with nitrifying bacteria, Proline®), and UV filter (X-Ray UV Light Boyo®, China).
Hydrolyzed skins of sheep and alpacas
Sheared dry skins of sheep and alpacas obtained from a wool and fiber local commercial were cut, washed, and then hydrolyzed at 15 psi and 130 °C for 120 min in a 25 l capacity autoclave (All American®) equipped with a manometer, thermometer, and thermostat to control the temperature and pressure. The hydrolyzed skins of sheep (HSS) and alpacas (HSA) were then dried, ground, sieved, and stored until use.
Experimental diets
The ingredients and chemical composition of experimental diets are shown in Table 1. Three diets (a reference diet and two experimental diets) were evaluated in triplicate. The reference diet was formulated based on the nutritional requirements for trout ([NRC] National Research Council 2011). The experimental diets were composed of 70% reference diet and 30% of either HSS or HSA, according to the methodology proposed by Glencross et al. (2007). The ingredients of the diets were mixed and then extruded at 95 °C (Extruder Khal® EE800, Germany) with a 4-mm pellet size.
Fish and experimentation conditions
A total of 450 juvenile rainbow trout from a commercial line (Troutlodge®, USA) were used. The fish had an initial mean weight of 60.0 ± 1.32 g (Alexander Mobba-Excell® SI-130) and a total mean length of 17.9 ± 0.93 cm (Ichthyometer, Aquatic Eco-Systems®). The trout was handled after being sedated with 20 mg/l tricaine methane sulfonate (MS 222, Argent Chemical Laboratories, Redmond, WA, USA). The fish were randomly distributed into tanks specially designed to measure the digestibility of their feed (Fig. 1) with an average loading density of 6.4 kg/m3. Each digestibility tank (500 l capacity) had a sedimentation unit for fecal collection adapted from Rodehutscord et al. (2000). The average water quality parameters were as follows: pH 8.4, temperature 11.5 °C (Peachimeter SI Analytics Lab 850®, Germany), and dissolved oxygen 6.2 mg/l (HI 9146 Hanna® Dissolved Oxygen Meter).
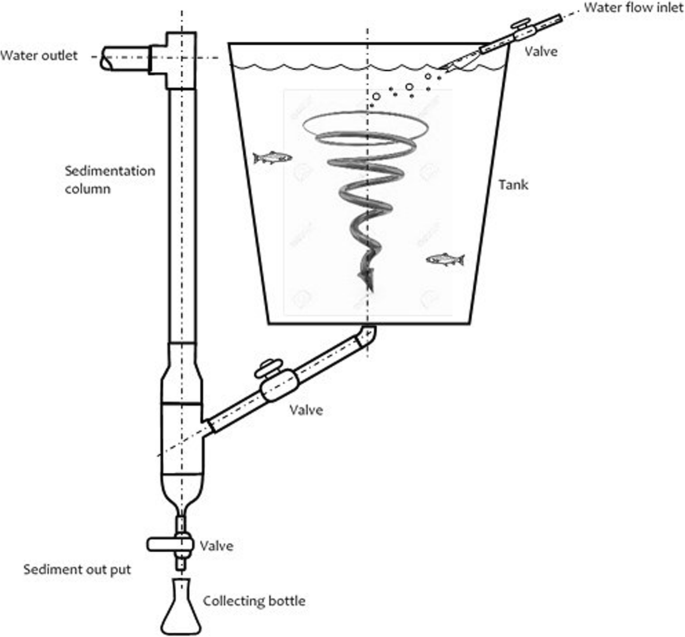
Sedimentation system and collection of feces (adapted from Rodehutscord et al. 2000)
Determination of apparent digestibility
The apparent digestibility of the feed was determined by the indirect method of using an indigestible marker such as acid-insoluble ash (Hyflo Super Cel®) as previously described (Atkinson et al. 1984; Vandenberg and De La Noue 2001). Fish were given 7 days to become accustomed to the diet, followed by 7 days of fecal collection, and then, they were raised until 40 days to determine the performance of productive parameters.
The experimental diets were supplied twice a day (10:00 and 16:00 h). After feeding, all feed waste was removed from the system and collected directly from the sedimentation bottle. The experiment was performed under a natural light regime (range during experiment from 12:36 to 12:10 daylight hours).
The apparent digestibility of dry matter (DM), organic matter (OM), crude protein (CP), crude fat (CF), and digestible energy (DE) was determined using Eq. (1) proposed by Forster (1999).
where AD is the apparent digestibility (%), MD is the marker in the diet (%), MF is the marker in the feces (%), NF is the nutrient in the feces (%), and ND is the nutrient in the diet (%).
The apparent digestibility of DM, OM, CP, CF, and DE from the hydrolysates was estimated according to Eq. (2) proposed by Sugiura et al. (1998).
where ADi is the apparent digestibility of the ingredient under study (%), ADCt is the apparent digestibility coefficient of the diet evaluated, ADCb is the apparent digestibility coefficient of the reference diet (%), Db is the nutrients of the reference diet (%), Dt is the nutrients of the experimental diet (%), s is the proportion of the ingredient evaluated in the diet, and 1-s is the proportion of the reference diet in the experimental diet.
Proximal composition of test ingredients, diets, and feces
The DM, OM, CP, CF, gross energy (GE), and DE of the hydrolyzed skins of sheep (HSS) and alpacas (HSA) were determined. The ingredients, feed, and feces were analyzed according to the methodology of the [AOAC] Association of Official of Analytical Chemists (2011). Furthermore, GE was determined with a pump calorimeter (Parr Instrument 6772® USA). The non-digestible marker in diets and feces was determined according to the methodology proposed by Scott and Boldaji (1997).
Productive parameters
The initial weight, final weight, daily weight gain, feed consumed daily, and feed conversion rate of trout were controlled from 0 to 40 experimental days.
Statistical analysis
Data analysis was performed using the analysis of variance (ANOVA) procedure in the SAS statistical program (SAS Institute Inc 2004). Mean values were compared using the LS mean test. Differences were considered significant at p < 0.05.
Results
The chemical composition and GE between HSS and HSA were significantly different before digestion (Table 2): OM (92.6 vs 95.2%, p < 0.001), CP (69.2 vs 76.7%, p < 0.01), CF (12.0 vs 7.0%, p < 0.001), ash (7.4 vs 4.8%, p < 0.001), and GE (5.79 vs 5.41 kcal/g, p < 0.001), respectively. But DM content does show not significant difference between HSS and HSA (94.9 vs 94.5%, p > 0.05).
The apparent digestibility of DM and OM of the reference, HSS, and HSA diets were not different (Table 3). The reference diet did have a higher apparent digestibility than HSS and HSA for CP (92.5 vs 83.4 and 82.7%; p < 0.001), CF (92.2 vs 78.6 and 87.5%; p < 0.001), and GE (80.1 vs 73.3 and 74.0%; p < 0.001).
Also, the apparent digestibility of DM (67.7 vs 69.1%), OM (66.9 vs 68.2%), CP (70.4 vs 70.1%), and DE (3.35 vs 3.24 Mcal/kg) were not different between HSS- and HSA-containing diets (p > 0.05), respectively. The apparent digestibility of CF was statistically significant between HSS and HSA diets (12.3 vs 48.0%; p < 0.001).
The productive parameters (initial weight, final weight, weight gain daily, feed consumed daily, and feed conversion rate) of trout were similar for all treatments (p > 0.05) during the experiment (Table 4).
Discussion
The OM content between raw HSS and HSA was significantly different (Table 2). Both hydrolyzed meals contained more OM than the range observed in fish meal (Gaylord et al. 2008; Lee et al. 2020). The lower OM content in HSS was directly related to a higher ash content present in minerals ([AOAC] Association of Official of Analytical Chemists 2011). HSS probably contained more external foreign material than HSA, this is due to the higher value of ash present. Also, ash content higher than normal values in raw materials suggests some type of contamination for presence of sand or other dirt (Salgueiro et al. 2010). The CP content was higher for HSA than HSS while HSS had a higher CF content than HSA. It is well documented by [NRC] National Research Council (2011) that high levels of CP are directly related to low levels of CF in raw materials (soybean meal solvent extracted vs soybean full fat extruded). The GE content was higher for HSS than HSA because higher levels of fats provide more energy to the feed. Fats contain approximately two times more calories than protein ([NRC] National Research Council 2011). These results confirm that the carcasses of South American camelids (alpaca and llama) are, in general, leaner than carcasses of sheep (Cristofanelli et al. 2005; Farid 1991). However, the GE content of both hydrolyzed meals was within the range reported in fish meal (Gaylord et al. 2008; Lee et al. 2020).
The CP content in both HSS (69.2%) and HSA (76.7%) was adequate for feed. Bureau (2006) proposed that rendered animal protein values that range from 66 to 85% indicate good processing. While lower values indicate insufficient hydrolysis, higher values indicate excessive processing, which would affect the availability of amino acids. Variations in the composition of proteins from animal sources are due to the variability in the quality of ingredients and processing conditions, such as cooking time, temperature, pressure, and storage conditions before and after treatment (Papadopoulos et al. 1985).
The apparent digestibility of DM, OM, CP, and GE were not different between the experimental diets or between the hydrolyzed skin meals. However, the apparent digestibility of CF was higher for HSA than HSS, which would be related to the lower content of saturated fats in raw HSA. In fact, more saturated fats are less digestible than less saturated fats or oils (Hua and Bureau 2009), although these differences in the digestibility of CF are of little economic importance, due to the low fat content of HSS and HSA (12% and 7%, respectively).
In general, the digestibility of DM (~ 80%) and CP (~ 90%) of fish meal in trout is 10% and 20% higher than the skin hydrolysates, respectively. Recently, Lee et al. (2020) reported greater differences in DM digestibility (86.6%) and CP (84.1%) for two different types of fish meal. This difference was due to the high nutritional quality of fish meal, characterized by its high biological value of protein and high content of essential amino acids and unsaturated fatty acids (Daniel 2018). Our results suggest that skin hydrolysates could partially replace fish meal in feed, with little to no change in the biological performance of the fish (Table 4).
Cho and Kaushik (1990) reported that hydrolyzed feather meal has higher digestibility of DM (75%) and lower digestibility of CP (58%) than HSS and HAS. Similar values were reported by Lee et al. (2020) for feather meal digestibility (DM 67.6% and CP 70.6%). Feather meal achieves less hydrolysis during heat treatment than what occurs in skin hydrolysates from sheep and alpaca. The quality of feather meal protein is also lower, since it is mainly composed of fibrous protein (keratin), while skin tissue contains mostly elastin and collagen as a protein source (Zhang et al. 2005).
The average DE value of HSS and HSA was 3.30 Mcal/kg and is lower than fish meal, poultry byproduct meal, and meat-and-bone meal (Lee et al. 2020). However, it was higher than that of hydrolyzed feather meal (Gaylord et al. 2008). The nutritional value of poultry byproduct meal is similar to fish meal (Bureau et al. 1999), and 20 to 25% can be included in salmonid diets without affecting the growth or feeding efficiency of fish (Steffens 1994) because it has a protein digestibility greater than 80% (Cheng and Hardy 2002). The protein availability and subsequent digestibility increases because of small polypeptide chains or short chains of amino acids that are produced during the hydrolytic process (Silva et al. 2017).
The digestibility of both HSS and HSA is acceptable and could be used as a partial replacement for fish meal. Sheep and alpaca skins are potential sources of elastin, collagen, and keratin discarded by the rural producers in Peru. These “waste” materials can be hydrolyzed into a source of available protein to be used in the feed of aquatic species.
Conclusion
This study represents the first work carried out using skin hydrolysates from sheep and alpacas for trout feed. Based on the results, skin hydrolysates of both slaughter animals have a high content of nutrients and a digestibility of macronutrients lower than fish meal but greater than feather meal. Alpaca and sheep skin hydrolysates (Pioval-2® meal) are cost-effective sources of nutrients and can also be used to improve the nutritive value of more economical feeds and are a viable alternative for feeding rainbow trout in Peruvian rural conditions.
Availability of data and materials
The datasets generated and/or analyzed during the current study are not publicly available due to that the data was reported to the university’s research office but are available from the corresponding author on reasonable request.
Abbreviations
- ADC:
-
Apparent digestibility coefficient
- ADCb:
-
Apparent digestibility coefficient of the reference diet
- ADCt:
-
Apparent digestibility coefficient of the evaluated diet
- CP:
-
Crude protein
- Db:
-
Nutrients of the reference diet
- DE:
-
Digestible energy
- DM:
-
Dry matter
- Dt:
-
Nutrients of the test diet
- GE:
-
Gross energy
- HSS:
-
Hydrolyzed sheep skin
- HAS:
-
Hydrolyzed alpaca skin
- MD:
-
Marker in the diet
- MF:
-
Marker in the feces
- ND:
-
Nutrient in diet
- NF:
-
Nutrient in feces
- OM:
-
Organic matter
- s :
-
Proportion of the ingredient evaluated in the diet
- 1-s :
-
Proportion of the reference diet in the test diet
References
[AOAC] Association of Official of Analytical Chemists. Official methods of analysis, 18th ed. Association of Official Analytical Chemists. 2011. Gaithersburg, MD, USA.
[NRC] National Research Council. Nutrient requirements of fish and shrimp. Washington, DC: The National Academies Press. 2011. p392. https://doi.org/https://doi.org/10.17226/13039.
[PRODUCE] Ministerio de la Producción. Perú. Anuario Estadístico Pesquero y Acuícola 2017. Disponible en: http://ogeiee.produce.gob.pe/index.php/shortcode/oee-documentos-publicaciones/publicaciones-anuales/item/775-anuario-estadistico-pesquero-y-acuicola-2016; 203 p.
Adelizi P, Rosati R, Warner K, Wu Y, Muench T, White M, Brown P. Evaluation of fish-meal free diets for rainbow trout Oncorhynchus mykiss. Aquaculture Nutr. 1998;4:255–62. https://doi.org/10.1046/j.1365-2095.1998.00077.x.
Atkinson JL, Hilton JW, Slinger SJ. Evaluation of acid-insoluble ash as an indicator of feed digestibility in rainbow trout (Salmo gairdneri). Canadian J Fisheries Aquat Sci. 1984;41(9):1384–6. https://doi.org/10.1139/f84-170.
Bureau DP. Rendered products in fish aquaculture feeds. In DL. Meeker (ed). Essential rendering: all about the animal by-products industry. The National Renderers Association (NRA), 2006. USA. 315p.
Bureau DP, Harris AM, Cho CY. Apparent digestibility of rendered animal protein ingredients for rainbow trout (Oncorhynchus mykiss). Aquaculture 1999. 180: 345–358. https://doi.org/https://doi.org/10.1016/S0044-8486(99)00210-0.
Cahuascanco-Quispe B, Rodríguez-Huanca FH, Araníbar MJ. Efecto de la suplementación de proteína y energía sobre la producción láctea, densidad, sólidos totales, grasa y nitrógeno ureico en la leche de vacas Brown Swiss en condiciones hipobáricas naturales. Rev Inv Vet Perú 2019; 30(4): 1504-1514. http://dx.doi.org/https://doi.org/10.15381/rivep.v30i4.17168.
Cheng ZJ, Hardy RW. Apparent digestibility coefficients of nutrients and nutritional value of poultry by-product meals for rainbow trout Oncorhynchus mykiss measured in vivo using settlement. J World Aquaculture Soc. 2002;33(4):458–65. https://doi.org/10.1111/j.1749-7345.2002.tb00025.x.
Cho CY, Kaushik SJ. Nutritional energetics in fish: energy and protein utilization in rainbow trout (Salmo gairdneri). World Rev Nutr Diet. 1990;61:132–72. https://doi.org/10.1159/000417529.
Cristofanelli S, Antonini M, Torres D, Polidori P, Renieri C. Carcass characteristics of Peruvian llama (Lama glama) and alpaca (Lama pacos) reared in the Andean highlands. Small Ruminant Res. 2005;58(3):219–22. https://doi.org/10.1016/j.smallrumres.2004.10.004.
Daniel N. A review on replacing fish meal in aqua feeds using plant protein sources. Int J Fisheries Aquat Stud. 2018;6(2):164–79.
[FAO]. The state of world fisheries and aquaculture. Food and Agriculture Organization of the United Nations. 2018. 227p.
Farid A. Carcass physical and chemical composition of three fat-tailed breeds of sheep. Meat Sci. 1991;29(2):109–20. https://doi.org/10.1016/0309-1740(91)90058-x.
Forster L. A note on the method of calculating digestibility coefficients of nutrients provided by single ingredients to feeds of aquatic animals. Aquaculture Nutr. 1999;5(2):143–5. https://doi.org/10.1046/j.1365-2095.1999.00082.x.
Gaylord TG, Barrows FT, Rawles SD. Apparent digestibility of gross nutrients from feedstuffs in extruded feeds for rainbow trout, Oncorhynchus mykiss. J World Aquaculture Soc. 2008;39(6):827–34.
Glencross BD, Booth M, Allan GL. A feed is only as good as its ingredients – a review of ingredient evaluation strategies for aquaculture feeds. Aquaculture Nutr. 2007;13:17–34. https://doi.org/10.1111/j.1365-2095.2007.00450.x.
Hua K, Bureau DP. Development of a model to estimate digestible lipid content of salmonid fish feeds. Aquaculture. 2009;286:271–6.
Huntington TC, Hasan MR. Fish as feed inputs for aquaculture – practices, sustainability and implications: a global synthesis. In M.R. Hasan and M. Halwart (eds). Fish as feed inputs for aquaculture: practices, sustainability and implications. FAO Fisheries and Aquaculture Technical Paper. 2009. No. 518. Rome, Italy. 61p.
Javaherdoust S, Yeganeh S, Keramat A. Effects of dietary visceral protein hydrolysate of rainbow trout on growth performance, carcass composition, digestibility and antioxidant enzyme in juvenile Oncorhynchus mykiss. Aquaculture Nutr. 2019;00:1–11. https://doi.org/10.1111/anu.12975.
Lee S, Chowdhury MAK, Hardy RW, Small BC. Apparent digestibility of protein, amino acids and gross energy in rainbow trout fed various feed ingredients with or without protease. Aquaculture 2020. 524:735270. https://doi.org/https://doi.org/10.1016/j.aquaculture.2020.735270.
Mendoza R, Rios D, Vazquez A, Cruz C, Ricque E, Aguilera C. Fishmeal replacement with feather-enzymatic hydrolyzate co-extruded with soya-bean meal in practical diets for the Pacific white shrimp (Litopenaeus vannamei). Aquaculture Nutr. 2001;7:143–51.
Moritz JS, Latshaw JD. Indicators of nutritional value of hydrolyzed feather meal. Poult Sci. 2001;80:79–86.
Ortiz-Chura A, Pari-Puma RM, Rodríguez Huanca FH, Cerón-Cucchi ME, Araníbar MJ. Apparent digestibility of dry matter, organic matter, protein and energy of native Peruvian feedstuffs in juvenile rainbow trout (Oncorhynchus mykiss). Fisheries Aquat Sci 2018; 21:32. https://doi.org/https://doi.org/10.1186/s41240-018-0111-2.
Pacsi GL. Efecto del extracto de chirca blanca (Baccharis Dracunculifolia) en el proceso de curtición piel de ovino (Ovis orientalis aries) y piel de alpaca (Vicugna pacos) para la obtención de cueros wet-White. Tesis Ingeniero Agroindustrial. 2016. Universidad Nacional del Altiplano-Puno. http://repositorio.unap.edu.pe/handle/UNAP/3674.
Papadopoulos AR, Boushy E, Ketelaars AE. Effect of different processing conditions on amino acid digestibility of feather meal determined by chicken assay. Poult Sci. 1985;64:1729.
Pares-Sierra G, Durazo E, Ponce MA, Badillo D, Correa-Reyes G, Viana MT. Partial to total replacement of fishmeal by poultry by-product meal in diets for juvenile rainbow trout (Oncorhynchus mykiss) and their effect on fatty acids from muscle tissue and the time required to retrieve the effect. Aquaculture Res. 2014;45:1459–69. https://doi.org/10.1111/are.12092.
Pfeffer E, Wiesmann D, Henrichfreise B. Hydrolyzed feather meal as feed component in diets for rainbow trout (Oncorhynchus mykiss) and effects of dietary protein/energy ratio on the efficiency of utilization of digestible energy and protein. Archiv Für Tierernaehrung. 1994;46(1):111–9. https://doi.org/10.1080/17450399409381762.
Pfeuti G, Cant JP, Shoveller AK, Bureau DP. A novel enzymatic pre-treatment improves amino acid utilization in feather meal fed to rainbow trout (Oncorhynchus mykiss). Aquaculture Res. 2019:1–16.
Rodehutscord M, Borchert F, Gregus Z, Pack M, Pfeffer E. Availability and utilization of free lysine in rainbow trout Oncorhynchus mykiss. 1. Effect of dietary crude protein level. Aquaculture 2000; 187: 163–176. https://doi.org/https://doi.org/10.1016/S0044-8486(99)00389-0.
Salgueiro L, Martins AP, Correia H. Raw materials: the importance of quality and safety. A review. Flavour Fragr. J. 2010; 25, 253–271. Doi: 10.1002/ffj .1973.
SAS Institute Inc. SAS/STAT® 9.1 User’s Guide. Cary, NC: SAS Institute Inc. USA; 2004. p. 5121.
Scott TA, Boldaji F. Comparison of inert markers [chromic oxide or insoluble ash (Celite®)] for determining apparent metabolizable energy of wheat- or barley-based broiler diets with or without Enzymes. Poult Sci. 1997;76(4):594–8. https://doi.org/10.1093/ps/76.4.594.
Silva TC, Rocha JDM, Moreira P, Signor A, Boscolo WR. Fish protein hydrolysate in diets for Nile tilapia post-larvae. Pesqui Agropecuária Bras. 2017; 52(7): 485–492. https ://doi.org/10.1590/s0100-204x201700 0700002.
Steffens W. Replacing fish meal with poultry by-product meal in diets for rainbow trout (Onchorhynchus mykiss). Aquaculture. 1994;124:27–34.
Sugiura SH, Dong FM, Rathbone CK, Hardy RW. Apparent protein digestibility and mineral availabilities in various feed ingredients for salmonid feeds. Aquaculture. 1998;159(3–4):177–202. https://doi.org/10.1016/S0044-8486(97)00177-4.
Vandenberg GW, De La Noue J. Apparent digestibility comparison in rainbow trout (Oncorhynchus mykiss) assessed using three methods of faeces collection and three digestibility markers. Aquaculture Nutr. 2001;7(4):237–45. https://doi.org/10.1046/j.1365-2095.2001.00181.x.
Zhang Y, Øverland M, Shearer KD, Sørensen M, Mydland LT, Storebakken T. Optimizing plant protein combinations in fish meal-free diets for rainbow trout (Oncorhynchus mykiss) by a mixture model. Aquaculture. 2012;(360–361):25–36. https://doi.org/10.1016/j.aquaculture.2012.07.003.
Zhang Z, Li G, Shi B. Physicochemical properties of collagen, gelatin and collagen hydrolysate derived from bovine limed split wastes. J Soc Leather Technol Chem. 2005;90:23–8.
Acknowledgements
The authors appreciate the funding from the Research Office of the National University of the Altiplano for the conduct of the research.
Funding
Funding to conduct the reported research was provided by the research office of the Universidad Nacional del Altiplano.
Author information
Authors and Affiliations
Contributions
MJAA: he was responsible for the development of the research, experimental diet elaboration, and writing of the article manuscript. BRH: the co-author of the research developed the feed formulations for the trout experiment. HSPP: he was responsible for the development of the water recirculation system and modification of the digestibility tanks. FHRH: he conducted the digestibility experiment with trout and managed the animals for 40 days. MPBE: she performed the analysis of data produced during the experiment. HKAB: she worked in to develop the hydrolysis methodology of skin meal and its nutritional analysis. SFCH: he performed the laboratory analysis of the experimental tests. All authors read and approved the final manuscript.
Corresponding author
Ethics declarations
Ethics approval and consent to participate
This statement does not correspond.
Consent for publication
This statement does not correspond.
Competing interests
The authors declare that they have no competing interests.
Additional information
Publisher’s Note
Springer Nature remains neutral with regard to jurisdictional claims in published maps and institutional affiliations.
Rights and permissions
Open Access This article is licensed under a Creative Commons Attribution 4.0 International License, which permits use, sharing, adaptation, distribution and reproduction in any medium or format, as long as you give appropriate credit to the original author(s) and the source, provide a link to the Creative Commons licence, and indicate if changes were made. The images or other third party material in this article are included in the article's Creative Commons licence, unless indicated otherwise in a credit line to the material. If material is not included in the article's Creative Commons licence and your intended use is not permitted by statutory regulation or exceeds the permitted use, you will need to obtain permission directly from the copyright holder. To view a copy of this licence, visit http://creativecommons.org/licenses/by/4.0/.
About this article

Cite this article
Araníbar-Araníbar, M.J., Roque-Huanca, B., Portocarrero-Prado, H.S. et al. Nutritive value and digestibility of macronutrients from sheep and alpaca skin hydrolysates as a new alternative in juvenile rainbow trout (Oncorhynchus mykiss) feeding. Fish Aquatic Sci 23, 28 (2020). https://doi.org/10.1186/s41240-020-00174-7
Received:
Accepted:
Published:
DOI: https://doi.org/10.1186/s41240-020-00174-7