
Abstract
The nitrogen cycle and the associated microbes play an important role in natural ecosystems, including terrestrial habitats; they also have a major effect on climate change. The aim of this study was to explore microbial communities in rice paddy soil by detecting and quantifying some key functional genes involved in the nitrogen cycle using molecular techniques such as conventional polymerase chain reaction (PCR), clone library construction, sequencing, phylogenetic analysis, and real-time PCR. The genes analyzed were as follows: nitrogenase reductase gene (nifH), hydrazine synthase gene (hzsA), nitrous oxide reductase gene (nosZ), copper-containing (nirK) and cytochrome cd1-containing (nirS) nitrite reductase genes, nitrite oxidoreductase gene (nxrB), and ammonium monooxygenase gene (amoA). The sequence assessment using the clone library targeting these genes revealed high diversity and dominance of bacterial communities. Furthermore, real-time PCR using SYBR green dye and some primers specific for each gene revealed the high abundance of nxrB (4.1 × 10⁹ ± 0.4 × 10⁹ copies g−1 soil) and low abundance of hzsA (4.0 × 10⁵ ± 1.1 × 10⁵ copies g−1 soil). The findings of our study will be useful to explore microbial communities in terrestrial habitats, such as agricultural paddy fields.
Introduction
Soil is a mixture of organic matter, minerals, gases, water, and microorganisms, which together support life on earth. Soil is considered a major component of the earth’s ecosystem as it plays various roles owing to its physiochemical heterogeneity; for example, it acts as a carbon reservoir, water storage system, modifier of earth’s atmosphere, and habitat for plants and microorganisms including bacteria and fungi [1]. The high heterogeneity of soil may lead to the heterogeneity of habitats. A small amount of soil can contain up to one billion bacteria [2]. Furthermore, the diversity and composition of soil communities determine the functionality of an ecosystem [3]. Moreover, ecosystems are affected by processes occurring in the soil, especially those driven by microbes, such as the nitrogen cycle. The nitrogen cycle and the associated microbial communities play a crucial role in terrestrial habitats; they also have a major effect on the environment. They have been a subject of interest for researchers and the general public because the nitrogen cycle and the associated microbial communities determine the fate and availability of nitrogen, which is essential to support life [4].
The nitrogen cycle involves the transformation of nitrogen from one form to other. Nitrogen fixation, nitrification or ammonia oxidation, and denitrification are the major processes of the nitrogen cycle. Most of these processes are mediated by microbial communities, which obtain energy or accumulate nitrogen via these processes according to their growth requirements. In nitrogen fixation, nitrogen gas is transformed to ammonium by nitrogen-fixing bacteria. This process involves the nitrogenase enzyme, whose multiple subunits are encoded by nifH, nifD, and nifK (Rubio Lm 2002). Among these three genes, nifH has been the most sequenced and extensively used marker gene for studying phylogeny, diversity, and abundance of nitrogen-fixing bacteria [5, 6]. In nitrification, ammonia or ammonium is oxidized to nitrite, and this step is catalyzed by the ammonium monooxygenase enzyme encoded by amoA [7]. Nitrite is then oxidized to nitrate, which is catalyzed by nitrite oxidoreductases encoded by genes such as nxrB [8]. Mostly ammonia-oxidizing bacteria (AOB) and ammonia-oxidizing archaea (AOA) mediate the nitrification process [7]. Furthermore, with the discovery of anammox bacteria, it has been reported that ammonia oxidation is also anaerobically mediated by hydrazine synthase encoded by hzsA [9]. During denitrification, nitrate is reduced ultimately to nitrogen gas via a series of enzymatic reactions by diverse nitrogen oxide reductases encoded by nirS, nirK, and nosZ. Any disturbance in this process due to an imbalance in diverse nitrogen compounds might lead to negative consequences such as global warming and climate change. Therefore, understanding, investigating, and obtaining detailed information about the N cycle-related microorganisms are major requisites for improving the current state of the environment.
Although the nitrogen cycle has been investigated and reported in diverse types of soils such as agricultural field soils [10], acidic forest soils [11], paddy soils [12], intertidal soils [13], and wetland soils [14], information about these processes and probes for detecting specific genes is limited. The most widely used phylogenetic marker for studying microbial communities is the 16S rRNA gene. However, some microorganisms performing a common function are not numerically dominant and are hardly detectable using 16S rRNA gene-based probes. Thus, the use of functional gene markers has been the alternative approach for studying environmental samples. Furthermore, this method provides resolution below species level, because of the high evolutionary rates of the less conserved functional molecules [15, 16]. Considering the advantages of functional genes over the 16S rRNA gene, in the present study, we detected and quantified nitrogen cycle-related genes in a rice paddy field using functional gene markers.
Materials and methods
Rice paddy soil sampling
A rice paddy field site, located in Iksan, South Korea (latitude 35° 49′ 42.4" N and longitude 127° 02′ 38.4" E), was selected for soil sampling. Soil samples were collected at 20 cm depth from the surface of the field using a small shovel. Soil slurry with water was prepared at a ratio of 1:5 by shaking for 30 min in a shaker to measure pH and electrical conductivity using portable probes (Thermo Scientific, Pittsburgh, PA, USA).
DNA extraction from soil samples and conventional polymerase chain reaction
Genomic DNA was extracted from 0.25 mg of paddy soil using the MoBio Powersoil DNA kit (Carlsbad, CA, USA), following the manufacturer’s protocol. The DNA quantity was measured by fluorometry (Qubit 3.0 Fluorometer, Invitrogen, Pittsburgh, PA, USA). Genomic DNA was diluted with ultra-pure water to 1–5 ng µL−1 for further use. All the primers used in this study are summarized in Additional file 1: Table S1. The PCR mixture of total volume 50 µL contained 1–2 µL of 1–5 ng µL−1 genomic DNA and 1 µL each of 10 µM forward and reverse primers. The conditions for the PCR cycles for each target gene are summarized in Additional file 1: Table S2. The quality and quantity of the purified DNA were determined by gel electrophoresis and fluorometer, respectively.
Construction of clone libraries and confirmation of positive clones
Clone libraries were constructed by using DNA fragments of specific band sizes after amplification by PCR and purification. DNA amplicons were ligated into pTOP TA V2 (vector) using the TOP Cloner TA Kit (Enzynomics, Daejon, South Korea) or pLUG-Prime TA Cloning Kit II (Intron Biotechnology, Seongnam, South Korea) and transformed into Escherichia coli DH5α™ competent cells (Enzynomics, Daejon, South Korea). Blue–white screening was performed using ampicillin (0.1 mg mL−1), IPTG (0.1 mM), and X-gal (40 µg mL−1) in lysogeny broth (LB) agar plates. White colonies were selected and incubated overnight in LB broth supplemented with 100 µg mL−1 ampicillin. Plasmid DNA extraction was carried out using the Inclone Mini Plasmid Preparation Kit (Inclone biotech, Yongin, South Korea). The plasmid DNAs isolated from the white colonies were subjected to PCR amplification using the multiple cloning site (MCS) primer sets from the respective vector kits, M13F (-20) and M13R (-40) for pTOP-TA-V2 vector and M13F and M13R for pLUG-prime vector. The PCR product was checked on a 1% agarose gel to confirm positive clones. DNA isolated from the clone library was sequenced at Genotech (Daejeon, South Korea).
Phylogenetic analysis
The forward and reverse nucleotide sequences of cloned functional fragments of each gene were assembled together. The obtained sequences were compared with those in the NCBI GenBank by a BLAST search (https://blast.ncbi.nlm.nih.gov) [17] in order to identify known sequences, for each gene. Phylogenetic trees of the cloned sequences of each gene were constructed along with similar sequences retrieved from the GenBank using Mega 7 [18]. The evolutionary history was inferred using the neighbor-joining method [19, 20]. All the sequences were deposited in the GenBank with accession numbers as follows, nifH: MT109314-MT109333, amoA: MT140205-MT140224, nxrB: MT140190-MT140204, hzsA: MT140225-MT140241, nosZ1: MT140150-MT140169, nosZ2: MT140170-MT140189, nirS: MT140262-MT140281, and nirK: MT140242-MT140261, respectively.
Quantitative PCR analysis
qPCR was used to quantify nitrogen-fixing bacterial gene (nifH), nitrifying bacterial genes (nxrB and amoA), denitrifying bacterial genes (nirK, nirS, and nosZ), and anaerobic ammonia oxidizing bacteria-specific gene (hzsA). It was performed using the primer sets listed in Additional file 1: Table S1 and Greenstar Accupower Mastermix (Bioneer, Daejeon, South Korea), according to the manufacturer’s protocol, on the Biorad CFX Connect Real-Time System (Bio-Rad Laboratories, Inc., Hercules, CA, US). To calculate the gene copy numbers in a known concentration of DNA, Eq. 1 was used.
Each reaction was carried out with a mixture of total volume 20 μL, containing 10 μL of 2 × Greenstar qPCR master mix, 1 µL of DNA template, and 1 μL each of forward and reverse primer specific for each gene. To prepare the standard, the confirmed clones of each gene after sequencing were used as shown in Additional file 1: Table S3. Serial dilution was performed from 10−1 to 10−7. The PCR of the standard and unknown samples of each gene was performed in triplicate. The gene copy number of unknown samples was determined using the standard regression curves of gene copy number.
Results and discussion
Physico–chemical properties of soil
The soil was found to be slightly alkaline with a pH of 7.86. Soil electrical conductivity (EC1:5) was 12.7 dS m−1 indicating high salinity, as reported for saturated paste equivalent in all soils [21].
Functional gene amplification and clone library construction
Genomic DNA isolated from the paddy soils was used to amplify functional genes using specific primer sets. A comprehensive evaluation was conducted of PCR primers specific for the nitrogen fixation (nitrogenase reductase) gene, that is, nifH [6], using the IGK3/DVV primer set, this being the best with a wide coverage for environmental samples including soil samples. A DNA band of approximately 394 bp was noted. Similarly, primers covering a wide range of samples and with high specificity such as amoA-1F/amoA-2R specific for ammonium monooxygenase gene (amoA), nxrB169f/nxrB638r specific for nitrite oxidoreductase gene (nxrB), hzsA_382F/hzsA_1857R specific for hydrazine synthase gene (hzsA), nirKC2F/nirKC2R specific for copper-containing nitrite reductase gene (nirK), nirSC1F/nirSC1R specific for cytochrome cd1-containing nitrite reductase gene (nirS), and nosZC1F/nosZC1R specific for nitrous oxide reductase gene (nosZ1 and nosZ2), yielded DNA bands of approximately 491, 485, 1496, 400–500, 400–500, 450, and 700 bp, respectively. To obtain more details, the PCR products were visualized on an agarose gel (Additional file 1: Fig. S1).
Sequencing and phylogenetic analysis
The cloned fragments after the conventional PCR were sequenced, and the results revealed successful cloning of all the genes. After comparing and analyzing the sequences of the cloned genes with the known sequences of bacterial genes retrieved from the NCBI GenBank, the phylogenetic trees were constructed using the retrieved bacterial genes with high sequence similarities.
Twenty selected isolates with nifH (nifH-1 to nifH-20) showed a high similarity, of 90–98%, with bacteria containing known nifH sequences. They were closely related to uncultured bacteria, Asaia bogorensis [22], Pseudomonas stutzeri, Azotobacter vinelandii, and Rhodoblastus acidophilus carrying nifH [23] (Fig. 1). Similarly, 20 isolated clones containing the amoA fragment (camoA-1 to camoA-20) showed 96%–100% sequence similarity with bacteria containing amoA, and they were closely related to Nitrospira sp. [16] and uncultured ammonia oxidizing bacteria carrying amoA (Fig. 2). Fifteen clones with nxrB gene (cnxrB-1 to cnxrB-20) showed 90–98% similarity with nxrB from GenBank database. They were closely related to Nitrospira moscoviensis [24], Nitrospira calida, ‘Candidatus Nitrospira bockiana’, and uncultured bacteria carrying nxrB (Fig. 3). Similar results were reported by Pester et al. [8], in a microbial community analysis of nxrB in different environment samples such as activated sludge and climatically distinct soil samples. Moreover, in 17 isolated colonies with hzsA (hzsA-2 to hzsA-7, hzsA-9 to hzsA-16, hzsA-18 to hzsA-20), the sequence similarity ranged from 90 to 98% (Fig. 4), and sequences were closely related to those of the enrichment culture clone, ‘Candidatus Brocadia fulgidia’ [25], ‘Candidatus Brocadia anammoxidans’ [26], ‘Candidatus Jettenia caeni’ [27], ‘Candidatus Kuenenia stuttgartiensis’ [28], uncultured anaerobic ammonium-oxidizing bacteria, and uncultured anaerobic ammonium-oxidizing bacterial enrichment clones [29].
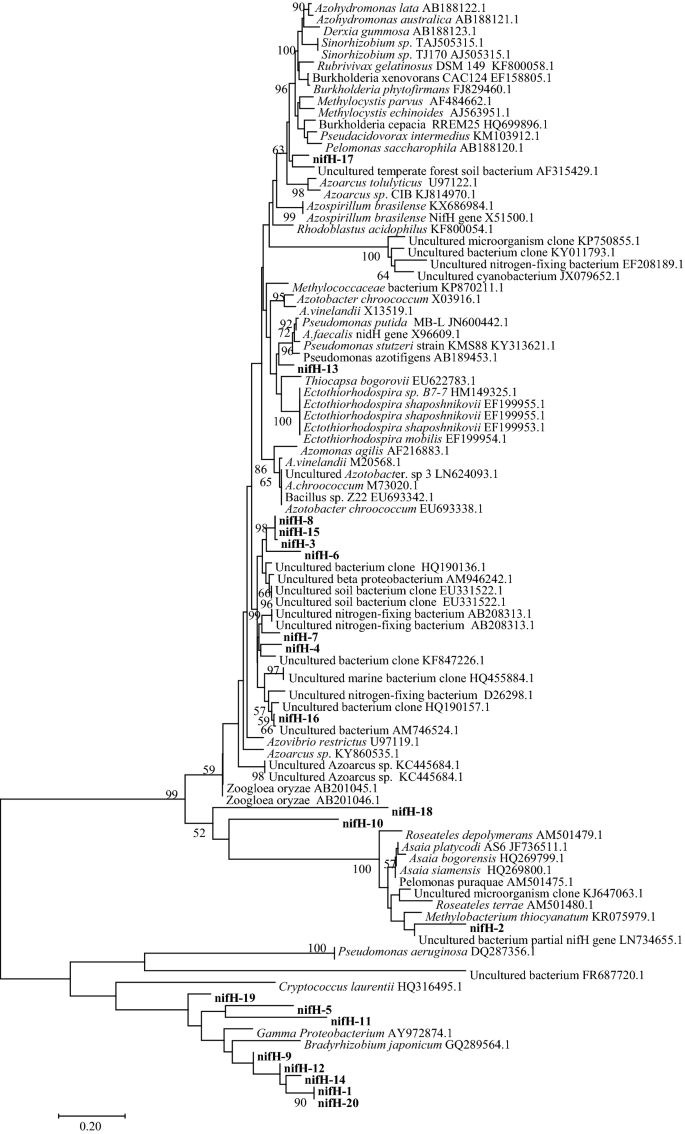
Neighbor-joining phylogenetic tree of the cloned nifH gene sequences

Neighbor-joining phylogenetic tree of the cloned amoA gene sequences

Neighbor-joining phylogenetic tree of the cloned nxrB gene sequences

Neighbor-joining phylogenetic tree of the cloned hzsA gene sequences
For both fragments of nitrous oxide reductase genes (nosZ-1 and nosZ-2), 20 colonies were selected for each of the gene clones. The denitrifying gene clones with the nosZ-1 gene fragment (cnosZ1-1 to cnosZ1-20) showed 88–97% sequence similarity (Fig. 5a), and they were found to be closely related to the uncultured denitrifying bacteria, uncultured Azospirillum sp. [30], uncultured proteobacteria, Pseudomonas stutzeri, and Paracoccus sp. Furthermore, the 20 isolated colonies with the nosZ-2 gene fragment (cnosZ2-1 to cnosZ2-20) exhibited 74–100% similarity (Fig. 5b), and they were closely related to uncultured bacterial clones harboring nosZ. Both primer pairs used for the identification and determination of nosZ functioned well. However, these results suggest that nosZ amplified by the primer pair nosZC1F/nosZC1R was more conserved in the soil than nosZ amplified by the other primer set nosZC2F/nosZC2R.


Neighbor-joining phylogenetic trees of the cloned anosZ gene fragment-1 sequences and bnosZ gene fragment-2 sequences
All the isolated colonies (20 colonies) from the clone library of denitrifying gene insert (nirS gene fragment; cnirSc1-1 to cnirSc1-20) were found to share 96–99% similarity with clones containing known sequences (Fig. 6). The sequenced clone genes were closely related to nirS from Caulobacter segnis, Pseudoxanthomonas suwonensis, Stenotrophomonas nitritireducens, Rhodanobacter denitrificans, Ralstonia sp., Curvibacter sp., and Pseudomonas stutzeri, and nirS uncultured prokaryotic clone.

Neighbor-joining phylogenetic tree of the cloned nirS gene sequences
For the denitrifying gene nirK, 20 clones (cnirKc2-1 to cnirKc2-20) showed 73–100% similarity (Fig. 7). The cloned genes were found to be closely related to those of Thauera sp. and Sulfuricella denitrificans.

Neighbor-joining phylogenetic tree of the cloned nirK gene sequences
Quantitative PCR analysis
Quantitative PCR of all the genes was performed using the absolute quantification method on the basis of the gene copy number. The copy numbers of nifH, amoA, hzsA, nxrB, nirK, nirS, nosZ1, and nosZ2 were 8.93 × 10⁷ ± 2.00 × 10⁷, 1.79 × 10⁷ ± 0.32 × 10⁷, 4.00 × 10⁵ ± 1.10 × 10⁵, 4.10 × 10⁹ ± 0.45 × 10⁹, 3.93 × 10⁶ ± 0.77 × 10⁶, 2.22 × 10⁹ ± 0.61 × 10⁹, 9.50 × 10⁷ ± 1.58 × 10⁷, and 2.99 × 10⁸ ± 1.26 × 10⁸ copies/g soil, respectively (Fig. 8). Among the studied nitrifying genes, namely, nxrB and amoA, the abundance of nxrB was two-times higher than that of amoA. Similar results were reported by Ramanathan et al. [31], in their study on nitrifier gene abundance in a sediment affected by acid mine drainage. Among various genes used in this study, namely, nifH, amoA, nxrB, hzsA, nirK, nirS, nosZ1, and nosZ2, the abundance of nxrB and nirS was relatively higher than that of the others, whereas the abundance of hzsA was found to be relatively lower. This suggests the high occurrence of nitrifying microbial communities in the surface environment of paddy soils. As indicated by the relatively high nirS abundance, denitrifiers are known to be active in paddy soils [32, 33]. However, under partially oxic conditions, anammox bacteria may not flourish, as indicated by hzsA abundance.

Quantitative PCR result of the copy number of nifH, amoA, nxrB, hzsA, nosZ1, nosZ2, nirS, and nirK
Here, we explored the diversity of microbial communities in a rice paddy soil by detecting and quantifying some key functional genes involved in the nitrogen cycle by using molecular techniques. Our study will help better understand the nitrogen cycle and the diversity of associated microbial communities in terrestrial habitats, such as paddy fields. Although we used primers to determine the nitrogen cycle-related genes based on the nitrogen-transforming reactions mediated by bacteria, there are several undiscovered nitrogen-transforming reactions that are thermodynamically feasible and the microorganisms that catalyze these reactions.
Availability of data and materials
Gene sequences were deposited to NCBI GenBank.
References
Fierer N, Lennon JT (2011) The generation and maintenance of diversity in microbial communities. Am J Bot 98(3):439–448. https://doi.org/10.3732/ajb.1000498
Roesch LF, Fulthorpe RR, Riva A, Casella G, Hadwin AKM, Kent AD, Daroub SH, Camargo FAO, Farmerie WG, Triplett EW (2007) Pyrosequencing enumerates and contrasts soil microbial diversity. ISME J 1(4):283–290. https://doi.org/10.1038/ismej.2007.53
Wagg C, Bender SF, Widmer F, van der Heijden MGA (2014) Soil biodiversity and soil community composition determine ecosystem multifunctionality. Proc Natl Acad Sci USA 111(14):5266–5270. https://doi.org/10.1073/pnas.1320054111
Kuypers MMM, Marchant HK, Kartal B (2018) The microbial nitrogen-cycling network. Nat Rev Microbiol 16(5):263–276. https://doi.org/10.1038/nrmicro.2018.9
Zehr JP, Jenkins BD, Short SM, Steward GF (2003) Nitrogenase gene diversity and microbial community structure: a cross-system comparison. Environ Microbiol 5(7):539–554. https://doi.org/10.1046/j.1462-2920.2003.00451.x
Gaby JC, Buckley DH (2012) A comprehensive evaluation of PCR primers to amplify the nifH gene of nitrogenase. PLoS ONE 7(7):12. https://doi.org/10.1371/journal.pone.0042149
Hatzenpichler R (2012) Diversity, physiology, and niche differentiation of ammonia-oxidizing archaea. Appl Environ Microbiol 78(21):7501–7510. https://doi.org/10.1128/aem.01960-12
Pester M, Maixner F, Berry D, Rattei T, Koch H, Lucker S, Nowka B, Richter A, Spieck E, Lebedeva E, Loy A, Wagner M, Daims H (2014) NxrB encoding the beta subunit of nitrite oxidoreductase as functional and phylogenetic marker for nitrite-oxidizing Nitrospira. Environ Microbiol 16(10):3055–3071. https://doi.org/10.1111/1462-2920.12300
Kartal B, Keltjens JT (2016) Anammox biochemistry: a tale of heme c proteins. Trends Biochem Sci 41(12):998–1011. https://doi.org/10.1016/j.tibs.2016.08.015
Kelly JJ, Policht K, Grancharova T, Hundal LS (2011) Distinct responses in ammonia-oxidizing archaea and bacteria after addition of biosolids to an agricultural soil. Appl Environ Microbiol 77(18):6551–6558. https://doi.org/10.1128/aem.02608-10
Jung J, Yeom J, Han J, Kim J, Park W (2012) Seasonal changes in nitrogen-cycle gene abundances and in bacterial communities in acidic forest soils. J Microbiol 50(3):365–373. https://doi.org/10.1007/s12275-012-1465-2
Ollivier J, Towe S, Bannert A, Hai B, Kastl EM, Meyer A, Su MX, Kleineidam K, Schloter M (2011) Nitrogen turnover in soil and global change. FEMS Microbiol Ecol 78(1):3–16. https://doi.org/10.1111/j.1574-6941.2011.01165.x
Keshri J, Yousuf B, Mishra A, Jha B (2015) The abundance of functional genes, cbbL, nifH, amoA and apsA, and bacterial community structure of intertidal soil from Arabian Sea. Microbiol Res 175:57–66. https://doi.org/10.1016/j.micres.2015.02.007
Dollhopf SL, Hyun JH, Smith AC, Adams HJ, O'Brien S, Kostka JE (2005) Quantification of ammonia-oxidizing bacteria and factors controlling nitrification in salt marsh sediments. Appl Environ Microbiol 71(1):240–246. https://doi.org/10.1128/aem.71.1.240-246.2005
Braker G, Zhou JZ, Wu LY, Devol AH, Tiedje JM (2000) Nitrite reductase genes (nirK and nirS) as functional markers to investigate diversity of denitrifying bacteria in Pacific northwest marine sediment communities. Appl Environ Microbiol 66(5):2096–2104. https://doi.org/10.1128/aem.66.5.2096-2104.2000
Rotthauwe JH, Witzel KP, Liesack W (1997) The ammonia monooxygenase structural gene amoA as a functional marker: molecular fine-scale analysis of natural ammonia-oxidizing populations. Appl Environ Microbiol 63(12):4704–4712
Altschul SF, Gish W, Miller W, Myers EW, Lipman DJ (1990) Basic local alignment search tool. J Mol Biol 215(3):403–410. https://doi.org/10.1006/jmbi.1990.9999
Kumar S, Stecher G, Tamura K (2016) MEGA7: Molecular evolutionary genetics analysis version 7.0 for bigger datasets. Mol Biol Evol 33(7):1870–1874. https://doi.org/10.1093/molbev/msw054
Saitou N, Nei M (1987) The neighbor-joining method-a new method for reconstructing phylogenetic trees. Mol Biol Evol 4(4):406–425
Tamura K, Nei M, Kumar S (2004) Prospects for inferring very large phylogenies by using the neighbor-joining method. Proc Natl Acad Sci USA 101(30):11030–11035. https://doi.org/10.1073/pnas.0404206101
Hardie M, Doyle R (2012) Measuring soil salinity. Methods Mol Biol 913:415–425. https://doi.org/10.1007/978-1-61779-986-0_28
Yamada Y, Katsura K, Kawasaki H, Widyastuti Y, Saono S, Seki T, Uchimura T, Komagata K (2000) Asaia bogorensis gen. nov., sp. nov., an unusual acetic acid bacterium in the alpha-Proteobacteria. Int J Syst Evol Microbiol 50:823–829. https://doi.org/10.1099/00207713-50-2-823
Dedysh SN, Ricke P, Liesack W (2004) NifH and NifD phylogenies: an evolutionary basis for understanding nitrogen fixation capabilities of methanotrophic bacteria. Microbiology 150:1301–1313. https://doi.org/10.1099/mic.0.26585-0
Ehrich S, Behrens D, Lebedeva E, Ludwig W, Bock E (1995) A new obligately chemolithoautotrophic, nitrite-oxidizing bacterium, Nitrospira moscoviensis sp. nov. and its phylogenetic relationship. Arch Microbiol 164(1):16–23
Kartal B, van Niftrik L, Sliekers O, Schmid MC, Schmidt I, van de Pas-Schoonen K, Cirpus I, van der Star W, van Loosdrecht M, Abma W, Kuenen JG, Mulder J-W, Jetten MSM, den Camp HO, Strous M, van de Vossenberg J (2004) Application, eco-physiology and biodiversity of anaerobic ammonium-oxidizing bacteria. Rev Environ Sci Bio/Technol 3(3):255–264. https://doi.org/10.1007/s11157-004-7247-5
Jetten MSM, Wagner M, Fuerst J, van Loosdrecht M, Kuenen G, Strous M (2001) Microbiology and application of the anaerobic ammonium oxidation (‘anammox’) process. Curr Opin Biotechnol 12(3):283–288. https://doi.org/10.1016/s0958-1669(00)00211-1
Ali M, Oshiki M, Awata T, Isobe K, Kimura Z, Yoshikawa H, Hira D, Kindaichi T, Satoh H, Fujii T, Okabe S (2015) Physiological characterization of anaerobic ammonium oxidizing bacterium ‘Candidatus Jettenia caeni’. Environ Microbiol 17(6):2172–2189. https://doi.org/10.1111/1462-2920.12674
Schmid M, Twachtmann U, Klein M, Strous M, Juretschko S, Jetten M, Metzger JW, Schleifer KH, Wagner M (2000) Molecular evidence for genus level diversity of bacteria capable of catalyzing anaerobic ammonium oxidation. Syst Appl Microbiol 23(1):93–106. https://doi.org/10.1016/s0723-2020(00)80050-8
Harhangi HR, Le Roy M, van Alen T, Hu BL, Groen J, Kartal B, Tringe SG, Quan ZX, Jetten MSM, Op den Camp HJM (2012) Hydrazine synthase, a unique phylomarker with which to study the presence and biodiversity of anammox bacteria. Appl Environ Microbiol 78(3):752–758. https://doi.org/10.1128/aem.07113-11
Tarrand JJ, Krieg NR, Dobereiner J (1978) A taxonomic study of the Spirillum lipoferum group, with descriptions of a new genus, Azospirillum gen. nov. and two species, Azospirillum lipoferum (Beijerinck) comb. Nov. and Azospirillum brasilense sp. nov. Can J Microbiol 24(8):967–980
Ramanathan B, Boddicker AM, Roane TM, Mosier AC (2017) Nitrifier gene abundance and diversity in sediments impacted by acid mine drainage. Front Microbiol 8:2136–2136. https://doi.org/10.3389/fmicb.2017.02136
Nishimura S, Sawamoto T, Akiyama H, Sudo S, Yagi K (2004) Methane and nitrous oxide emissions from a paddy field with Japanese conventional water management and fertilizer application. Glob Biogeochem Cycle. https://doi.org/10.1029/2003gb002207
Ishii S, Yamamoto M, Kikuchi M, Oshima K, Hattori M, Otsuka S, Senoo K (2009) Microbial populations responsive to denitrification-inducing conditions in rice paddy soil, as revealed by comparative 16S rRNA gene analysis. Appl Environ Microbiol 75(22):7070–7078. https://doi.org/10.1128/aem.01481-09
Acknowledgements
This study was funded by the National Research Foundation of Korea (NRF-2016R1D1A3B01012231).
Funding
National Research Foundation of Korea; Grant No.: NRF-2016R1D1A3B01012231.
Author information
Authors and Affiliations
Contributions
AK: performed the experiments; wrote the manuscript. J-HL: designed the experiments; wrote the manuscript. Both authors read and approved the final manuscript.
Corresponding author
Ethics declarations
Competing interests
The authors declare that they have no competing interests.
Additional information
Publisher's Note
Springer Nature remains neutral with regard to jurisdictional claims in published maps and institutional affiliations.
Supplementary information
Additional file 1: Table S1.
List of primers used in this study. Table S2. PCR conditions used for each gene. Table S3. Positive clones from each gene used to prepare standard for real-time PCR. Figure S1. PCR amplification of functional genes: nifH, amoA, nxrB, hzsA, nosZ, nirK, nirS genes, respectively.
Rights and permissions
Open Access This article is licensed under a Creative Commons Attribution 4.0 International License, which permits use, sharing, adaptation, distribution and reproduction in any medium or format, as long as you give appropriate credit to the original author(s) and the source, provide a link to the Creative Commons licence, and indicate if changes were made. The images or other third party material in this article are included in the article's Creative Commons licence, unless indicated otherwise in a credit line to the material. If material is not included in the article's Creative Commons licence and your intended use is not permitted by statutory regulation or exceeds the permitted use, you will need to obtain permission directly from the copyright holder. To view a copy of this licence, visit http://creativecommons.org/licenses/by/4.0/.
About this article

Cite this article
Khanal, A., Lee, JH. Functional diversity and abundance of nitrogen cycle-related genes in paddy soil. Appl Biol Chem 63, 17 (2020). https://doi.org/10.1186/s13765-020-00500-6
Received:
Accepted:
Published:
DOI: https://doi.org/10.1186/s13765-020-00500-6