
Abstract
Objective
DNA methylation influences gene expression and function in the pathophysiology of type 2 diabetes mellitus (T2DM). Mapping of T2DM-associated DNA methylation could aid early detection and/or therapeutic treatment options for diabetics.
Design
A systematic literature search for associations between T2DM and DNA methylation was performed. Prospero registration ID: CRD42020140436.
Methods
PubMed and ScienceDirect databases were searched (till October 19, 2023). Preferred Reporting Items for Systematic Reviews and Meta-Analyses (PRISMA) guidelines and New Castle Ottawa scale were used for reporting the selection and quality of the studies, respectively.
Result
Thirty-two articles were selected. Four of 130 differentially methylated genes in blood, adipose, liver or pancreatic islets (TXNIP, ABCG1, PPARGC1A, PTPRN2) were reported in > 1 study. TXNIP was hypomethylated in diabetic blood across ethnicities. Gene enrichment analysis of the differentially methylated genes highlighted relevant disease pathways (T2DM, type 1 diabetes and adipocytokine signaling). Three prospective studies reported association of methylation in IGFBP2, MSI2, FTO, TXNIP, SREBF1, PHOSPHO1, SOCS3 and ABCG1 in blood at baseline with incident T2DM/hyperglycemia. Sex-specific differential methylation was reported only for HOOK2 in visceral adipose tissue (female diabetics: hypermethylated, male diabetics: hypomethylated). Gene expression was inversely associated with methylation status in 8 studies, in genes including ABCG1 (blood), S100A4 (adipose tissue), PER2 (pancreatic islets), PDGFA (liver) and PPARGC1A (skeletal muscle).
Conclusion
This review summarizes available evidence for using DNA methylation patterns to unravel T2DM pathophysiology. Further validation studies in diverse populations will set the stage for utilizing this knowledge for identifying early diagnostic markers and novel druggable pathways.
Introduction
Type 2 diabetes mellitus (T2DM) is a disorder of genetic and environmental factors. It is projected to affect 693 million people worldwide by 2045 [1]. DNA methylation had been proposed as one of the epigenetic phenomena for explaining the missing heritability of T2DM, as multiple, large genome-wide association studies have been able to account for only < 20% of the estimated T2DM heritability [2]. DNA methylation is an epigenetic phenomenon in which the C5 carbon of the cytosine residue is attached to a methyl group, predominantly in cytosine-phosphate-guanine (CpG) sites [3,4,5]. This epigenetic alteration influences gene expression, and thereby, gene function [6, 7].
DNA methylation has been studied extensively in relation to T2DM, and 3 systematic reviews have summarized the findings a few years back [8,9,10]. From systematic literature done till August 2015, Muka et al. [10] could not find any consistent association between global DNA methylation with T2DM, glucose, insulin and insulin resistance and reported epigenetic regulation of few candidate genes in blood cells, muscle, adipose tissue and placenta without any overlap between them. Walaszczyk et al. [9] could replicate association of methylation with T2DM in blood samples from the Lifelines study at 5 CpGs (in ABCG1, LOXL2, TXNIP, SLC1A5 and SREBF1) out of the 52 CpGs they identified as reported to be differentially methylated in T2DM through a systematic review of the literature done till April 2017. Willmer et al. [8] also focused on differential methylation signatures in blood samples and reported TCF7L2, KCNQ1, ABCG1, TXNIP, PHOSPHO1, SREBF1, SLC30A8 and FTO genes to be reproducibly associated with T2DM across multiple population groups in the literature reviewed between January 2002 and July 2018.
DNA methylation has been touted as a strong candidate biological process for identification of diagnostic and therapeutics for T2DM [11]. While the available systematic reviews have looked at DNA methylation associated with T2DM [8,9,10], they have not evaluated T2DM-associated DNA methylation comprehensively in all available human tissue and cell types. We set out to fill this research gap with the no time period cutoff until October 19, 2023, and including all available human tissue and cell types. We also report associated gene expression data, role of sex and ethnicity, in relation to DNA methylation in our review.
Methods
Searches
PubMed and Science Direct databases were independently searched by authors (NN, PN and JKV) using the key terms “type 2 diabetes mellitus” and “DNA methylation,” and their associated terms for all studies published up to October 19, 2023. All articles from the time of publication listing were considered, and as such no start date was set. No filters were applied during the search using the keywords, so as to not exclude any mislabeled/mis-annotated article type. The detailed search strategy is given in Additional file 1: Table S1.
Study inclusion and exclusion criteria
The inclusion criteria were full-text English language articles on DNA methylation associated with T2DM in human subjects. Case–control and prospective studies investigating genome-wide methylation were included. Reviews, animal model studies, in vitro studies, irrelevant articles and articles published in other languages were excluded.
All participants, regardless of gender and ethnicity, classified as adults aged 18 years and above were included. All individuals who did not satisfy these criteria—children and adolescents under 18 years of age; as well as subjects with type 1 diabetes (T1DM) or gestational diabetes were excluded. As the association of DNA methylation with T2DM was the focus of this systematic review, intervention studies and clinical trials were excluded. Studies reporting association of DNA methylation with diabetes-related traits (hyperglycemia and insulin resistance) were retained.
All the articles were assessed for their eligibility based on their abstract or full text.
Procedure
Disagreements between the authors, such as categorization and selection of articles, and data extraction, were resolved through discussion with AM. The Preferred Reporting Items for Systematic Reviews and Meta-Analyses (PRISMA) checklist was followed to represent the method used [12]. A total of 32 full-text articles are included in this systematic review.
The assessment of quality of the studies was done by adapting the New Castle Ottawa scale (NOS) [13]. The parameters used for the assessment are adequacy of case definition, representativeness of cases, selection of controls, definition of controls, comparability of cases and controls, ascertainment of exposure and method used for ascertainment of cases and controls. Scores were given to each of the included studies, and the total score was calculated according to the score sheet (NOS).
This review protocol was registered with the International Prospective Register of Systematic Reviews (PROSPERO) database (https://www.crd.york.ac.uk/prospero/) [14] (accessed April 18, 2023) (registration ID: CRD42020140436).
Pathologically connected pathways with differentially methylated genes in T2DM were analyzed using Kyoto Encyclopedia of Genes and Genomes (KEGG) and Jensen Disease database via Enrichr-KG [15].
Results
We identified a total of 5819 articles during the initial search. Duplicates, irrelevant articles based on the study design, publication language, article type, and other articles not within our scope of review were removed. Thirty-two full-text articles were finally selected (Fig. 1).

Preferred Reporting Items for Systematic Reviews and Meta-Analyses (PRISMA) [12] flowchart for the literature search process, performed up to October 19, 2023
NOS was used to access the quality of the articles. Of the 32 studies, 16 were assigned a score of more than 5, indicating high quality (Additional file 2: Table S2). As all the studies have used the same method of ascertainment for cases and controls, and the authors are not blinded to case–control status, these redundant scores are not presented. As the nonresponse rate was not available for any of the studies, this also has been omitted from the quality assessment table.
Case–control studies that reported differential DNA methylation between T2DM (case) and normoglycemic (control) subjects or reported associations between DNA methylation and clinical parameters related to glycemic control of the subjects (HbA1c, fasting blood glucose) and prospective nested case–control studies that reported differential DNA methylation measured at baseline/recruitment between subjects who developed T2DM (incident cases) and those that remained normoglycemic (control) during the follow-up period were finally included.
Participant details such as number of cases and controls and location of the study are also included. Details of the study participants who do not explicitly belong to either case or control group are also presented. The tissue source of the gene/loci identified in; method used for determining methylation status; and the validation method used for confirming the methylation status are tabulated in Table 1.
The loci/genes reported to be differentially methylated are tabulated in Table 2, where their methylation status is represented as downward arrow (hypomethylation) or upward arrow (hypermethylation). Wherever reported, the statistical significance of methylation (P value) is also mentioned. For studies reporting more than 10 differentially methylated genes, the top 5 hypo- and hypermethylated genes are listed.
Methods of DNA methylation analysis
Majority of the evaluated studies had employed array-based techniques to assess DNA methylation levels. Eighteen of 32 studies used Illumina 450 k array. Other array-based studies used Illumina 27 k array (2 studies), Illumina EPIC BeadChip array (4 studies; of which 2 studies specifically mentioned using the 850 k array—EPIC v1 array targeting 850 k probes), Affymetrix SNP6 microarray (1 study), Affymetrix GeneChip promoter 1.0R array (1 study) or Affymetrix axiom genome-wide Taiwan BioBank (TWB) array (1 studies). Rest of the studies used techniques such as methylated DNA immunoprecipitation (MEDIP) (2 studies), MEDIP-chromatin immune precipitation (1 study), reduced representation bisulfite sequencing (1 study) or next-generation sequencing (1 study) to measure DNA methylation levels.
Tissues used in DNA methylation analyses
Of the 32 articles retrieved, 17 (53%) studies used blood samples, 4 (13%) studies used pancreatic islet samples, 5 (16%) studies used adipose tissue samples, 2 (6%) studies used liver samples, 1 (3%) study used spermatozoa samples and 3 (9%) used skeletal muscle samples for their DNA methylation analyses. None of the 32 studies reviewed here utilized more than one tissue from the same subjects for DNA methylation analyses.
Genome-wide methylation analysis for T2DM
Of the 32 genome-wide methylation studies reviewed here, we identified a total of 130 loci that were differentially methylated between T2DM cases and controls across. In an instance where a study reports < 10 differentially methylated genes/loci, they are presented individually. However, in the case of a study which reports > 10 genes/loci, only the top 5 hypo- and 5 hypermethylated genes are highlighted for brevity and reported in Table 2. The direction of methylation (hyper- or hypomethylated in T2DM, compared to controls) and the reported P values (both unadjusted, and after multiple testing correction) have been included.
We identified genes such as ABCG1, PPARGC1A, PTPRN2 and TXNIP with well-known T2DM genetic risk variants, which were consistently reported to be differentially methylated in more than one study (Fig. 2). Tissues used in identification of these gene were blood cells, liver, pancreatic islets and adipose tissue. TXNIP (cg19693031) was the most common gene identified consistently as hypomethylated in diabetic blood (9 studies). TXNIP also harbors established T2DM genetic risk variants [16, 17].
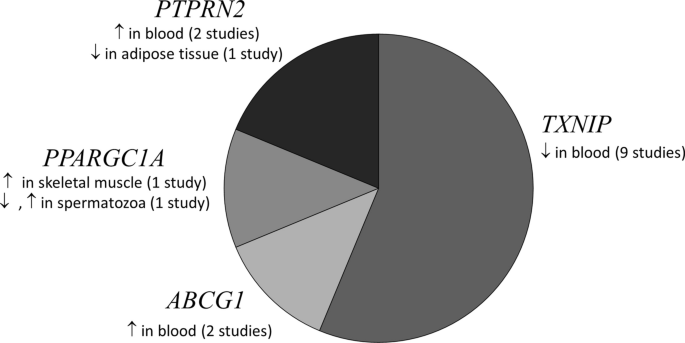
A pie chart depicting the genes that were consistently reported to be differentially methylated in ≥ 2 studies in various tissues from T2DM subjects. ↑: Hypomethylation, ↓: Hypermethylation in T2DM individuals compared to normoglycemics. PPARGC1A (chr4: 24,024,251–500) hypomethylated, (chr4: 24,111,501–750) hypermethylated in spermatozoa [57]
Blood
Although blood is not an insulin-responsive tissue, it is the prime minimally invasive tissue available for investigating T2DM-associated epigenetic markers. With the bulk (50%) of the studies coming from Europe, ABCG1 [18, 19] and TXNIP [16, 17, 19,20,21,22,23,24,25] were some of the blood-based epigenetic markers which were reported to be associated with T2DM in more than one study. We were unable to find any study where differential methylation was investigated simultaneously in blood and other tissues from the same subjects.
Pancreatic islets
Insufficient secretion of insulin from pancreatic beta cells and increased secretion of glucagon from pancreatic alpha cells leads to development of T2DM and is known to be regulated by DNA methylation [26]. Three of the 32 studies, from Italy, South Korea and Sweden, included in this review have interrogated DNA methylation in pancreatic islets from T2DM individuals, donated after their death. Regions in SFRS2IP [3], MSI2 [27], which are known to be associated with critical roles in nucleic acid binding, and B3GNT7 [28] that is involved in synthesis of glycoprotein, were reported to be hypomethylated in pancreatic islets from T2DM individuals. Considering that DNA methylation can change based on the time of collection of tissue after death [29, 30], findings from these studies need to be interpreted in cognizance of the lack of details available in these studies about the cause of death or collection and storage of pancreatic islet tissue after death.
Adipose tissue
Adipose tissue is known to play a critical role in regulating body metabolism and energy homeostasis [31]. Dysregulation in adipose biology imposes serious health complications such as obesity and development of T2DM [31]. DNA methylation is an important regulator factor in development [32, 33] and dysfunction [34, 35] of adipose tissue. Five studies—4 of these representing the European population—included in this review have dissected whether T2DM, and related risk factors are associated with epigenetic modifications in human adipose tissue [36,37,38,39,40]. It is possible that DNA methylation alterations in these reported genes including C1orf52 [36], HOOK2 [37], MFSD1 [38], HNF4A [39] and L1TD1 [40] contribute to or are caused by T2DM.
C1orf52 is involved in RNA binding in adipose tissue [41], and HOOK2 is responsible for cytoskeleton maintenance via regulation of microtubules [42], while MSFD1 regulates lysosome transport [43]. Epigenetic alterations in such genes involved in cell structure and function can cause dysfunction in adipose tissue, thereby leading to insulin resistance. While HNF4A mainly regulates transcription in hepatocytes and is associated with Fanconi renotubular syndrome 4 with maturity-onset diabetes of the young [44] and maturity-onset diabetes of the young, type 1 [45], it is also known to play a role in lipid and glucose metabolism [46, 47]. L1TD1 is predicted to be involved in single-stranded RNA-binding activity [48].
Liver
Liver is known to be involved in regulating glucose level by storing and releasing glycogen in response to insulin and glucagon [49]. Impaired hepatic gluconeogenesis, glycogenolysis and insulin sensitivity are known to play an important role in T2DM development and other risk factors. Altered hepatic metabolism could be the cause or consequence of DNA methylation modification. Genes involved in intracellular tyrosine kinase activity—PDGFA [50], transferring phosphorus-containing groups and protein tyrosine kinase activity—RIPK4 [51], heme binding and oxidoreductase activity—CYB561D1 [51], were found to be hypomethylated in the diabetic groups. However, the gene involved in inflammation—IL23Ap19 [51] was identified to be hypermethylated in the diabetic group. Of the two studies reported here, one was from France and the other from Finland.
Gene expression studies
Out of the 32 studies reviewed, 8 had also examined differences in gene expression between T2DM and normoglycemic individuals. To examine if increase in methylation of a gene causes decrease in expression of that gene, we analyzed the studies that report both differentially methylated genes and gene expression, in the same population and study setting, using tissues from the same study participants (Table 3). For most of the loci with both DNA methylation and gene expression data available, we found that increase in methylation was associated with decrease in expression, concurrent to the current understanding [6]. Hypermethylation of PPARGC1A in skeletal muscles [52], ABCG1 in blood [18] and PER2 in pancreatic islets [3] was associated with lower expression of the corresponding genes.
Twin studies
Five of the 32 studies reviewed here have investigated DNA methylation in monozygotic twin cohorts [17, 21, 28, 36, 53] (Table 4). MALTI [53] which is known to be involved in energy and insulin signaling pathways [54], PTBP1 [36] that is involved in nucleic acid binding, and ANO8 [28] that is involved in calcium transport, were hypermethylated in diabetic twins in peripheral blood, adipose tissue and pancreatic islets, respectively. TXNIP [17, 21], COL21A1 [36] and B3GNT7 [28] were hypomethylated in blood cells, adipose tissue and pancreatic islets, respectively, from the diabetic twins. Dayeh et al. reported differential methylation of ABCG1 (hypermethylated in blood and adipose tissue) and PHOSPHO1 (hypomethylated in skeletal muscle) in monozygotic twins discordant for T2DM [55].
Association between diabetes related traits and DNA methylation
Only 4 of the 32 studies reported association between diabetes-related traits (hyperglycemia and insulin resistance) and DNA methylation [17,18,19, 22]. Kriebel et al. reported significant association between measures of glucose metabolism phenotypic traits and methylation levels of 31 CpG sites in PBMCs [18]. Five CpGs were found to be associated with fasting glucose, 1 CpG with 2-h glucose, 8 with fasting insulin and 26 with Homeostatic Model Assessment of Insulin Resistance (HOMA-IR) in model 1 (Table 2) [18]. There was no significant association between HbA1c and DNA methylation levels in model 1; in model 2, after adjustment for body mass index (BMI), the effect strength was reduced by 30% for DNA methylation associations with fasting glucose suggesting that the associations between DNA methylation and diabetes-related traits are partially mediated by BMI [18].
Kulkarni et al. investigated association between 446,356 autosomal CpG sites and phenotypic traits in PBMCs, of which a total of 51 CpG sites were significantly associated with T2DM, 19 with FBG and 24 with HOMA-IR (Table 2) [19].
Wang et al. report association between 63 differential methylated loci and fasting blood glucose and association between 6 differentially methylated loci with HbA1c in blood samples from twins discordant for diabetes [17]. Among these, hypomethylation of TXNIP [17, 19] and hypermethylation of ABCG1 [18, 19] were positively associated with fasting blood glucose (FBG), and hypermethylation of SAMD12 was negatively associated with FBG [19]. TXNIP hypomethylation in blood cells was found to be associated with hyperglycemia in individuals from Taiwan [23], France [24], the USA [21] and China [17].
Dawes et al. performed genome-wide DNA methylation on blood samples from normoglycemic (n = 142), pre-diabetic (n = 274) and diabetic (n = 90) individuals [22]. They identified HbA1c-associated DNA methylation loci by regressing the probes against HbA1c values, while controlling for age, sex and BMI [22]. They report cg19693031 (TXNIP) as the locus most highly associated with HbA1c [22].
Enrichment analysis of genes differentially methylated in T2DM
Enrichment analysis of signaling pathways relevant to the pathophysiology of T2DM using Enrichr-KG [15] was done in two steps. Initially, all 130 genes differentially methylated in T2DM in all 32 studies reviewed were included (Fig. 3). To take into account reproducibility of these findings, enrichment analysis was separately done specifically for the genes (ABCG1, TXNIP, PTPRN2, PPARGC1A) that were reported to be differentially methylated in T2DM in more than one study (Fig. 4). TXNIP hypomethylation in blood was linked to hyperglycemia. PPARGC1A hypermethylation in skeletal muscles, and two CpG sites that were hyper- and hypomethylated, respectively, in spermatozoa, was linked to hyperglycemia and adipocytokine signaling pathway. PTPRN2 that was reported to be hypermethylated in blood and hypomethylated in adipose tissue was associated with T2DM and T1DM.

Gene enrichment analysis of 17 of the 130 genes reported to be differentially methylated in T2DM subjects in the 32 studies included for review using Enrichr-KG. These genes were mapped to diabetes and related disorders. Insulin resistance, glucagon signaling pathway, glaucoma, AMPK signaling pathway, cholinergic synapse, ovarian cancer, amphetamine addiction and Huntington’s disease were found to be associated with KCNQ1, FTO, PPARGC1A, PTPRN2, ELOVL5, HNF1B, HNF4A, VPS13A, MAEA, CREB1, CPT1A, PRKCZ, PRKCB, CREB3L2, CDKN2A and TGFBR3

Gene enrichment analysis of 4 genes reported to be differentially methylated in T2DM subjects in > 1 study from among the 32 studies included for review using Enrichr-KG. Hyperglycemia, type 1 diabetes, adipocytokine signaling pathway, glucagon signaling pathway, longevity regulating pathway and ABC transporters were found to be associated with PPARGC1A, TXNIP, PTPRN2 and ABCG1
Subgroup analysis based on ethnicity
Out of the 32 studies, 16 (50%) were from Europe, 4 (13%) were from North America, 8 (25%) were from Asia and 1 (3%) from Africa. Three studies (9%) did not report their subjects’ ethnicity/demography.
TXNIP was the most commonly reported hypomethylated gene in blood cells of T2DM individuals from all the geographic locations [16, 17, 19,20,21,22,23,24]. ABCG1 was found be to hypermethylated in blood cells of type 2 diabetics in studies from Europe [18] and the USA [19]. PTPRN2 was reported to be hypermethylated in peripheral blood in studies from China [56] and France [24]. Conversely, PTPRN2 was reported to be hypomethylated in adipose tissue from a Spanish study [37].
Subgroup analysis based on sex
PPARGC1A was assessed for differential methylation in two studies which had only male participants [52, 57]. PPARGC1A was hypermethylated in skeletal muscle of T2DM men [52]. Of the two differentially methylated regions in PPARGC1A identified in sperm, chr4: 24,111,501–750 was reported to be hypermethylated, and chr4: 24,024,251–500 was reported to be hypomethylated [57]. We did not find other epigenome-wide studies that report differential methylation of PPARGC1A in female-only or mixed-sex populations.
PDGFA was found to be hypomethylated in hepatocytes from liver biopsies of female T2DM participants of the discovery group and was later confirmed in both men and women by Abderrahmani et al. [50]. Similarly, hypomethylation of MSI2 in blood cells was first observed in a discovery group comprised of only men, and then in a replication group of both men and women by Jeon et al. [27].
In the cg 11,738,485-region (5 CpG nucleotides) of HOOK2, female T2DM visceral adipose tissue samples were hypermethylated, while male T2DM samples were hypomethylated, compared to non-diabetic sex-matched control samples [37]. None of the other loci/genes were reported to be differentially methylated in a sex-specific manner.
Internal and/or external validation
Only 22% of the studies reviewed (7 out of 32) validated their findings in an independent set of subjects using the same DNA methylation measurement method that they had used for the discovery set of samples [17, 25, 27, 36, 37, 50, 53]. Others used either bisulfite pyrosequencing/sequencing (10 studies) [3, 19, 27, 28, 37, 39, 52, 58,59,60], qPCR (1 study) [51], EpiTYPER (1 study) [16], Illumina 450 k (3 studies) [36, 50, 53] or MEDIP (1 study) [61] for their internal validation. Sixteen studies (50%) did not perform any validation for their findings.
Replication for case–control studies
We later looked for candidate-gene DNA methylation studies to see if the differentially methylated genes found in genome-wide studies have been confirmed in them. The following genes were reported to be differentially methylated in T2DM compared to normoglycemic controls in independent candidate-gene DNA methylation studies in the same tissue as the initial discovery group—ABCG1 [62, 63], FTO [64,65,66], TXNIP [67] and KCNQ1 [64, 68] in PBMCs, and PPARGC1A in pancreatic islets [69].
Prospective studies
As prospective studies observe the disease condition over a long period, they help in better understanding the role of a gene/set of genes toward pathogenesis. In our review, we came across three such studies that looked at incidence of T2DM and epigenetic modifications in genes associated with this incidence (Table 5).
In a 1:1 matched nested case–control study of 290 incident diabetics, who developed T2DM and 290 controls, who remained normoglycemic during the 4-year follow-up, baseline methylation at 7 CpG sites of IGFBP2 in blood cells (4 hypermethylated and 3 hypomethylated in cases) was associated with increased risk of incident T2DM [70].
Jeon et al. reported that differential methylation of three CpG sites in blood cells at baseline was associated with T2DM/hyperglycemia after a 10-year follow-up [27]. These CpG sites were cg23586172 (annotated to MSI2, hypomethylated), cg22604213 (annotated to CXXC4, hypomethylated) and cg25290098 (hypomethylated) in T2DM [27]. They further reported MSI2 hypomethylation in a replication group of 220 normoglycemic and 220 T2DM individuals [27]. Furthermore, whole-genome bisulfite sequencing of pancreatic islets of 2 T2DM and 16 normoglycemic individuals revealed that chr17:55,484,635 in MSI2 was hypomethylated in T2DM [27]. While MSI2 hypomethylation was seen in both pancreatic islets and PBMCs, pancreatic islets showed increased difference of 16% methylation versus 3% in PBMCs of MSI2 in T2DM when compared to normoglycemics [27]. MSI2 differential methylation was not found to be replicated in locus-specific case–control studies.
From the Jerusalem LRC longitudinal study, Toperoff et al. selected 58 individuals who developed impaired glucose metabolism over a 13-year follow-up and reported hypomethylation of a single CpG site in the first intron of FTO in peripheral blood samples collected at baseline [58]. Chen et al. similarly reported hypomethylation of FTO in their case–control study [57].
In a longitudinal study of Indian Asians living in London, UK (1074 incident T2DM and 1590 normoglycemic controls), over 8 years of follow-up, Chambers et al. reported that DNA methylation levels of TXNIP, PROC, C7orf29, SREBF1, PHOSPHO1, SOCS3 and ABCG1 in blood cells were positively associated with future T2DM incidence [71]. Of these, higher baseline methylation levels in TXNIP, SREBF1, PHOSPHO1, SOCS3 and ABCG1 were also associated with incident T2DM in an European cohort of 377 incident T2DM and 764 normoglycemic individuals [71].
Differential methylation in animal models
To check if animal model studies exist that have investigated or reported differential methylation in the genes identified as differentially methylated in the human case–control studies as playing causal or mechanistic role in the development of T2DM, a simple literature search was done using PubMed and bibliography search. A study in rat pancreatic islets reported Kcnq1 was hypomethylated in older rats (15 months of age) when compared to younger rats (3 months of age), but this difference was not statistically significant, while there was no comparison done with a rat T2DM model [72]. Though Toperoff et al. reported hypomethylation of KCNQ1 in blood cells [58], there are no human pancreatic islet studies reporting hypomethylation of KCNQ1. Identification of multiple variants in genome-wide association studies [73,74,75,76,77,78,79,80,81] points toward the likely importance of KCNQ1 in T2DM pathophysiology.
High-fat diet was shown to induce hypermethylation of Tcf7l2, and subsequently, gene expression was decreased in mouse islets [82]. This is in contrast to the findings where TCF7L2 is hypomethylated in T2DM human blood cells [58] and pancreatic islets [59]. It is to be noted that the mice used were non-diabetic adult males aged 8 weeks (equivalent to middle-aged humans [83]) [82], while the human study group were a mix of men and women aged about 58–65 years, and for the human pancreatic islet study, the samples had been collected post-mortem [58, 59]. Although there is an inverse differential methylation status among mice and humans, it is important to note that a high-fat diet caused suppression of Tcf7l2 gene expression and thus decreases pancreatic beta-cell survival (mediated via the transcription of Wnt/Beta-catenin signaling pathway [84]) [82].
Discussion
From the 32 studies finally included for this systematic review, we identified 130 genes with T2DM-associated differential methylation across all tissues analyzed. These comprise of the top 5 hypo- and hypermethylated genes for studies reporting more than 10 differentially methylated genes/loci. Of these 130 genes, 4 (3%; ABCG1, PPARGC1A, PTPRN2 and TXNIP) were reported in > 1 studies. The genes and associated pathways with altered DNA methylation in T2DM are conceptually summarized in Fig. 3 (for 16 of the 130 genes, for which pathway analysis could be conducted) and Fig. 4 (for the 4 genes reported to be differentially methylated in > 1 studies).
Previous systematic reviews [8, 9] have reported differentially methylated loci in genes in T2DM blood cells including ABCG1, TXNIP, KCNQ1. While another such review by Muka et al. reported several epigenetically regulated genes from blood cells, adipose tissue, muscle and placenta, there was no overlap between them, and no association was found between global DNA methylation and T2DM/hyperglycemic markers [10].
We did not limit our search to a particular method used to identify DNA methylation, and several studies included have used Illumina’s 450 k array. The common method of validation/replication in the studies reviewed here was bisulfite pyrosequencing. We also looked at candidate-gene DNA methylation studies which aimed to replicate/validate the epigenome-wide studies reviewed here and found that in blood cells, ABCG1 [62], FTO [64] and KCNQ1 [64] were hypermethylated, while TXNIP was hypomethylated [67]. TXNIP codes for thioredoxin-interacting protein, and this protein plays a major role in pathways generating reactive oxygen species [85], regulating redox-dependent signaling pathways, mediating oxidative stress, suppressing cell growth and inducing pancreatic beta-cell apoptosis [86]. ABCG1 codes for the protein responsible for intracellular sterol transport [87], and it regulates cholesterol efflux from macrophages to high-density lipoprotein in diabetics [88], indicated by altered lipid levels [89]. While genetic variants and epigenetic modification of KCNQ1 have been linked with T2DM via whole body insulin sensitivity [90], there is no clear evidence for the mechanistic link. Likewise, there has been no clear evidence of FTO link with T2DM.
As gene expression is known to be regulated by DNA methylation, it is important to validate this claim in the epigenome-wide association studies. We were able to report the relation between DNA methylation in the promoter region and expression of the corresponding gene, as none of the studies had mentioned methylation status of other regions of the genes. Of the studies reviewed here, we found that DNA methylation of genes was inversely related to gene expression. For example, hypomethylation of S100A4 in adipose tissue [36] and PDGFA in hepatocytes [50] was associated with increased expression of these genes, and hypermethylation of PPARGC1A in skeletal muscles [52], ABCG1 in blood [18] and PER2 in pancreatic islets [3] was associated with lower expression of the corresponding genes. Even though we observed DNA methylation being related inversely with expression of the corresponding gene in the studies reviewed, this is not a rule as has been reported repeatedly [91]. It is also important to note that there have been reports of methylation levels differing between different regions of the gene that influence gene expression; for instance, Anastasiadi et al. recently reported that gene expression is dependent on methylation of the first exon, more than methylation of the promoter region [92]. Moreover, in other studies such as one by Ball and colleagues, highly expressed genes have been reported to have low methylation levels in the promoter region and high methylation levels in rest of the gene body [93]. We could not, however, evaluate the relations between DNA methylation in various regions of a gene and its corresponding expression in this study since the studies reviewed by us have reported DNA methylation specifically in the promoter region.
Epigenetic studies on twins discordant for disease status are crucial in understanding the genetic basis of epigenetic differences observed in cross-sectional studies. Of the 5 studies included in our search, 3 did not have any common differentially methylated genes among them, while the other two studies that used blood cells as the source tissue had TXNIP as the common differentially methylated gene between them, with hypomethylation of TXNIP in diabetic blood samples observed in both these studies [17, 21]. TXNIP is the only gene reported to be hypomethylated in diabetic blood in both case–control studies [55] and in twin studies [17, 21] where the influence of underlying genetic factors is not masked. TXNIP has also been reported to be hypomethylated in diabetic pancreatic islets [55] and skeletal muscle [55], making it a potentially important causal gene in the pathophysiology of T2DM.
T2DM is known to be associated with other comorbidities such as obesity and cardiovascular complication. These comorbidities share some common risk factors like age, BMI and cholesterol content in blood. These risk factors are influenced by genes such as KCNQ1, TCF7L2 and FTO [94]. Other systematic reviews have looked at epigenetic changes in obesity [95], aging [96, 97] and cardiovascular complications [98]. Andrade et al. aimed to identify epigenetic changes in human adipose tissue from obese/overweight individuals with and without metabolic disorders like T2DM [95]. They also report differentially methylated genes that we have been reported in this review, such as KCNQ1, FASN, MFSD1, TXNIP, PPARG, IRS1 and TCF7L2, from the same studies [95]. Krolevets et al. report that in addition to about 75,000 CpG sites and 19,000 genes, PTPRN2 was among the most frequently reported gene that was associated with cardiac disorders, although the direction of methylation is not specified [98]. Of the two studies that investigated DNA methylation in aging [96, 97], no genes/CpG sites/studies were common with the ones mentioned in our review.
One of the most important factors in looking at T2DM as an epidemic is the geographic location of the site of reported data. With a large amount of data coming in from Europe alone, it is important to perform similar studies in other parts of the world and including various other ethnic groups to validate these reports and also help in mapping the genetic diversity to be able to tackle T2DM. India being the most populous country [99] with about 11% of Indians suffering from T2DM (in 2020) [100], it is imperative to study this population to uncover T2DM susceptible loci/genes. Of note, Chambers et al. have followed up London resident Indian Asians, for 8 years, and found that DNA methylation levels of TXNIP, PROC, C7orf29, SREBF1, PHOSPHO1, SOCS3 and ABCG1 were positively associated with future T2DM incidence [71], but similar studies are lacking in Indians living in India, where exposure to pollution and availability and consumption of healthy diet are vastly different.
As for sex-specific methylation signatures of T2DM, differences were not seen between men and women except in genes HOOK2 [37] and MSI2 [27], which were hypermethylated in adipose tissue, and hypomethylated in blood, respectively. Finally, we searched if the genes which we found to be highly reported to be differentially methylated in human were also reported to be differentially methylated in animal models. KCNQ1 was reported to be hypomethylated in both T2DM human [58], and older mice model compared with younger mice [72] suggesting age-related methylation changes across species. In both humans [58], and mice fed with a high-fat diet, TCF7L2 was hypomethylated, and this DNA methylation change in mice was induced because of their diet [82], suggesting that nutrient consumption plays a role in epigenetic modification of genes involved in beta-cell function, and a healthy diet can have a protective role in maintaining homeostasis.
Although we did not look at clinical trials and candidate-gene studies that report differential DNA methylation, our review is an up-to-date report of epigenome-wide studies that includes prospective studies. We also report gene expression data in comparison with DNA methylation. Furthermore, a systematic report of differentially methylated gene/loci in tissues including blood cells, adipose tissue, pancreatic islet, skeletal muscles, liver and spermatozoa is included. While sex and ethnicity play a major role in pathology, we have tried to highlight these effects.
As with previous reviews, we emphasize the need for more prospective studies and replication of genome-wide association studies in different tissue types and populations.
Conclusion
From the 32 studies that report differentially methylated genes/loci between T2DM and normoglycemic individuals, ABCG1 (hypermethylated in blood), FTO (hypermethylated in blood and spermatozoa), KCNQ1 (hypermethylated in blood and hypomethylated in spermatozoa), TXNIP (hypomethylated in blood), PPARGC1A loci at chr4: 24,111,501–750 (hypermethylated in skeletal muscle and spermatozoa) and loci at chr4: 24,024,251–500 (hypomethylated in spermatozoa), PTPRN2 (hypermethylated in blood, hypomethylated in adipose tissue) were reported in more than one study. We found reports of hypermethylation of these genes that were associated with decreased gene expression, and vice versa. We also report findings from studies done on monozygotic twins. Various traits that can affect T2DM such as sex, glucose levels, BMI and ethnicity were also taken into consideration.
As there were multiple methods that were used to measure DNA methylation, internal and external validation of these results is also reported. Finally, animal model studies that have reported differential DNA methylation of the genes that were found to be differentially methylated in human studies were looked at to get an understanding of the likely mechanisms linking epigenetic dysregulation of these genes in T2DM to its pathophysiology.
Although the majority of the top differentially methylated genes are well known, other more recent genes reported here should be investigated further to understand their role in pathogenesis of T2DM.
Data availability statement
All relevant data are presented as tables and/or figures.
Abbreviations
- ABCG1 :
-
ATP-Binding Cassette Subfamily G Member 1
- ANO8 :
-
Anoctamin 8
- B3GNT7 :
-
Beta 1,3-N-Acetylglucosaminyltransferase 7
- C1orf52 :
-
Chromosome 1 Open Reading Frame 52
- C7orf29 :
-
Chromosome 7 Open Reading Frame 29
- COL21A1 :
-
Collagen Type XXI Alpha 1
- CYB561D1 :
-
Cytochrome B561 Family Member D1
- CXXC4:
-
CXXC Finger Protein 4
- FTO :
-
Alpha-Ketoglutarate Dependent Dioxygenase
- GLP1R :
-
Glucagon Like Peptide 1 Receptor
- Gpx6 :
-
Glutathione Peroxidase 6
- HNF4A :
-
Hepatocyte Nuclear Factor 4 Alpha
- HOOK2 :
-
Hook Microtubule Tethering Protein 2
- IGFBP2 :
-
Insulin-Like Growth Factor-Binding Protein 2
- IL23Ap19 :
-
Interleukin-23 Subunit Alpha
- KCNQ1 :
-
Potassium Voltage-Gated Channel Subfamily Q Member 1
- L1TD1 :
-
LINE1 Type Transposase Domain Containing 1
- LOXL2 :
-
Lysyl Oxidase Homolog 2
- MALT1 :
-
Mucosa-Associated Lymphoid Tissue Lymphoma Translocation Protein 1
- MFSD1 :
-
Major Facilitator Superfamily Domain Containing 1
- MSI2 :
-
Musashi RNA-Binding Protein 2
- OPTN :
-
Optineurin
- PDGFA :
-
Platelet Derived Growth Factor Subunit A
- PDX1 :
-
Pancreatic and Duodenal Homeobox 1
- PER2 :
-
Period Circadian Regulator 2
- PHOSPHO1 :
-
Phosphoethanolamine/Phosphocholine Phosphatase 1
- PPARGC1A :
-
Peroxisome Proliferator-Activated Receptor Gamma Coactivator 1-Alpha
- PROC :
-
Protein C, Inactivator Of Coagulation Factors Va And VIIIa
- PTBP1 :
-
Polypyrimidine Tract-Binding Protein 1
- PTPRN2 :
-
Protein Tyrosine Phosphatase Receptor Type N2
- RIPK4 :
-
Receptor Interacting Serine/Threonine Kinase 4
- S100A4 :
-
S100 Calcium-Binding Protein A4
- SAMD12 :
-
Sterile Alpha Motif Domain Containing 12
- SLC145 :
-
Solute Carrier Family 1 Member 5
- SLC22A1 :
-
Solute Carrier Family 22 Member 1
- SLC22A3 :
-
Solute Carrier Family 22 Member 3
- SLC30A8 :
-
Solute Carrier Family 30 Member 8
- SREBF1 :
-
Sterol Regulatory Element-Binding Transcription Factor 1
- SOCS3 :
-
Suppressor Of Cytokine Signaling 3
- TCF7L2 :
-
Transcription Factor 7-Like 2
- TXNIP :
-
Thioredoxin-Interacting Protein
References
Cho NH, Shaw JE, Karuranga S, Huang Y, da Rocha Fernandes JD, Ohlrogge AW, et al. IDF diabetes atlas: global estimates of diabetes prevalence for 2017 and projections for 2045. Diabetes Res Clin Pract. 2018;138:271–81.
Prasad R, Groop L. Genetics of type 2 diabetes—pitfalls and possibilities. Genes. 2015;6(1):87–123.
Volkmar M, Dedeurwaerder S, Cunha DA, Ndlovu MN, Defrance M, Deplus R, et al. DNA methylation profiling identifies epigenetic dysregulation in pancreatic islets from type 2 diabetic patients. EMBO J. 2012;31(6):1405–26.
Jin B, Li Y, Robertson KD. DNA methylation: superior or subordinate in the epigenetic hierarchy? Genes Cancer. 2011;2(6):607–17.
Robertson KD. DNA methylation and human disease. Nat Rev Genet. 2005;6(8):597–610.
Moore LD, Le T, Fan G. DNA methylation and its basic function. Neuropsychopharmacology. 2013;38(1):23–38.
Hall E, Dayeh T, Kirkpatrick CL, Wollheim CB, Dekker Nitert M, Ling C. DNA methylation of the glucagon-like peptide 1 receptor (GLP1R) in human pancreatic islets. BMC Med Genet. 2013;14:76–76.
Willmer T, Johnson R, Louw J, Pheiffer C. Blood-based DNA methylation biomarkers for type 2 diabetes: potential for clinical applications. Front Endocrinol. 2018;4(9):744.
Walaszczyk E, Luijten M, Spijkerman AMW, Bonder MJ, Lutgers HL, Snieder H, et al. DNA methylation markers associated with type 2 diabetes, fasting glucose and HbA1c levels: a systematic review and replication in a case–control sample of the Lifelines study. Diabetologia. 2018;61(2):354–68.
Muka T, Nano J, Voortman T, Braun KVE, Ligthart S, Stranges S, et al. The role of global and regional DNA methylation and histone modifications in glycemic traits and type 2 diabetes: a systematic review. Nutr Metab Cardiovasc Dis. 2016;26(7):553–66.
Rönn T, Ling C. DNA methylation as a diagnostic and therapeutic target in the battle against Type 2 diabetes. Epigenomics. 2015;7(3):451–60.
Moher D, Shamseer L, Clarke M, Ghersi D, Liberati A, Petticrew M, et al. Preferred reporting items for systematic review and meta-analysis protocols (PRISMA-P) 2015 statement. Syst Rev. 2015;1(4):1.
Wells G, Shea B, O’Connell D, Peterson J, Welch, Losos M, et al. The Newcastle-Ottawa Scale (NOS) for Assessing the Quality of Nonrandomised Studies in Meta-Analyses. 2014. http://www.ohri.ca/programs/clinical_epidemiology/oxford.asp
PROSPERO. [cited 2023 Apr 18]. https://www.crd.york.ac.uk/prospero/
Evangelista JE, Xie Z, Marino GB, Nguyen N, Clarke DJB, Ma’ayan A. Enrichr-KG: bridging enrichment analysis across multiple libraries. Nucl Acids Res. 2023;gkad393.
Soriano-Tárraga C, Jiménez-Conde J, Giralt-Steinhauer E, Mola-Caminal M, Vivanco-Hidalgo RM, Ois A, et al. Epigenome-wide association study identifies TXNIP gene associated with type 2 diabetes mellitus and sustained hyperglycemia. Hum Mol Genet. 2016;25(3):609–19.
Wang Z, Peng H, Gao W, Cao W, Lv J, Yu C, et al. Blood DNA methylation markers associated with type 2 diabetes, fasting glucose, and HbA1c levels: an epigenome-wide association study in 316 adult twin pairs. Genomics. 2021;113(6):4206–13.
Kriebel J, Herder C, Rathmann W, Wahl S, Kunze S, Molnos S, et al. Association between DNA methylation in whole blood and measures of glucose metabolism: KORA F4 study. PLoS ONE. 2016;11(3):e0152314–e0152314.
Kulkarni H, Kos MZ, Neary J, Dyer TD, Kent JWJ, Göring HHH, et al. Novel epigenetic determinants of type 2 diabetes in Mexican-American families. Hum Mol Genet. 2015;24(18):5330–44.
Meeks KAC, Henneman P, Venema A, Addo J, Bahendeka S, Burr T, et al. Epigenome-wide association study in whole blood on type 2 diabetes among sub-Saharan African individuals: findings from the RODAM study. Int J Epidemiol. 2019;48(1):58–70.
Xiang Y, Wang Z, Hui Q, Gwinn M, Vaccarino V, Sun YV. DNA Methylation of TXNIP independently associated with inflammation and diabetes mellitus in twins. Twin Res Hum Genet. 2021;24(5):273–80.
Dawes K, Philibert W, Darbro B, Simons RL, Philibert R. Additive and interactive genetically contextual effects of HbA1c on cg19693031 methylation in type 2 diabetes. Genes (Basel). 2022;13(4):683.
Tsai HH, Shen CY, Ho CC, Hsu SY, Tantoh DM, Nfor ON, et al. Interaction between a diabetes-related methylation site (TXNIP cg19693031) and variant (GLUT1 rs841853) on fasting blood glucose levels among non-diabetics. J Transl Med. 2022;20(1):87.
Khamis A, Ning L, Balkau B, Bonnefond A, Canouil M, Roussel R, et al. Epigenetic changes associated with hyperglycaemia exposure in the longitudinal DESIR cohort. Diabetes Metab. 2022;48(4):101347.
Florath I, Butterbach K, Heiss J, Bewerunge-Hudler M, Zhang Y, Schöttker B, et al. Type 2 diabetes and leucocyte DNA methylation: an epigenome-wide association study in over 1,500 older adults. Diabetologia. 2016;59(1):130–8.
Kuroda A, Rauch TA, Todorov I, Ku HT, Al-Abdullah IH, Kandeel F, et al. Insulin gene expression is regulated by DNA methylation. PLoS ONE. 2009;4(9):6953.
Jeon JP, Koh IU, Choi NH, Kim BJ, Han BG, Lee S. Differential DNA methylation of MSI2 and its correlation with diabetic traits. PLoS ONE. 2017;12(5):e0177406–e0177406.
Dayeh T, Volkov P, Salö S, Hall E, Nilsson E, Olsson AH, et al. Genome-wide DNA methylation analysis of human pancreatic islets from type 2 diabetic and non-diabetic donors identifies candidate genes that influence insulin secretion. PLoS Genet. 2014;10(3):e1004160–e1004160.
Sjöholm LK, Ransome Y, Ekström TJ, Karlsson O. Evaluation of post-mortem effects on global brain DNA methylation and hydroxymethylation. Basic Clin Pharmacol Toxicol. 2018;122(2):208–13.
Vilahur N, Baccarelli AA, Bustamante M, Agramunt S, Byun HM, Fernandez MF, et al. Storage conditions and stability of global DNA methylation in placental tissue. Epigenomics. 2013;5(3):341–8.
Makki K, Froguel P, Wolowczuk I. Adipose tissue in obesity-related inflammation and insulin resistance: cells, cytokines, and chemokines. ISRN Inflammation. 2013;22(2013):1–12.
Dahlman I, Sinha I, Gao H, Brodin D, Thorell A, Rydén M, et al. The fat cell epigenetic signature in post-obese women is characterized by global hypomethylation and differential DNA methylation of adipogenesis genes. Int J Obes. 2015;39(6):910–9.
Fujiki K, Shinoda A, Kano F, Sato R, Shirahige K, Murata M. PPARγ-induced PARylation promotes local DNA demethylation by production of 5-hydroxymethylcytosine. Nat Commun. 2013;4(1):2262.
Pfeiffer S, Krüger J, Maierhofer A, Böttcher Y, Klöting N, El Hajj N, et al. Hypoxia-inducible factor 3A gene expression and methylation in adipose tissue is related to adipose tissue dysfunction. Sci Rep. 2016;6(1):27969.
Wang X, Cao Q, Yu L, Shi H, Xue B, Shi H. Epigenetic regulation of macrophage polarization and inflammation by DNA methylation in obesity. JCI Insight. 2016 Nov 17 [cited 2023 Jun 17]; 1(19). https://insight.jci.org/articles/view/87748
Nilsson E, Jansson PA, Perfilyev A, Volkov P, Pedersen M, Svensson MK, et al. Altered DNA methylation and differential expression of genes influencing metabolism and inflammation in adipose tissue from subjects with type 2 diabetes. Diabetes. 2014;63(9):2962–76.
Rodríguez-Rodero S, Menéndez-Torre E, Fernández-Bayón G, Morales-Sánchez P, Sanz L, Turienzo E, et al. Altered intragenic DNA methylation of HOOK2 gene in adipose tissue from individuals with obesity and type 2 diabetes. PLoS ONE. 2017;12(12):e0189153–e0189153.
Wang C, Ha X, Li W, Xu P, Zhang Z, Wang T, et al. Comparative gene expression profile and DNA methylation status in diabetic patients of Kazak and Han people. Medicine. 2018;97(36):e11982–e11982.
Ribel-Madsen R, Fraga MF, Jacobsen S, Bork-Jensen J, Lara E, Calvanese V, et al. Genome-wide analysis of DNA methylation differences in muscle and fat from monozygotic twins discordant for type 2 diabetes. PLoS ONE. 2012;7(12):e51302–e51302.
Andersen E, Ingerslev LR, Fabre O, Donkin I, Altıntaş A, Versteyhe S, et al. Preadipocytes from obese humans with type 2 diabetes are epigenetically reprogrammed at genes controlling adipose tissue function. Int J Obes. 2019;43(2):306–18.
Strausberg RL, Feingold EA, Grouse LH, Derge JG, Klausner RD, Collins FS, et al. Generation and initial analysis of more than 15,000 full-length human and mouse cDNA sequences. Proc Natl Acad Sci U S A. 2002;99(26):16899–903.
Walenta JH, Didier AJ, Liu X, Krämer H. The golgi-associated Hook3 protein is a member of a novel family of microtubule-binding proteins. J Cell Biol. 2001;152(5):923–34.
Massa López D, Thelen M, Stahl F, Thiel C, Linhorst A, Sylvester M, et al. The lysosomal transporter MFSD1 is essential for liver homeostasis and critically depends on its accessory subunit GLMP. Elife. 2019;8:e50025.
Kashoor I, Batlle D. Proximal renal tubular acidosis with and without Fanconi syndrome. Kidney Res Clin Pract. 2019;38(3):267–81.
Yamagata K. Roles of HNF1α and HNF4α in Pancreatic β-Cells. In: Vitamins & Hormones [Internet]. Elsevier; 2014 [cited 2023 Aug 5]. pp. 407–23. https://linkinghub.elsevier.com/retrieve/pii/B9780128001745000168
Hayhurst GP, Lee YH, Lambert G, Ward JM, Gonzalez FJ. Hepatocyte nuclear factor 4α (Nuclear Receptor 2A1) is essential for maintenance of hepatic gene expression and lipid homeostasis. Mol Cell Biol. 2001;21(4):1393–403.
Stoffel M, Duncan SA. The maturity-onset diabetes of the young (MODY1) transcription factor HNF4α regulates expression of genes required for glucose transport and metabolism. Proc Natl Acad Sci USA. 1997;94(24):13209–14.
Vedi M, Smith JR, Thomas Hayman G, Tutaj M, Brodie KC, De Pons JL, et al. 2022 updates to the rat genome database: a findable, accessible, interoperable, and reusable (FAIR) resource. Genetics. 2023;224(1):1042.
Han HS, Kang G, Kim JS, Choi BH, Koo SH. Regulation of glucose metabolism from a liver-centric perspective. Exp Mol Med. 2016;48(3):e218–e218.
Abderrahmani A, Yengo L, Caiazzo R, Canouil M, Cauchi S, Raverdy V, et al. Increased hepatic PDGF-AA signaling mediates liver insulin resistance in obesity-associated type 2 diabetes. Diabetes. 2018;67(7):1310–21.
Nilsson E, Matte A, Perfilyev A, de Mello VD, Käkelä P, Pihlajamäki J, et al. Epigenetic alterations in human liver from subjects with type 2 diabetes in parallel with reduced folate levels. J Clin Endocrinol Metab. 2015;100(11):E1491-1501.
Barres R, Osler ME, Yan J, Rune A, Fritz T, Caidahl K, et al. Non-CpG methylation of the PGC-1alpha promoter through DNMT3B controls mitochondrial density. Cell Metab. 2009;10(3):189–98.
Yuan W, Xia Y, Bell CG, Yet I, Ferreira T, Ward KJ, et al. An integrated epigenomic analysis for type 2 diabetes susceptibility loci in monozygotic twins. Nat Commun. 2014;5:5719–5719.
Kiechl S, Wittmann J, Giaccari A, Knoflach M, Willeit P, Bozec A, et al. Blockade of receptor activator of nuclear factor-κB (RANKL) signaling improves hepatic insulin resistance and prevents development of diabetes mellitus. Nat Med. 2013;19(3):358–63.
Dayeh T, Tuomi T, Almgren P, Perfilyev A, Jansson PA, De Mello VD, et al. DNA methylation of loci within ABCG1 and PHOSPHO1 in blood DNA is associated with future type 2 diabetes risk. Epigenetics. 2016;11(7):482–8.
Chen YT, Lin WD, Liao WL, Tsai YC, Liao JW, Tsai FJ. NT5C2 methylation regulatory interplay between DNMT1 and insulin receptor in type 2 diabetes. Sci Rep. 2020;10(1):16087.
Chen X, Lin Q, Wen J, Lin W, Liang J, Huang H, et al. Whole genome bisulfite sequencing of human spermatozoa reveals differentially methylated patterns from type 2 diabetic patients. Journal of diabetes investigation. 2019
Toperoff G, Aran D, Kark JD, Rosenberg M, Dubnikov T, Nissan B, et al. Genome-wide survey reveals predisposing diabetes type 2-related DNA methylation variations in human peripheral blood. Hum Mol Genet. 2012;21(2):371–83.
Volkov P, Bacos K, Ofori JK, Esguerra JLS, Eliasson L, Rönn T, et al. Whole-genome bisulfite sequencing of human pancreatic islets reveals novel differentially methylated regions in type 2 diabetes pathogenesis. Diabetes. 2017;66(4):1074–85.
García-Calzón S, Perfilyev A, Männistö V, de Mello VD, Nilsson E, Pihlajamäki J, et al. Diabetes medication associates with DNA methylation of metformin transporter genes in the human liver. Clin Epigenetics. 2017;9:102–102.
Zampieri M, Bacalini MG, Barchetta I, Scalea S, Cimini FA, Bertoccini L, et al. Increased PARylation impacts the DNA methylation process in type 2 diabetes mellitus. Clin Epigenet. 2021;13(1):114.
Qie R, Chen Q, Wang T, Chen X, Wang J, Cheng R, et al. Association of ABCG1 gene methylation and its dynamic change status with incident type 2 diabetes mellitus: the Rural Chinese Cohort Study. J Hum Genet. 2021;66(4):347–57.
Krause C, Sievert H, Geißler C, Grohs M, El Gammal AT, Wolter S, et al. Critical evaluation of the DNA-methylation markers ABCG1 and SREBF1 for Type 2 diabetes stratification. Epigenomics. 2019;11(8):885–97.
van Otterdijk SD, Binder AM, Szarc Vel Szic K, Schwald J, Michels KB. DNA methylation of candidate genes in peripheral blood from patients with type 2 diabetes or the metabolic syndrome. PLoS ONE. 2017;12(7):e0180955–e0180955.
Toperoff G, Kark JD, Aran D, Nassar H, Ahmad WA, Sinnreich R, et al. Premature aging of leukocyte DNA methylation is associated with type 2 diabetes prevalence. Clin Epigenetics. 2015;7(1):35–35.
Huang S, Qin P, Chen Q, Zhang D, Cheng C, Guo C, et al. Association of FTO gene methylation with incident type 2 diabetes mellitus: A nested case–control study. Gene. 2021;786: 145585.
Zhang D, Cheng C, Cao M, Wang T, Chen X, Zhao Y, et al. TXNIP hypomethylation and its interaction with obesity and hypertriglyceridemia increase type 2 diabetes mellitus risk: a nested case-control study. J Diabetes. 2020;12(7):512–20.
Hu F, Zhang Y, Qin P, Zhao Y, Liu D, Zhou Q, et al. Integrated analysis of probability of type 2 diabetes mellitus with polymorphisms and methylation of KCNQ1 gene: a nested case-control study. J Diabetes. 2021;13(12):975–86.
Ling C, Del Guerra S, Lupi R, Rönn T, Granhall C, Luthman H, et al. Epigenetic regulation of PPARGC1A in human type 2 diabetic islets and effect on insulin secretion. Diabetologia. 2008;51(4):615–22.
Wittenbecher C, Ouni M, Kuxhaus O, Jähnert M, Gottmann P, Teichmann A, et al. Insulin-like growth factor binding protein 2 (IGFBP-2) and the risk of developing type 2 diabetes. Diabetes. 2019;68(1):188–97.
Chambers JC, Loh M, Lehne B, Drong A, Kriebel J, Motta V, et al. Epigenome-wide association of DNA methylation markers in peripheral blood from Indian Asians and Europeans with incident type 2 diabetes: a nested case-control study. Lancet Diabetes Endocrinol. 2015;3(7):526–34.
Sandovici I, Hammerle CM, Cooper WN, Smith NH, Tarry-Adkins JL, Dunmore BJ, et al. Ageing is associated with molecular signatures of inflammation and type 2 diabetes in rat pancreatic islets. Diabetologia. 2016;59(3):502–11.
Lee YH, Kang ES, Kim SH, Han SJ, Kim CH, Kim HJ, et al. Association between polymorphisms in SLC30A8, HHEX, CDKN2A/B, IGF2BP2, FTO, WFS1, CDKAL1, KCNQ1 and type 2 diabetes in the Korean population. J Hum Genet. 2008;53(11–12):991–8.
Liu Y, Zhou DZ, Zhang D, Chen Z, Zhao T, Zhang Z, et al. Variants in KCNQ1 are associated with susceptibility to type 2 diabetes in the population of mainland China. Diabetologia. 2009;52(7):1315–21.
Hu C, Wang C, Zhang R, Ma X, Wang J, Lu J, et al. Variations in KCNQ1 are associated with type 2 diabetes and beta cell function in a Chinese population. Diabetologia. 2009;52(7):1322–5.
Jonsson A, Isomaa B, Tuomi T, Taneera J, Salehi A, Nilsson P, et al. A variant in the KCNQ1 gene predicts future type 2 diabetes and mediates impaired insulin secretion. Diabetes. 2009;58(10):2409–13.
Yasuda K, Miyake K, Horikawa Y, Hara K, Osawa H, Furuta H, et al. Variants in KCNQ1 are associated with susceptibility to type 2 diabetes mellitus. Nat Genet. 2008;40(9):1092–7.
Unoki H, Takahashi A, Kawaguchi T, Hara K, Horikoshi M, Andersen G, et al. SNPs in KCNQ1 are associated with susceptibility to type 2 diabetes in East Asian and European populations. Nat Genet. 2008;40(9):1098–102.
Müssig K, Staiger H, Machicao F, Kirchhoff K, Guthoff M, Schäfer SA, et al. Association of Type 2 diabetes candidate polymorphisms in KCNQ1 with incretin and insulin secretion. Diabetes. 2009;58(7):1715–20.
Qian Y, Dong M, Lu F, Li H, Jin G, Hu Z, et al. Joint effect of CENTD2 and KCNQ1 polymorphisms on the risk of type 2 diabetes mellitus among Chinese Han population. Mol Cell Endocrinol. 2015;407:46–51.
Been LF, Ralhan S, Wander GS, Mehra NK, Singh J, Mulvihill JJ, et al. Variants in KCNQ1 increase type II diabetes susceptibility in South Asians: a study of 3,310 subjects from India and the US. BMC Med Genet. 2011;12(1):18.
Hu Y, Shi P, He K, Zhu YQ, Yang F, Yang M, et al. Methylation of Tcf712 promoter by high-fat diet impairs β-cell function in mouse pancreatic islets. Diabetes Metab Res Rev. 2018;34(4): e2980.
Flurkey K, Currer JM, Harrison D. Mouse models in aging research. In: The mouse in biomedical research. Elsevier; 2007, pp. 637–72.
Papadopoulou S, Edlund H. Attenuated Wnt signaling perturbs pancreatic growth but not pancreatic function. Diabetes. 2005;54(10):2844–51.
Kumar A, Mittal R. Mapping Txnip: key connexions in progression of diabetic nephropathy. Pharmacol Rep. 2018;70(3):614–22.
Minn AH, Hafele C, Shalev A. Thioredoxin-interacting protein is stimulated by glucose through a carbohydrate response element and induces β-cell apoptosis. Endocrinology. 2005;146(5):2397–405.
Tarling EJ, Edwards PA. ATP binding cassette transporter G1 (ABCG1) is an intracellular sterol transporter. Proc Natl Acad Sci USA. 2011;108(49):19719–24.
Westerterp M, Bochem AE, Yvan-Charvet L, Murphy AJ, Wang N, Tall AR. ATP-binding cassette transporters, atherosclerosis, and inflammation. Circ Res. 2014;114(1):157–70.
Wilson PW, McGEE DL, Kannel WB. Obesity, very low density lipoproteins, and glucose intolerance over fourteen years: The Framingham Study. Am J Epidemiol. 1981;114(5):697–704.
Shah UJ, Xie W, Flyvbjerg A, Nolan JJ, Højlund K, Walker M, et al. Differential methylation of the type 2 diabetes susceptibility locus KCNQ1 is associated with insulin sensitivity and is predicted by CpG site specific genetic variation. Diabetes Res Clin Pract. 2019;148:189–99.
Mattei AL, Bailly N, Meissner A. DNA methylation: a historical perspective. Trends Genet. 2022;38(7):676–707.
Anastasiadi D, Esteve-Codina A, Piferrer F. Consistent inverse correlation between DNA methylation of the first intron and gene expression across tissues and species. Epigenetics Chromatin. 2018;11(1):37.
Ball MP, Li JB, Gao Y, Lee JH, LeProust EM, Park IH, et al. Targeted and genome-scale strategies reveal gene-body methylation signatures in human cells. Nat Biotechnol. 2009;27(4):361–8.
Berumen J, Orozco L, Betancourt-Cravioto M, Gallardo H, Zulueta M, Mendizabal L, et al. Influence of obesity, parental history of diabetes, and genes in type 2 diabetes: a case-control study. Sci Rep. 2019;9(1):2748.
Andrade S, Morais T, Sandovici I, Seabra AL, Constância M, Monteiro MP. Adipose tissue epigenetic profile in obesity-related dysglycemia: a systematic review. Front Endocrinol. 2021;29(12): 681649.
Ryan J, Wrigglesworth J, Loong J, Fransquet PD, Woods RL. A systematic review and meta-analysis of environmental, lifestyle, and health factors associated with DNA methylation age. J Gerontol Ser A. 2020;75(3):481–94.
Oblak L, Van Der Zaag J, Higgins-Chen AT, Levine ME, Boks MP. A systematic review of biological, social and environmental factors associated with epigenetic clock acceleration. Ageing Res Rev. 2021;69: 101348.
Krolevets M, Cate VT, Prochaska JH, Schulz A, Rapp S, Tenzer S, et al. DNA methylation and cardiovascular disease in humans: a systematic review and database of known CpG methylation sites. Clin Epigenet. 2023;15(1):56.
Department of Economic and Social Affairs UN. India to overtake China as world’s most populous country in April 2023, United Nations projects. [cited 2023 Jun 8]. https://www.un.org/en/desa/india-overtake-china-world-most-populous-country-april-2023-united-nations-projects
Anjana RM, Unnikrishnan R, Deepa M, Pradeepa R, Tandon N, Das AK, et al. Metabolic non-communicable disease health report of India: the ICMR-INDIAB national cross-sectional study (ICMR-INDIAB-17). Lancet Diabetes Endocrinol. 2023;11(7):474–89.
Hwang JY, Lee HJ, Go MJ, Jang HB, Choi NH, Bae JB, et al. Genome-wide methylation analysis identifies ELOVL5 as an epigenetic biomarker for the risk of type 2 diabetes mellitus. Sci Rep. 2018;8(1):14862–14862.
Zou L, Yan S, Guan X, Pan Y, Qu X. Hypermethylation of the PRKCZ Gene in Type 2 diabetes mellitus. J Diabetes Res. 2013;2013:721493–721493.
Chen YT, Liao JW, Tsai YC, Tsai FJ. Inhibition of DNA methyltransferase 1 increases nuclear receptor subfamily 4 group A member 1 expression and decreases blood glucose in type 2 diabetes. Oncotarget. 2016;7(26):39162–70.
Davegårdh C, Säll J, Benrick A, Broholm C, Volkov P, Perfilyev A, et al. VPS39-deficiency observed in type 2 diabetes impairs muscle stem cell differentiation via altered autophagy and epigenetics. Nat Commun. 2021;12(1):2431.
Whytock KL, Pino MF, Sun Y, Yu G, De Carvalho FG, Yeo RX, et al. Comprehensive interrogation of human skeletal muscle reveals a dissociation between insulin resistance and mitochondrial capacity. Am J Physiol-Endocrinol Metabol. 2023;325(4):E291-302.
Acknowledgements
AM is supported by the Wellcome Trust/DBT India Alliance Fellowship [Grant Number IA/CPHI/19/1/504593]. We thank Ms. Ramya for her insightful comments.
Funding
This research did not receive any specific grant from any funding agency in the public, commercial or not-for-profit sector.
Author information
Authors and Affiliations
Contributions
AM was involved in conceptualization, review and editing of the manuscript. NN, JKV and PCN were involved in data extraction, formal analysis, investigation and writing the manuscript. All authors have read and approved the final manuscript.
Corresponding author
Ethics declarations
Competing interests
The authors declare no competing interests.
Ethics approval and consent to participate
Not applicable.
Consent for publication
Not applicable.
Conflict of interest
The authors declare no conflict of interest.
Additional information
Publisher's Note
Springer Nature remains neutral with regard to jurisdictional claims in published maps and institutional affiliations.
Supplementary Information
Additional file 1 Search strategy for the systematic review of DNA methylation association with T2DM
13148_2024_1670_MOESM2_ESM.docx
Additional file 2 Qualitative assessment of research articles included in the review based on the New Castle Ottawa Scale (NOS)
Rights and permissions
Open Access This article is licensed under a Creative Commons Attribution 4.0 International License, which permits use, sharing, adaptation, distribution and reproduction in any medium or format, as long as you give appropriate credit to the original author(s) and the source, provide a link to the Creative Commons licence, and indicate if changes were made. The images or other third party material in this article are included in the article's Creative Commons licence, unless indicated otherwise in a credit line to the material. If material is not included in the article's Creative Commons licence and your intended use is not permitted by statutory regulation or exceeds the permitted use, you will need to obtain permission directly from the copyright holder. To view a copy of this licence, visit http://creativecommons.org/licenses/by/4.0/. The Creative Commons Public Domain Dedication waiver (http://creativecommons.org/publicdomain/zero/1.0/) applies to the data made available in this article, unless otherwise stated in a credit line to the data.
About this article

Cite this article
Nadiger, N., Veed, J.K., Chinya Nataraj, P. et al. DNA methylation and type 2 diabetes: a systematic review. Clin Epigenet 16, 67 (2024). https://doi.org/10.1186/s13148-024-01670-6
Received:
Accepted:
Published:
DOI: https://doi.org/10.1186/s13148-024-01670-6