
Abstract
Two new Cobalt(II) complexes 12 and 13 have been synthesized from 2-[(E)-(3-acetyl-4-hydroxyphenyl)diazenyl]-4-(2-hydroxyphenyl)thiophene-3-carboxylic acid (11) as a novel ligand. These three new compounds were characterized on the basis of their powder X-Ray Diffraction, UV–Vis, IR, NMR, elemental analysis and MS spectral data. DFT/B3LYP mode of calculations were carried out to determine some theorical parameters of the molecular structure of the ligand. The purity of the azoic ligand and the metal complexes were ascertained by TLC and melting points. The analysis of the IR spectra of the polyfunctionalized azo compound 11 and its metal complexes 12 and 13, reveals that the coordination patterns of the ligand are hexadentate and tetradentate respectively. Based on the UV–Vis electronic spectral data and relevant literature reports, the ligand and derived complexes were assigned the E (trans) isomer form. Likewise, octahedral and square-planar geometries were respectively assigned to the cobalt(II) complexes. The broth microdilution method was used for antibacterial assays through the determination of minimum inhibitory concentration (MIC) and minimum bactericidal concentration (MBC). The ligand 11 displayed moderate antibacterial activity (MIC = 32–128 μg/mL) against Staphylococcus aureus ATCC25923, Escherichia coli ATCC25922, Pseudomonas aeruginosa and Klebsiella pneumoniae 22. The octahedral cobalt(II) complex 12 showed moderate activity against Pseudomonas aeruginosa (MIC = 128 μg/mL) and Klebsiella pneumoniae 22 (MIC = 64 μg/mL) and none against Staphylococcus aureus ATCC25923 and Escherichia coli ATCC25922, whereas the square-planar complex 13 displayed moderate activity only on Klebsiella pneumoniae 22 (MIC = 64 μg/mL).
Graphical abstract

Introduction
Antimicrobial resistance (AMR) appears over time as a phenomenon mainly linked to the genetic evolution of pathogens. The direct consequence of this AMR is that it makes infections more difficult to treat [1,2,3]. There is therefore a constant search for new antimicrobial compounds from natural sources [4,5,6,7] or via synthetic routes [8,9,10] as possible solutions. Thus, among the broad range of bioactive molecules of synthetic origin, coordination compounds in general and those based on hybrid heterocyclic ligands such as azo thiophenes scaffolds such as 1, 2 and 3 (Scheme 1) in particular [11, 12], represent the most promising molecules for the discovery of novel antimicrobial drugs [13, 14].
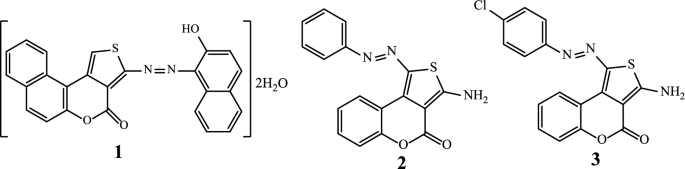
Structures of some azo thiophenes compounds
Such hybrid molecules are expected to combine the properties of the chelating heterocyclic ligands with those of the central metal ions and to exhibit much better biological profiles [15,16,17,18].
Azo compounds have a long history and are important part of our daily life. They are mainly used as dyes and pigments in various fields, such as: textile dyeing (mordant yellow 10 (4) [19]); the food (tartrazine (5) [20]) and cosmetics (red 6 (6) [21]) industries (Scheme 2).
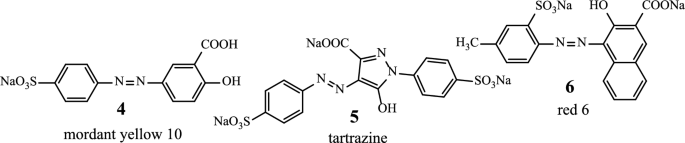
Structures of some industrial azo dyes
They also have many other applications in physicochemistry, analysis, catalysis [22, 23] and pharmacy [24] because of their special complexing abilities, sensitivity as chromogenic reagents, usage in spectrophotometry and ability to detect a variety of metal ions. In addition, they have been of major importance in drug development due to their antioxidant, anti-inflammatory, fungicidal, antidiabetic, bacteriostatic, and antiseptic activities [25,26,27]. These compounds and their derivatives have some potential applications in different fields, including industrial and biological research [28, 29]. For instance, in the dyeing of wool and synthetic polyamides, the azo complexes of Cr(III) and Co(III) are extensively utilized in industry [30], as well as the azo complexes of Ni(II) and Cu(II), which are utilized in biology as antibacterial and anticancer medications [31, 32]. Azo compounds having in their structures both the thiophenic and phenolic fragments (which separately have each amazing antiviral, antibacterial, antifungal, cytotoxic [33], antioxidant and antiradical [34] properties), are expected to combine the different properties of the latter in the hybrid structures [35].
Cobalt is the chemical element with atomic number 27, symbol Co and electronic structure [Ar]4s23d7 belonging to block “d” of the periodic table of elements. It is relatively rare, gray in color, ductile, fragile and magnetic. Relatively unreactive, it does not oxidize in humid or dry air at normal environmental temperatures. The two valence states, cobaltous(II) and cobaltic(III), melt at 1493 °C with limited water solubility. These properties are similar to those of iron and nickel, which are neighbors in the periodic table [36]. It is one of the most important transition metals from a biological point of view. Its ions act in the activation of cholinesterase and provide protection against excessive oxygen pressure in the lungs during respiration. They also act as bacteriostatic agents comparable with antibiotics [37]. The cobalt ion is an integral part of the vitamin B12 molecule [38] which has a key role in the maturation of red blood cells, the chemical name of this vitamin, cobalamin, also evokes the importance of the cobalt which is present in it at 4% [39, 40]. Cobalt complexes have also been suggested to possess antirheumatic, antihistamine [41, 42] antifungals and antivirals properties [43]. Cobalt coordination compounds are the earliest known metal complexes and coordination chemistry was founded with the study of these promising compounds [44].
As part of a continuing interest in the chemistry and biological properties of azo compounds having in their structures thiophenic and phenolic fragments, we have undertaken in this study to determine how they coordinate with cobalt(II) in order to evaluate the antimicrobial activities of the synthesized product and those of their cobalt(II) complexes as well, on certain resistant bacterial strains.
Results and discussion
Chemistry
The new azoic ligand 11 was prepared using the thienocoumarin 7 as starting material. Procedure for the preparation of 7 has been reported earlier [45, 46]. The general preparation process of 11 is displayed in Scheme 3 [46, 47].
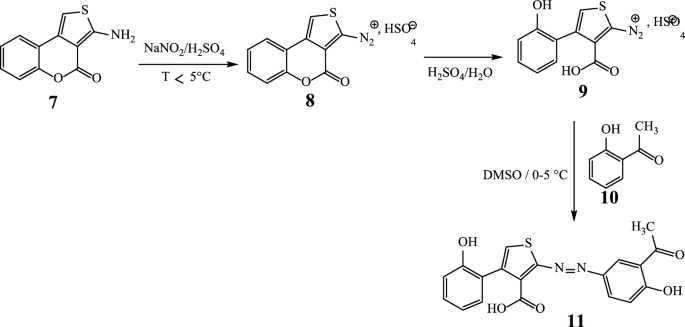
Reaction sequences for the preparation of compound 11
The structure of substrate ligand 11 (C19H14N2O5S) was confirmed with its physical and spectroscopic data. Reaction of compound 11 (previously dissolved in 4 mL of DMSO) with Co(C2O4)‧2H2O (dissolves in EtOH/MeOH 2:1) with constant stirring at room temperature for 48 h gave compounds 12 and 13 (Scheme 4).
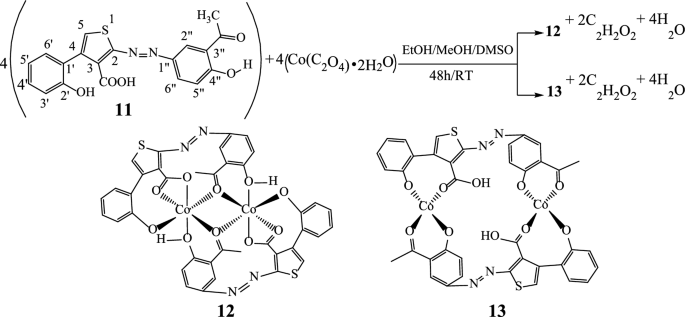
Reaction sequences to the complexes 12 and 13 ([Co2(C19H12N2O5S)2])
The ligand and the complexes were obtained as dark green, black and green powders respectively, air stable and soluble in DMSO and acetone. The elemental analysis (C, H, N, and S) and melting points data of these compounds are recorded in Table 1.
The UV–VIS spectrum of ligand 11 showed a strong band in the ultraviolet range at 332 nm and moderate bands above 350 nm, attributed to the π → π* and n → π* transitions (due to the azo bridge), respectively (Fig. 1). The maximum absorption peak of azo compounds in general is around 330 nm in the UV–visible absorption spectrum due to the π → π* electronic transition of trans isomers [48]. In the context of this study, these absorption maxima observed in the ultraviolet region of the UV–Vis spectra of ligand 11 and of the synthesized complexes, 12 and 13, are found at 332 nm, close to that reported in the literature. Furthermore, the electronic spectral data were very useful for the assignments of the stereochemistry of the metal complexes based on the positions and number of d → d transition peaks.

Electronic spectra of ligand 11 (black) and cobalt(II) complexes 12 (blue) and 13 (green)
For the cobalt (II) complexes, the only possible configurations found in the literature are square-plane, tetrahedral and octahedral. Therefore, for complex of cobalt(II) hexadentate 12, the only possible geometry that could be envisaged is octahedral. In fact, its electronic spectrum shows two bands of low intensities in the visible range. The first at 490 nm is attributed to the 4T1g(F) → 4A2g(F) transition and the second around 600 nm is due to the 4T1g(F) → 4T1g(P) transition [49]. These 2 absorptions are characteristic of an octahedral environment around the cobalt(II) ion complexes [50].
For the tetradentate complex 13, a square-planar or tetrahedral configuration could be envisaged. Based on its electronic spectrum, it was possible to differentiate between these two alternative configurations as follows. The absence of absorptions between 600 and 700 nm which are characteristic for tetrahedral cobalt(II) complexes [51, 52], ruled out the hypothesis of a tetrahedral geometry for 13. Moreover, the presence of an absorption (of very low intensity) above 500 nm (Fig. 1) makes more plausible the hypothesis of a low-spin square-planar geometry for this complex [53, 54]. As a consequence, on the basis of the LCAO approach, the central Co(II) ions should be hybridized sp3d2 and dsp2 respectively to comply with the octahedral and square-planar geometries of the coordination spheres in compounds 12 and 13 respectively. The absorption spectra of the ligand and complexes are represented in Fig. 1.
In the IR spectrum, the free ligand C19H14N2O5S shows a very strong and sharp band with well-structured peaks at 1726 and 1668 cm−1 due to the ν(C=O) (ketone and acid respectively) present in the molecule (Fig. 2). In the IR spectra of the complexes [Co2(C19H12N2O5S)2] (Figs. 3a and 4a), these bands appear but with a pronounced shift towards higher frequencies at 1748 cm−1 and 1695 cm−1 respectively (for 13), and towards lower frequencies around 1713 cm−1 (for 12), indicating the involvement of the corresponding oxygen in the coordination with the central Co2+ ion. In these complexes, the values of ν(N=N) observed at 1446 cm−1 in the ligand remain constant, meaning that the azo function does not participate in the coordination. The other atoms involved in the coordination bonds in these molecules are the oxygen atoms of the two phenolic hydroxyl groups and that of the carboxylic acid function present in ligand 11. The absence of the ν(OH) frequencies in the IR spectrum of the complex 13, observed at 3541 cm−1 and 3248 cm−1 (Fig. 4b) in the starting ligand and assigned to free (2'-OH) and chelated (4''-OH) phenolic hydroxyls respectively, suggests the participation of the corresponding OH groups in the coordination with deprotonation (Fig. 4a). In the IR spectrum of the complex 12, the signal of the hydroxyl (2'-OH) appears in the higher frequency region at 3258 cm−1 and one can notice the disappearance of the signal of the carboxylic acid hydroxyl around 2575 cm−1. These observations are suggestive of the participation of the corresponding oxygen atoms in the coordination without and with deprotonation respectively. The new bands that appeared in the IR spectrum of the complex in the region 521–570 cm−1 at 548 and 528 cm−1 (complex 12) and at 530 cm−1 (complex 13) were attributed to the Co–O bonds [55, 56] between the central cobalt ion and all the oxygen atoms involved in coordination. The relative intensities as well as the provisional assignments of the various bands mentioned above are given in the Table 2.
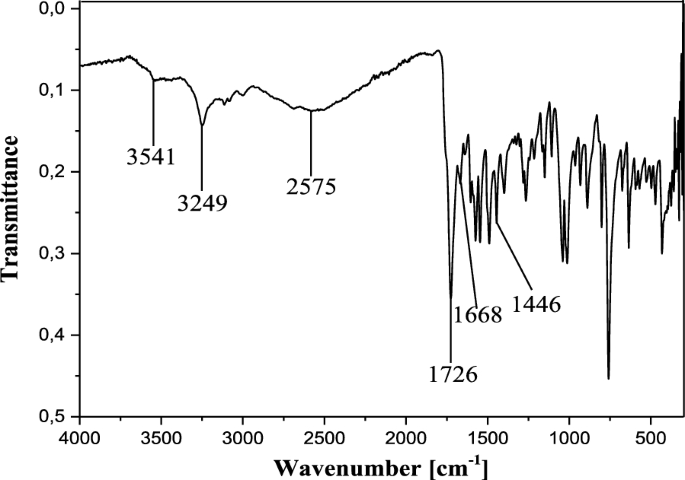
Infrared spectrum of compound 11

a Infrared spectrum of compound 12. b Superposed infrared spectra of compounds 11 (black) and 12 (blue)

a Infrared spectrum of compound 13. b Superposed infrared spectra of compounds 11 (black) and 13 (green)
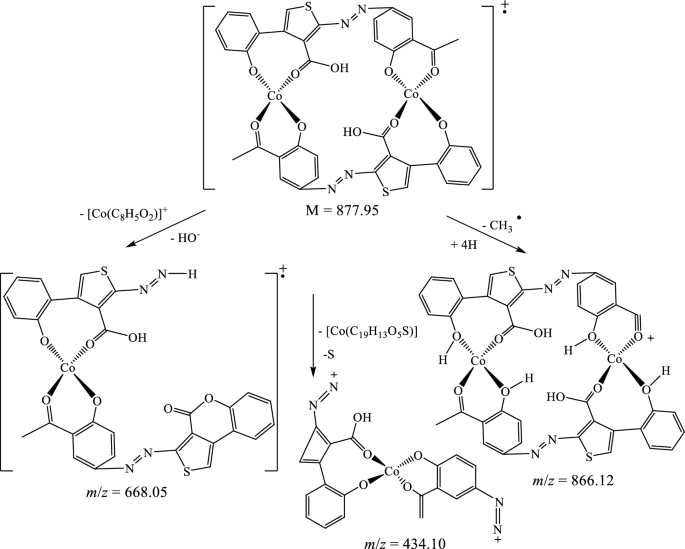
The suggested structures were supported by the mass spectral data of the free azo dye ligand and its Co(II) complexes, which were compatible with the molecular ion fragments (Fig. 5). Some of the fragments observed in the mass spectra of the ligand 11 and its Co(II) complexes 12 and 13 are rationalized in the fragmentation Schemes 5, 6 and 7.

a HRESI + mass spectrum of azo ligand 11. b HRESI + mass spectrum of complex 12. c HRESI + mass spectrum of complex 13
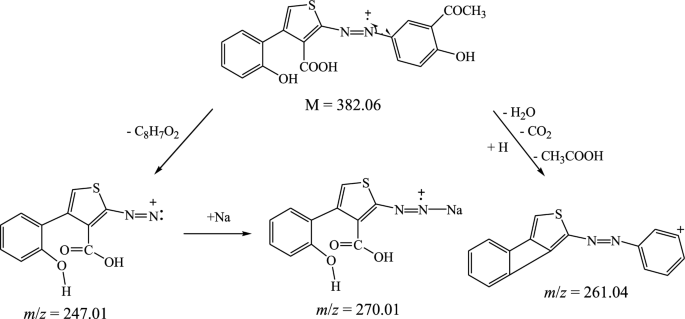
Suggested fragmentation pattern of azo ligand 11
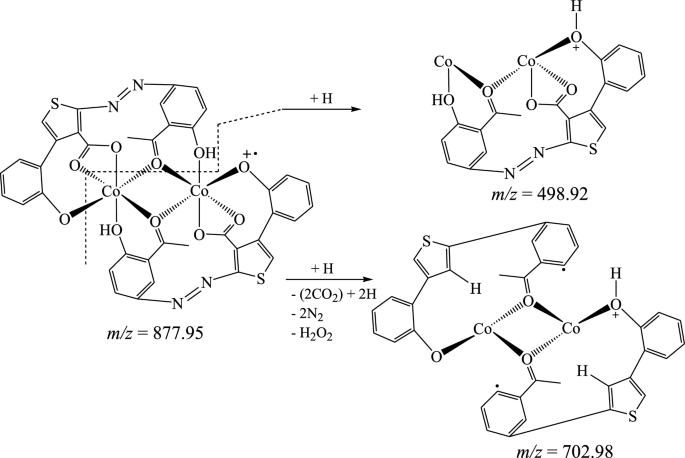
Suggested fragmentation pattern of Co(II) complex 12
Suggested mass fragmentation pattern of Co(II) complex 13
Comparative 1H NMR spectra of the ligand (Fig. 6a) and the complexes (Fig. 6b, c) clearly show that the ligand undergoes deprotonation with complexation. Indeed, in the spectra of complexes 12 (Fig. 6b) and 13 (Fig. 6c), the 2′-OH at 2.99 ppm in the ligand was not seen in Fig. 6b, whereas, the 2′-OH at 2.99 ppm and 4″-OH at 11.93 ppm in the ligand were not seen in Fig. 6c. These observations confirm the formation of the Co–O bonds with the corresponding oxygen atoms. Moreover the same signals with almost the same multiplicities are observed in the spectra of the ligand and the complexes with respect to the aromatic protons.

a 1H-NMR spectrum of the ligand 11. b 1H-NMR spectrum of the complex 12. c.1H-NMR spectrum of the complex 13
The 13C NMR spectrum of the ligand 11 (C19H14N2O5S) (Fig. 7a) displays 19 signals due to the 19 carbon atoms present in this molecule. The most important being the carbon atoms bearing the coordinating oxygen atoms, found at 205.2 ppm, 184.8 ppm, 161.3 ppm and 155.5 ppm for the carbons 3″–COCH3, 3–COOH, C-4″ and C-2′, respectively.

a 13C-NMR spectrum of the ligand 11. b 13C-NMR spectrum of the complex 12. c.13C-NMR spectrum of the complex 13
Thus, the comparison of this spectrum with those of the [Co2(C19H12N2O5S)2] complexes 12 and 13 (Fig. 7b, c) made it possible to assign the carbonyls 3″-COCH3 and 3-COOH the chemical shift values 195.0 ppm and 179.9 ppm, respectively, and the phenolic carbons C-4″ and C-2′ the values 156.5 ppm and 156.0 ppm, respectively in the complex 12 whereas the values 192.4 ppm, 185.6 ppm, 161.4 ppm and 156.7 ppm could comparatively be assigned in the complex 13, respectively for the above-mentioned atoms. The chemical shifts of the ligand and the complexes are summarized in Table 3.
Figure 8 summarizes the two most significant interactions that were seen in the HSQC spectra of the ligand and compounds 12 and 13. The first of these is the correlation spots between the methyl protons at 2.63 ppm (in 11) (one signal), and at 2.63 and 2.61 ppm (in 13) (two signals) and their carbons at 39.1 ppm and at 39.9 and 39.8 ppm respectively. On the other hand, correlation spots between protons H-6' at 8.87 ppm (in 12) and at 8.83 ppm (in 13) and their carbons at 129.6 ppm (in 12) and at 129.9 ppm (in 13) indicate the presence of the acetophenone fragment and that of the thiophenic moieties on each side of the N = N bridge.

HSQC spectra of complexes 12 (a) and 13 (b) with some correlations
The long-distance couplings (2 J and 3 J) between the protons and the carbons of the chelating ligand moieties were highlighted by the HMBC experiment (Fig. 9). Indeed, it allowed to reconstruct the carbon skeleton of the coupling fragment through correlation spots between the 4″-OH proton (11.93 ppm) and the C-4″ carbons (161.3 ppm) and C-5″ (118.1 ppm), the proton H-6″ (around 7.85 ppm) and the carbons C-2″ (136.8 ppm) and C-4″ (161.3 ppm), the H-5″ proton (6.91 ppm) and the C-3″ carbons (120.0 ppm) and finally between the methyl CH3 (2.60 ppm) and the carbonyl C=O (205.1 ppm), thus eliminating the hypothesis of multiple couplings on the aromatic ring of the coupler. Some of these correlations were also found in the HMBC spectra of the complexes despite their high complexity due to the overlapping of homologous proton systems of the chelating ligand moieties.

HMBC spectra of complexes 12 (a) and 13 (b) with some correlations
The COSY 1H-1H experiment of the ligand (Fig. 10) clearly showed the correlation squares between the aromatic protons belonging to the molecular fragments on either side of the azo bridge. For the complexes, the most visible correlations are those of the benzene ring for the above mentioned similar reasons (Fig. 11).

COSY 1H-1H spectrum of ligand 11 with some correlations

COSY 1H-1H spectra of complexes 12 (a) and 13 (b) with some correlations
Theoretical calculations were performed on the ligand to determine the most reactive sites of the unsaturated system. The energies and electronic densities of the frontier molecular orbitals (FMO), HOMO and LUMO, as well as the molecular electrostatic potential (MEP) are important electronic parameters for this purpose [57, 58]. The structures of the FMO and the MEP obtained from a B3LYP/6-311G mode of calculations are given in Fig. 12. The EHOMO and ELUMO values are—6.114 eV and—2.960 eV respectively, resulting in an energy gap of 3.15 eV.

Structures of the FMO (HOMO and LUMO) (a) and MEP (b) of compound 11
XDR analysis
The powder X-ray diffraction of ligand 11 and complex 13 are different from each other (Fig. 13) and indicates a good crystalline structure and a good purity of these compounds. The spectra of compound 13 shows a significant number of sharp bands or peaks. This suggests that it is made up of well-organized particles. All the new peaks exhibited in the diffractogram of the complex 13 are in agreement with the fact that it is different from the ligand 11. The optimized 3D view of compound 11, 12 and 13 are clearly presented in Fig. 14.

Ex situ PXRD pattern (Cu Kα1 radiation) of XRD of compounds 11 (black) and 13 (green)

Optimized 3D view of compounds 11, 12 and 13. The structures were drawn with the program ACD/3D viewer (freeware) of ACD/Labs
Biology
Antibacterial activity
The comparative study of the activity of the starting 2-aminothiophen (7) and the tree new compounds (11, 12 and 13) was carried out on bacteria strains such as Staphylococcus aureus ATCC25923, Pseudomonas aeruginosa, Escherichia coli ATCC25922 and Klebsiella pneumoniae 22. Screening results showed that compound 7 had a moderate activity (CMI = 128 µg/mL) and (CMI = 64 µg/mL) on Escherichia coli ATCC25922 and Klebsiella pneumoniae 22 respectively, but its highest activity (CMI = 32 µg/mL) was found on Pseudomonas aeruginosa and Staphylococcus aureus ATCC25923 strains. These activities decrease in the azoic ligand 11 on Pseudomonas aeruginosa (CMI = 64 µg/mL) and Staphylococcus aureus ATCC25923 (CMI = 128 µg/mL); increase on Escherichia coli ATCC25922 (CMI = 32 µg/mL) and remains constant on Klebsiella pneumoniae 22 (CMI = 64 µg/mL). Complex 12 had no activity on two strains Staphylococcus aureus ATCC25923 and Escherichia coli ATCC25922, but had a moderate activity (CMI = 128 µg/mL) and (CMI = 64 µg/mL) on Pseudomonas aeruginosa and Klebsiella pneumoniae 22 respectively, while complex 13 had no activity on all strains except on Klebsiella pneumoniae 22 (CMI = 64 µg/mL) where the activity remains constant with respect to precursor 7. All data are summarized in Table 4.
Cytotoxic activity
To investigate the potential use of compounds 7, 11, 12 and 13, their cytotoxicity was evaluated. None of the tested samples showed hemolytic activities against red blood cells at concentrations up to 128 µg/mL (Table 5). However, at the highest concentration tested in this study (256 μg/mL), complexes caused less than 4% of hemolysis. This finding highlights that complexes are slightly hemolytic at 256 μg/mL.
Conclusion
In summary, two novel binuclear complexes of Co(II) with a novel multifunctional azo ligand incorporating a thiophenic and a phenolic moiety have been prepared, and their structures fully assigned on the basis of the available elemental, powder XRD and spectroscopic data. IR spectral data show that ligand 11 behaves as a hexadentate ligand in 12, coordinating via all electron-donating oxygen atoms, and as a tetradentate ligand in 13, coordinating via all oxygen atoms except that of carboxylic acid functions. It was established that in both complexes the central Co(II) ions were sp3d2 and dsp2 hybridized in 12 and 13, respectively. The models of metal ion binding to the coordination sites of chelating ligands display octahedral and planar-square geometries in complexes 12 and 13 respectively in agreement with their UV–Vis data. From the biological screenings carried out on selected strains of multiresistant bacteria, it was found that compared to the free ligand, the coordination compounds have relatively very low activity on most of the tested strains. Nevertheless, further similar studies need to be carried out on a more large number of pathogens before a rational conclusion could be drawn on the structure–activity relationship linked with the coordination process.
Materials and methods
Instrumental method
All the reagents mentioned in this work were purchased from Aldrich and Fluka and were used without further purification. Melting points are corrected and were determined with a STUART SCIENTIFIC Melting Point Apparatus Model SMP3 at a heating rate of 2 °C/min. TLCs were performed on prefabricated silica gel plates, consisting of silica gel 60 F254 on aluminum foil with a fluorescent indicator. A mixture of ethyl acetate and hexane (1:1) was used as eluent to develop the TLC plates and the spots were visualized using iodine vapor or by spraying with 10% H2SO4 and heating at 100 ℃ for 2 min. The IR spectra were recorded with a Bruker Alpha spectrophotometer using the ATR (Attenuated Total Reflectance) technique on a diamond crystal. The HRESI-MS spectra were recorded on a Compact BRUKER brand spectrometer with a DIONEX Ultimate 3000 brand LC chain. Nuclear magnetic resonance (NMR) experiments (1D and 2D) were performed in DMSO-d6 and MeOH-d4/CCl4 on a 400 MHz JEOL ECZ spectrophotometer equipped with 5-mm digital auto tune Royal probe (JEOL USA, Peabody, MA). 1H-NMR spectral data were recorded at 400 MHz, while 13C-NMR data were measured at 100 MHz both with TMS used as internal reference. Powder XRD data was collected on a STOE Stadi-p X-ray powder diffractometer (STOE & Cie GmbH, Darmstadt, Germany) with Cu Kα1 radiation (λ = 1.54056 Å; Ge monochromator; flat samples) in transmission geometry with a DECTRIS® MYTHEN 1 K detector (DECTRIS, Baden-Daettwil, Switzerland). Elemental analyses were performed with a Euro Vector CHNS-O element analyzer (Euro EA 3000) or a vario MICRO Cube (Co. Elementar Analysen Systeme). Theorical calculations were performed with Gaussian 9 software in a B3LYP/6-311G mode.
Synthesis of 2-[(E)-(3-acetyl-4-hydroxyphenyl)diazenyl]-4-(2-hydroxyphenyl)thio-phene-3-carboxylic acid (11)
To the thienyldiazonium ion in solution, 1.35 g (9.93 mmol) of 10 was added dropwise with stirring over 30 min and the mixture was further stirred for an additional 30 min to complete the reaction. At the end of this, 5 mL of a potassium bicarbonate solution (10% KHCO3) was added in small portions to the mixture to neutralize the excess acid. 10 min later, a volume of 50 mL of ice water was added to the mixture and the latter was left to stand for 24 h before being filtered. The product obtained is then washed cold and then hot with water to remove any impurities in order to give 1.97 g of 11 (from 2 g of 7) as dark green powder; Rf: 0.6, mp: 296–298 °C, yield 55.97%; HRESI-MS: 405.0574 (M + Na, 0.54%). UV–Vis: λmax (acetone): 332, 445, 586 nm. IR (ATR): 1450 cm−1 (N=N), 1667 (C=O)acid, 1729 (C=O)ketone, 1166 (C–O), 3541 (2′-OH), 3248 (4″-OH), 2579 (3-COOH) cm−1. 1H NMR (DMSO-d6) δ ppm: 8.69 (dd, 1H, J = 8.1 and 1.2 Hz, H-6′), 7.80 (m, 1H, H-4′), 7.46 (m, 1H, H-5’), 7.21 (d, 1H; J = 7.1 Hz, H-3′), 6.94 (s,1H, H-5), 7.74 (d,1H, J = 1.9 Hz; H-2″), 6.91 (d, 1H, J = 8.1 Hz; H-5″), 7.85 (dd, 1H, J = 8.1 and 1.9 Hz; H-6″). 13C NMR (DMSO-d6) δ ppm: 154.5 (C-2), 154.2 (C-3), 184.8 (3-COOH), 148.4 (C-4), 119.7 (C-5), 115.6 (C-1′), 155.5 (C-2′), 117.7 (C-3′), 136.0 (C-4′), 126.0 (C-5′), 129.5 (C-6′), 134.9 (C-1″), 136.8 (C-2″), 120.3 (C-3″), 205.1 (3″-COCH3), 161.3 (C-4″), 118.1 (C-5″) and 132.0 (C-6″). Anal. Calcd. for C19H14N2O5S (382.0623): C, 59.68; H, 3.69; N, 7.33; S, 8.38; found: C, 59.70; H, 3.68; N, 7.31; S, 8.37.
Synthesis of complexes 12 and 13 ([Co2(C19H12N2O5S)2])
To a magnetically stirred solution of the ligand 11 (300 mg; 0.79 mmol) in DMSO (4 mL) a solution of Co(C2O4)‧2H2O (140 mg; 0.77 mmol) in 3 mL EtOH/MeOH (2:1) was gradually added and the reaction volume made up to 20 mL with ethanol. After 48 h, the product formed was collected by simple filtration then washed with ethanol after 10 days to give 53 mg of 12 as a black precipitate. From the resulted filtrate, 45 mg of 13 was collected after 30 days as a green precipitate. After washing, the complexes were left to stand and the solvent evaporated after 24 h. Compound 12: Rf: 0.66, mp: 288–290 °C, yield 31.18%; HRESI-MS: 878.9684 (M + H, 0.10%). UV–Vis: λmax (acetone): 332, 436, 490, 590 nm. IR (ATR): 3258 cm−1 (OH)chelated, 1713 (C=Oketone), 1713 (C=Oacid), 1446 (N=N), 528/548 (Co–O) cm−1. 1H NMR (MeOH-d4/CHCl3-d1) δ ppm: 8.83 (s, 2H, H-5), 7.41–7.47 (m, 2H, H-3′), 7.73–7.81 (m, 2H, H-4′), 7.41–7.47 (m, 2H, H-5′), 8.87 (m, 2H, H-6′), 7.73–7.81 (m, 2H, H-2″), 7.41–7.47 (m, 2H, H-5’’), 7.73–7.81 (m, 2H, H-6’’). 13C NMR (DMSO-d6) δ ppm: 179.9 (3-COOH), 148.4 (C-4), 129.1 (C-5), 115.2 (C-1′), 156.0 (C-2′), 117.0 (C-3′), 135.3 (C-4′), 125.3 (C-5′), 129.6 (C-6′), 134.4 (C-1’’), 195.0 (3’’-COCH3) and 156.5 (C-4’’). Anal. Calcd. for [Co2(C19H12N2O5S)2] (877.9592): C, 51.95; H, 2.75; N, 6.38; S, 7.30; found: C, 51.98; H, 2.78; N, 6.36; S, 7.27. Compound 13: Rf: 0.63, mp: 214–216 °C, yield 26.47%; HRESI-MS: 917.0518 (M + K, 0.18%). UV–Vis: λmax (acetone): 332, 382, 538 nm. IR (ATR): 2573 cm−1 (OHacid), 1748 (C=Oketone), 1695 (C=Oacid), 1446 (N=N), 530 (Co–O) cm−1. 1H-NMR (MeOH-d4/CHCl3-d1) δ ppm: 7.54 (s, 2H, H-5), 7.34–7.42 (m, 2H, H-3′), 7.71–7.80 (m, 2H, H-4′), 7.34–7.42 (m, 2H, H-5′), 8.83 (m, 2H, H-6′), 7.51 (m, 2H, H-5″), 7.71–7.80 (m, 2H, H-6″). 13C NMR (MeOH-d4/CHCl3-d1) δ ppm: 155.4 (C-2), 154.9 (C-3), 185.6 (3-COOH), 148.1 (C-4), 115.2 (C-1’), 156.7 (C-2’), 117.2 (C-3′), 135.7 (C-4′), 125.7 (C-5′), 129.9 (C-6′), 192.4 (3″-COCH3) and 161.4 (C-4″). Anal. Calcd. for [Co2(C19H12N2O5S)2] (877.9598): C, 51.95; H, 2.75; N, 6.38; S, 7.30; found: C, 51.92; H, (2.77); N, 6.41; S, 7.33.
Antimicrobial evaluation
Tested microorganisms
Against four different bacterial species, the antibacterial activity was conducted. One Gram-positive Staphylococcus aureus ATCC25923 and three Gram-negative Pseudomonas aeruginosa, Escherichia coli ATCC25922, and Klebsiella pneumoniae 22 were the chosen bacteria. These microorganisms were collected from our laboratory collection. The different bacterial species were maintained at + 4 °C and activated on BBL® nutrient agar (NA, Conda, Madrid, Spain) for 24 h before any antibacterial test.
Determination of minimum inhibitory concentration (MIC) and minimum microbicidal concentration (MMC)
The MICs were determined by the method of microdilution in a liquid medium [59]. Stock solutions of samples were prepared in an aqueous solution of Dimethyl Sulphoxide 10% (DMSO, Fisher Chemicals, Strasbourg, France) at a concentration of 512 µg/mL. From these stock solutions, successive dilutions in series of 2 were carried out in Mueller–Hinton broth (MHB). For each test, the sterility test (aqueous solution of DMSO at 10% + culture medium), the negative control (aqueous solution of DMSO at 10% + culture medium + inoculum) and the positive control (aqueous solution of DMSO at 10% + culture medium + inoculum + reference drug) were included. 100 μL of each concentration were introduced into a well of a 96-well (200 μL per well) microtiter plate containing 90 μL of MHB and 10 μL of inoculum were added to obtain a range of concentrations varying from 256 to 0.125 μg/mL. Plates were covered and incubated at 37 °C for 24 h on a shaker (Flow Laboratories) at 300 rpm. At the end of the various incubation times, the minimum inhibitory concentrations (MIC) were considered to be the lowest concentrations of substances for which we did not have any macroscopic growth materialized by the cloudy appearance of the well. Minimum bactericidal concentrations (MBCs) were determined by subculturing 10 μL (using 90 mm Petrie dishes) of the contents of wells where growth was not visible to the naked eye with Mueller–Hinton Agar (MHA) medium. The MBCs were defined as the lowest concentration that produced no growth following subculturing. Each test was run three times.
Cytotoxicity assay
The animals were bred in the animal house of the University of Dschang, Cameroon. The study was conducted according to the ethical guidelines of the Committee for Control and Supervision of Experiments on Animals (Registration number 173/CPCSEA, issued January 28, 2000), Government of India, on the use of animals for scientific research. Euthanasia was done using noninhaled agents. Hence, all the rats were anaesthesized via intraperitoneal injection of the mixture of ketamine (50 mg/ kg body weight, BW) and xylazine (10 mg/kg BW), in a dose that is commonly used for operation purposes. A conical tube containing EDTA as an anticoagulant was used to collect 10 mL of whole blood from albino rats using a heart puncture. Centrifugation at room temperature for 10 min at 1000 × g was used to collect erythrocytes, which were then washed three times in PBS buffer [60]. The cytotoxicity was evaluated as previously reported [60]. Death was confirmed using a combination of criteria including lack of pulse, breathing, corneal reflex, response to firm toe pinch; inability to hear respiratory sounds and; graying of the mucous membranes and rigor mortis before disposal of any animal remains.
Availability of data and materials
All spectra for the compounds’ characterization are provided as Additional material. Similarly, the raw data for all biological evaluations are available from the corresponding author upon reasonable request.
Abbreviations
- UV–Vis:
-
Ultra-Violet-visible
- IR:
-
Infrared
- FTIR:
-
Fourier-transform infrared spectroscopy
- HRESI-MS:
-
High resolution electrospray ionization‐mass spectrometry
- 1H NMR:
-
Proton nuclear magnetic resonance
- 13C NMR:
-
Carbon nuclear magnetic resonance
- DFT:
-
Density functional theory
- LCAO:
-
Linear combinations of atomic orbitals
- µg:
-
Microgram
- FMO:
-
Frontier molecular orbitals
- HOMO:
-
Highest occupied molecular orbital
- LUMO:
-
Lowest unoccupied molecular orbital
- MEP:
-
Molecular electrostatic potential
- °C:
-
Degree centigrade
- h:
-
Hour
- g:
-
Gram
- mg:
-
Milligram
- L:
-
Liter
- mL:
-
Milliliter
- µL:
-
Microliter
- MIC:
-
Minimum inhibitory concentration
- MMC:
-
Minimum microbicidal concentration
- MBC:
-
Minimum bactericidal concentration
- DMSO:
-
Dimethylsulfoxide
- Fig:
-
Figure
References
OMS. Plan d’action mondial pour combattre la résistance aux antimicrobiens. Avenue Appia 20. 2016; Genève:Suisse.
Yuhan Z, Mengnan Z, Benke L, Beibei Z, Bing C, Yuanyuan W, Shan Y, Ruiqi X, Xiaoke Z, Weisheng F. Ephedra Herb extract ameliorates adriamycin-induced nephrotic syndrome in rats via the CAMKK2/AMPK/Mtor signaling pathway. Chin J Nat Med. 2023;21(5):371–82.
Yi W, Weijie Z, Shujie C, Jinghua L, Hongyu Z. Surface-functionalized design of blood-contacting biomaterials for preventing coagulation and promoting hemostasis. Friction. 2023;11(8):1371–94.
Fatima I, Safdar N, Akhtar W, Munir A, Saqib S, Ayaz A, Bahadur S, Alrefaei AF, Ullah F, Zaman W. Evaluation of potential inhibitory effects on acetylcholinesterase, pancreatic lipase, and cancer cell lines using raw leaves extracts of three fabaceae species. Heliyon. 2023;9:15909.
Tchinda MA, Nanfack DAR, Tamokou JDD, Matsuete-Takongmo G, Tsopmo A, Shaiq AM, Tene M. Echinograciolide, a new antibacterial nor-triterpenoid and other constituents from Echinops gracilis O. Hoffm. (Asteraceae). Nat Prod Res. 2022;10:1–12.
Metiave SAA, Tedonkeu AT, Tamokou JDD, Nanfack ARD, Matsuete-Takongmo G, Wetadieu KD, Tsopmo A, Tene M. Antibacterial stigmastane-type steroids and other constituents from the leaves of Vernonia glabra (Steetz) Vatke (Asteraceae). Nat Prod Res. 2023;13:1–15.
Jouogo NDC, Eckhardt P, Tamokou JDD, Takongmo MG, Voutquenne-Nazabadioko L, Opatz T, Tapondjou AL, Ngnokam D, Teponno RB. A new phenolic glycoside from the leaves of Flacourtia flavescens Willd. Nat Prod Res. 2023;5:1–11.
Shen B, Sun S, Zhu L, Yu J, Jiang L. Intelligent bio-FeS-loaded chitosan films with H2O2 rapid response for advanced waterproof and antibacterial food packaging. Food Packag Shelf Life. 2023;37: 101083.
Saqib S, Faryad S, Afridi MI, Arshad B, Younas M, Naeem M, Zaman W, Ullah F, Nisar M, Ali S, Elgorban AM, Syed A, Elansary HO, El-Abedin TKZ. Bimetallic assembled silver nanoparticles impregnated in aspergillus fumigatus extract damage the bacterial membrane surface and release cellular contents. Coatings. 2022;12:1505.
Cui G, Li Y, Shi T, Gao Z, Qiu N, Satoh T, Kakuchi T, Duan Q. Synthesis and characterization of Eu(III) complexes of modified cellulose and poly(N-isopropylacrylamide). Carbohydr Polym. 2013;94:77–81.
Tsemeugne J, Emmanuel SF, Jean-De-Dieu T, Ignas KT, Irene CK, Arnaud DN, Stephen TL, Taoufik R, Jules RK, Beibam LS. Electrochemical behavior and in-vitro antimicrobial screening of some thienylazoaryls dyes. Chem Cent J. 2017;11(119):1–13.
Al-Mousawi SM, El-Apasery MA. Synthesis of some monoazo disperse dyes derived from minothienochromene. Molecules. 2013;18:8837–44.
Fondjo ES, Roosvelt KT, Jean-De-Dieu T, Désiré SA, Sorel DDK, Giscard D, Appolinaire T, Simon PFW, Roger KJ. Synthesis, characterization and antimicrobial activities of novel Hg(II) complex with 3-amino-1-[2-phenyldiazenyl]-4Hthieno [3,4-c]chromen-4-one. J App Chem. 2020;13:8–15.
Roosvelt KT, Emmanuel SF, Jean De-Dieu T, Chinda KI, Giscard D, Sorel DDK, Simon PFW, Apollinaire T, Roger JK. Sonochemical synthesis, characterization and antimicrobial properties of novel lanthanum(III) complex of 3-amino-1-[2-phenyldiazenyl]-4H-thieno[3,4-c]chromen-4-one. J Drug Design Res. 2020;7(1):1076.
Navarro M, Gabbiani C, Messori L, Gambino D. Metal-based drugs for malaria, trypanosomiasis and leishmaniasis: recent achievements and perspectives. Drug Discov Today. 2010;15(23/24):1070–8.
Vieites M, Smircich P, Guggeri L, Marchàn E, Gόmez-Barrio A, Navarro M, Garat B, Gambino D. Synthesis and characterization of a pyridine-2-thiol N-oxide gold(I) complex with potent antiproliferative effect against Trypanosoma cruzi and Leishmania sp. insight into its mechanism of action. J Inorg Biochem. 2009;103(10):1300–6.
Kowalik M, Masternak J, Lakomska I, Kazimierczuk K, Zawilak-Pawlik A, Szczepanowski P, Khavryuchenko OV, Barszcz B. Structural insights into new Bi(III) coordination polymers with pyridine-2,3-dicarboxylic acid: photoluminescence properties and anti-helicobacter pylori activity. Int J Mol Sci. 2020;21(22):8696–721.
Abdalla KM, El-Zaher GMA, Eman H. Synthesis, structural characterization, and antimicrobial activities of Mn(II), Co(II), Ni(II), Cu(II) and Zn(II) complexes of triazole-based azodyes. Chin J Chem. 2011;29:1124–32.
Mansour HB, Boughzala O, Dridi D, Barillier D, Chekir-Ghedira L, Mosrati R. Textiles dyes as a source of wastewater contamination: screening of the toxicity and treatment methods. J Water Sci. 2011;24(3):209–38.
Kaya SI, Cetinkaya A, Ozkan SA. Latest advances on the nanomaterials-based electrochemical analysis of azo toxic dyes sunset yellow and tartrazine in food samples. Food Chem Toxicol. 2021;156: 112524.
Guerra E, Llompart M, Garcia-Jares C. Analysis of dyes in cosmetics: challenges and recent developments. Cosmetics. 2018;5:47.
Eltaboni F, Bader N, El-Kailany R, Elsharif N, Ahmida A. Chemistry and applications of azo dyes: a comprehensive review. J Chem Rev. 2022;4(4):313–30.
Purwanto A, Chen A, Shien K, Huebschmann HJ. Detection, identification, and quantitation of azo dyes in leather and textiles by GC/MS. Thermo Fisher Scientific, Singapore. 2012; 1–6.
Aljamali NM. Review in azo compounds and its biological activity. Anal biochem. 2015;4(2):100–69.
Kyhoiesh HAK, Al-Adilee KJ. Synthesis, spectral characterization, antimicrobial evaluation studies and cytotoxic activity of some transition metal complexes with tridentate (N, N, O) donor azo dye ligand. Results in Chem. 2021;3:100245–71.
Martino MD, Sessa L, Matteo MD, Panunzi B, Piotto S, Concilio S. Azobenzene as antimicrobial molecules. Molecules. 2022;27:5643–72.
Abdallah SM. Metal complexes of azo compounds derived from 4-acetamidophenol and substituted aniline. Arab J Chem. 2012;5(2):251–6.
Liu Z, Fan B, Zhao J, Yang B, Zheng X. Benzothiazole derivatives-based supramolecular assemblies as efficient corrosion inhibitors for copper in artificial seawater: formation, interfacial release and protective mechanisms. Corros Sci. 2023;212: 110957.
Chen D, Wang Q, Li Y, Li Y, Zhou H, Fan Y. A general linear free energy relationship for predicting partition coefficients of neutral organic compounds. Chemosphere. 2020;247: 125869.
Kocaokutgen H, Erdem E, Gümrükçüoglu IE. Synthesis of HMFAN and its chromium and cobalt complexes and their application on nylon 6 and wool. J Stud Dyn Change. 1998;114:93–5.
Deghadil RG, Mahmoud WH, Mohamed GG. Metal complexes of tetradentate azo-dye ligand derived from 4,40-oxydianiline: preparation, structural investigation, biological evaluation and MOE studies. Appl Organomet Chem. 2020;34:5883–5802.
Mohammed HS. Synthesis, characterization, structure determination from powder x-ray diffraction data, and biological activity of azo dye of 3-aminopyridine and its complexes of Ni(II) and Cu(II). Bull Chem Soc Ethiop. 2020;34(3):523–32.
Bozorov K, Zhao J-Y, Nie LF, Ma H-R, Bobakulov K, Hu RN, Rustamova G, Huang T, Efferth HA. Synthesis and in vitro biological evaluation of novel diaminothiophene scaffolds as antitumor and anti-influenza virus agents. Part 2. RSC Adv. 2017;7(50):31417–27.
Ojeil A, El-Darra N, El-Hajj Y, Mouncef PB, Rizk TJ, Maroun RG. Identification and characterization of phenolic compounds extracted from chateau ksara grapes. Leban Sci J. 2010;11(2):117–31.
Fondjo ES, Tsemeugne J, Tamokou JDD, Djintchui AN, Kuiate JR, Sondengam BL. Synthesis and antimicrobial activities of some novel thiophene containing azo compounds. Heterocycl Commun. 2013;19(4):253–9.
Barceloux DG. Cobalt. Clin Toxicol. 1999;37(2):201–16.
Chang EL, Simmers C, Knight DA. Cobalt complexes as antiviral and antibacterial agents. Pharmaceuticals. 2010;3:1711–28.
Djebbar S, Benali-Baitich O, Deloume JP. Synthesis, characterization and electrochemical behaviour of cobalt(II) and cobalt(III): O2− complexes, respectively, with linear and tripodal tetradentate ligands derived from Schiff bases. J Mol Struct. 2001;569(1):121–8.
Nielsen I, Andersen AH, Bjergbæk L. Studying repair of a single protein-bound nick in vivo using the Flp-Nick system. Methods Mol Biol. 2012;920:393–415.
Chamlagain B, Edelmann M, Kariluoto S, Ollilainen V, Piironen V. Ultra- high performance liquid chromatographic and mass spectrometric analysis of active vitamin B12 in cells of propionibacterium and fermented cereal matrices. Food Chem. 2015;166:630–8.
Ali HA, Shamma AA, Kamel S. New mixed ligand cobalt(II/III) complexes based on the drug sodium valproate and bioactive nitrogen-donor ligands. Synthesis, structure and biological properties. J Mol Struct. 2017;1142:40–7.
Kuckova L, Jomova K, Svorcova A, Valko M, Segla P, Moncol J, Kozisek J. Synthesis, crystal structure, spectroscopic properties and potential biological activities of salicylate neocuproine ternary copper(II) complexes. Mol. 2015;20(2):2115–37.
Jaman Z, Karim MR, Siddiquee TA, Mirza AH, Ali MA. Synthesis of 5-substituted 2,9-dimethyl-1,10-phenanthroline dialdehydes and their schiff bases with sulfur-containing amines. Int J Org Chem. 2013;3(3):214–9.
Schwarzenbach G. Alfred werner and his accomplishments. Helv Chim Acta. 1967;50:38–63.
Fondjo ES, Doepp D, Henkel G. Reactions of some anellated 2-aminothiophenes with electron poor acetylenes. Tetrahedron. 2006;62:7121–31.
Al-Mousawi SM, El-Apasery MA. Synthesis of some monoazo disperse dyes derived from aminothienochromene. Mol. 2013;18(8):8837–44.
Djeukoua KSD, Emmanuel SF, Tamokou JDD, Tsemeugne J, Simon PFW, Topmo A, Tchieno FMM, Ekom SE, Pecheu CN, Tonle IK, Kuiate JR. Synthesis, characterization, antimicrobial activities and electrochemical behavior of new phenolic azo dyes from two thienocoumarin amines. ARKIVOC. 2019;6:416–30.
Zhao J, Zhang Y, Gan L, Wang G. Experimental and DFT study of UV–Vis absorption spectra of azobenzene containing ester groups. Comput Theor Chem. 2021;1200: 113244.
Ahmad HI, Bayader FA, Alaa ES, Salah MA, Nadir FH. Synthesis, characterization and photo-kinetic study of diphenol schiff base and its metal complexes with (Co+2, Ni+2, Cu+2) ions. Ind J Med Forensic Med Toxicol. 2019;13(4):1246–53.
Salavati-Niasari M. Template synthesis and characterization of host (nanopores of zeolite Y)/guest (Co(II)-tetraoxodithiatetraaza macrocyclic complexes) nanocomposite materials. Polyhedron. 2008;27(15):3207–14.
Ghisolfi A, Fliedel C, Rosa V, Pattacini R, Thibon A, Monakhov KY, Braunstein P. Solvent-dependent reversible ligand exchange in nickel complexes of a monosulfide bis(diphenylphosphino)(n-thioether)-amine. Med Toxicol. 2013;8(8):1795–805.
Ebnou F, Ebeid K, M’Haiham M, Dhia MTB, Sanhoury MA. Synthèse et caractérisation des complexes de cobalt(II) et de nickel(II) avec des ligands du type (R2N)3P(E) (R2N = pipéridinyl ou morpholinyl; E = S ou Se). J Maur Chem Soc. 2020;2:1–7.
Loginova NV, Koval’chuk TV, Osipovich NP, Polozov GI, Sorokin VL, Chernyavskaya AA, Shadyro OI. Redox-active antifungal cobalt(II) and copper(II) complexes with sterically hindered o-aminophenol derivatives. Polyhedron. 2008;27(3):991–985.
Nejo AA, Kolawole GA, Nejo AO. Synthesis, characterization, antibacterial, and thermal studies of unsymmetrical schiff-base complexes of cobalt(II). J Coord Chem. 2010;63(24):4398–410.
Alaghaz A, Ammar YA, Bayoumi HA, Aldhlmani SA. Synthesis, spectral characterization, thermal analysis, molecular modeling and antimicrobial activity of new potentially N2O2 azo-dye schiff base complexes. J Mol Struct. 2014;1074:359–75.
Mahmoud WH, Omar MM, Sayed FN. Synthesis, spectral characterization, thermal, anticancer and antimicrobial studies of bidentate azo dye metal complexes. J Therm Anal Calorim. 2016;124:1071–89.
Mabkhot YN, Aldawsari FD, Al-Showiman SS, Barakat A, Soliman SMS, Choudhary MI, Yousuf S, Mubarak MS, Hadda TB. Novel enaminone derived from thieno [2,3-b] thiene: Synthesis, x-ray crystal structure, HOMO, LUMO, NBO analyses and biological activity. Chem Cent J. 2015;9(1):24–34.
Mali SN, Anand A, Zaki MEA, Al-Hussain SA, Jawarkar RD, Pandey A, Kuznetsov A. Theoretical and anti-Klebsiella pneumoniae evaluations of substituted 2,7-dimethylimidazo[1,2-a]pyridine-3-carboxamide and imidazopyridine hydrazide derivatives. Molecules. 2023;28:2801–16.
Tamokou JD, Tala FM, Wabo KH, Kuiate JR, Tane P. Antimicrobial activities of methanol extract and compounds from stem bark of Vismiarubescens. J Ethnopharmacol. 2009;124:571–5.
Situ H, Bobek LA. In vitro assessment of antifungal therapeutic potential of salivary histatin-5, two variants of histatin-5, and salivary mucin (MUC7) domain 1. Antimicrob Agents Chemother. 2000;44:1485–93.
Acknowledgements
Emmanuel Sopbué Fondjo warmly acknowledges DAAD funding (grant N° 91691265). The University of Dschang's research grant committee and the Cameroonian Ministry of Higher Education provided further financial support for the project. They also thank the German Academic Exchange Service (DAAD) for funding the Yaoundé-Bielefeld Graduate School of Natural Products with Antiparasite and Antibacterial Activities (YaBiNaPA, project number 57316173).
Funding
DAAD (Grant N° 91691265) for SFE and DAAD (YaBiNaPA, project No. 57316173) for BNL.
Author information
Authors and Affiliations
Contributions
ESF created the study idea, supplied the reagents, and oversaw the chemistry experimental work, as well as the compilation of the chemical sections of the publication; SFS performed the chemical portion of the experimental work in the lab, as well as contributed to data analysis and article writing; JDDT carried out the antibacterial and antifungal experiments and helped to compile the biological sections of the report; GD performed the powder diffraction XRD measurements, assisted in the interpretation of the XRD data, and reviewed the entire manuscript draft; DLFT assisted in the NMR measurements, assisted in the interpretation of the spectra, and reviewed the entire manuscript draft; PFWS performed the GC–MS measurements, assisted in the interpretation of the spectra, and reviewed the entire paper draft; BNL performed the LC–MS measurements, assisted in the interpretation of the spectra, and reviewed the entire manuscript draft; AT performed the NMR measurements, assisted in the interpretation of the spectra, and reviewed the entire manuscript draft; JRK directed the biological screening studies and reviewed the entire manuscript draft.
The final version of the manuscript has been approved by all authors. Final manuscript was read and approved by all writers.
Corresponding author
Ethics declarations
Ethics approval and consent to participate
All the procedures and protocols involving the treatment of animals were carried out in accordance with institutional policies, with the Cameroon National Ethical Committee's approval (Reg. No. FWA-IRB00001954), and in accordance with the ARRIVE standards.
Consent for publication
Not applicable.
Competing interests
The authors declare that they have no competing interests.
Additional information
Publisher's Note
Springer Nature remains neutral with regard to jurisdictional claims in published maps and institutional affiliations.
Supplementary Information
Additional file 1: Figure S1.
Powder X-ray diffractogram of compound 11. Figure S2. UV-VIS spectrum of compound 11. Figure S3. IR spectrum of compound 11 with some assignments. Figure S4. HRESI+ mass spectrum of compound 11. Figure S5. 1H-NMR spectrum of compound 11. Figure S6. 13C-NMR spectrum of compound 11. Figure S7. HSQC spectrum of compound 11. Figure S8. COSY 1H-1H spectrum of compound 11 with some correlations. Figure S9. HMBC spectrum of compound 11. Figure S10. UV-VIS spectrum of complex 12. Figure S11. IR spectrum of complex 12. Figure S12. HRESI+ mass spectrum of complex 12. Figure S13. 1H-NMR spectrum of complex 12. Figure S14. 13C-NMR spectrum of complex 12. Figure S15. HSQC spectrum of complex 12 with some correlations. Figure S16. COSY 1H-1H spectrum of complex 12. Figure S17. HMBC spectrum of complex 12 with some correlations. Figure S18. Comparison of the UV-VIS spectra of compound 11 (black) and 12 (blue). Figure S19. Comparison of the IR spectra of compounds 11 (black) and 12 (blue). Figure S20. Comparison of the 1H-NMR spectra of compounds 11 (a) and 12 (b). Figure S21. Comparison of the 13C-NMR spectra of compounds 11 (a) and 12 (b). Figure S22. Powder X-ray diffractogram of compound 13. Figure S23. UV-VIS spectrum of compound 13. Figure S24. IR spectrum of compound 13. Figure S25. HRESI+ mass spectrum of compound 13. Figure S26. 1H-NMR spectrum of compound 13. Figure S27. 13C-NMR spectrum of compound 13. Figure S28. HSQC spectrum of compound 13 with some correlations. Figure S29. COSY 1H-1H spectrum of compound 13. Figure S30. HMBC spectrum of compound 13 with some correlations. Figure S31. Comparison of the powder X-ray diffractograms of compounds 11 (black) and 13 (green). Figure S32. Comparison of the UV-VIS spectra of compound 11 (black) and 13 (green). Figure S33. Comparison of the IR spectra of compounds 11 (black) and 13 (green). Figure S34. Comparison of the 1H-NMR spectra of compound 11 (a) and 13 (b). Figure S35. Comparison of the 13C-NMR spectra of compound 11 (a) and 13 (b).
Rights and permissions
Open Access This article is licensed under a Creative Commons Attribution 4.0 International License, which permits use, sharing, adaptation, distribution and reproduction in any medium or format, as long as you give appropriate credit to the original author(s) and the source, provide a link to the Creative Commons licence, and indicate if changes were made. The images or other third party material in this article are included in the article's Creative Commons licence, unless indicated otherwise in a credit line to the material. If material is not included in the article's Creative Commons licence and your intended use is not permitted by statutory regulation or exceeds the permitted use, you will need to obtain permission directly from the copyright holder. To view a copy of this licence, visit http://creativecommons.org/licenses/by/4.0/. The Creative Commons Public Domain Dedication waiver (http://creativecommons.org/publicdomain/zero/1.0/) applies to the data made available in this article, unless otherwise stated in a credit line to the data.
About this article

Cite this article
Sopbué Fondjo, E., Songmi Feuze, S., Tamokou, JdD. et al. Synthesis, characterization, and antibacterial activity studies of two Co(II) complexes with 2-[(E)-(3-acetyl-4-hydroxyphenyl)diazenyl]-4-(2-hydroxyphenyl)thiophene-3-carboxylic acid as a ligand. BMC Chemistry 18, 75 (2024). https://doi.org/10.1186/s13065-024-01179-2
Received:
Accepted:
Published:
DOI: https://doi.org/10.1186/s13065-024-01179-2