
Abstract
Background
Policymakers and researchers recommend supporting the capabilities of feedback recipients to increase the quality of care. There are different ways to support capabilities. We aimed to describe the content and delivery of feedback facilitation interventions delivered alongside audit and feedback within randomised controlled trials.
Methods
We included papers describing feedback facilitation identified by the latest Cochrane review of audit and feedback. The piloted extraction proforma was based upon a framework to describe intervention content, with additional prompts relating to the identification of influences, selection of improvement actions and consideration of priorities and implications. We describe the content and delivery graphically, statistically and narratively.
Results
We reviewed 146 papers describing 104 feedback facilitation interventions. Across included studies, feedback facilitation contained 26 different implementation strategies. There was a median of three implementation strategies per intervention and evidence that the number of strategies per intervention is increasing. Theory was used in 35 trials, although the precise role of theory was poorly described. Ten studies provided a logic model and six of these described their mechanisms of action. Both the exploration of influences and the selection of improvement actions were described in 46 of the feedback facilitation interventions; we describe who undertook this tailoring work. Exploring dose, there was large variation in duration (15–1800 min), frequency (1 to 42 times) and number of recipients per site (1 to 135). There were important gaps in reporting, but some evidence that reporting is improving over time.
Conclusions
Heterogeneity in the design of feedback facilitation needs to be considered when assessing the intervention’s effectiveness. We describe explicit feedback facilitation choices for future intervention developers based upon choices made to date. We found the Expert Recommendations for Implementing Change to be valuable when describing intervention components, with the potential for some minor clarifications in terms and for greater specificity by intervention providers. Reporting demonstrated extensive gaps which hinder both replication and learning. Feedback facilitation providers are recommended to close reporting gaps that hinder replication. Future work should seek to address the ‘opportunity’ for improvement activity, defined as factors that lie outside the individual that make care or improvement behaviour possible.
Review registration
The study protocol was published at: https://www.protocols.io/private/4DA5DE33B68E11ED9EF70A58A9FEAC02.
Background
Audit and feedback is a complex intervention that involves the delivery of feedback on performance over a specific period [1]. Health professionals may not have the knowledge and skills to engage and respond to feedback, and this may create variation in the effectiveness of audit and feedback [2, 3]. Health systems are investing in quality improvement support to feedback recipients [4, 5]
Brown and colleagues [2] describe quality improvement co-interventions as supporting feedback recipients, “to identify the reasons for and develop solutions to sub-optimal performance” (p16). Quality improvement support is a form of feedback facilitation that might help recipients to identify, “barriers and enablers for making change” [6; p3]. The identification of influences and selection of actions to address these is known as ‘tailoring’ [7]. In addition to tailoring, authors have described the need to develop commitment, as the shared resolve to implement a change [8]; for example, through describing implications of current audit performance [9].
There is a lack a clarity about the content and delivery of feedback facilitation. Facilitation is associated with enabling and making a target behaviour easier. In the context of audit and feedback, facilitation might include how to use feedback, undertake quality improvement or set goals and plans [10]. Beyond feedback-specific facilitation, Richie and colleagues describe 22 implementation facilitation skills, including engaging stakeholders, problem-identification/solving and education skills. The template for intervention description and replication (TIDieR) [11] provides a guide to describe the content of interventions. TIDieR highlights the importance of describing what is delivered and why, who delivers the intervention, how, where, when and how much, whether there is tailoring, modifications and if fidelity is assessed and delivered. In relation to what is delivered, the Expert Recommendations for Implementing Change (ERIC) [12] describes 73 different types of implementation intervention. In relation to why a particular intervention is delivered, Colquhoun and colleagues [13] described gaps in the use of theory within audit and feedback interventions. Feedback facilitation could be considered an implementation strategy. Within the current manuscript we will refer to feedback facilitation as an intervention (Table 1), to be consistent with the description of multi-faceted interventions [1, 2], co-interventions [2] and complex interventions [14], and to reflect that feedback facilitation may be composed of multiple implementation strategies.
Multiple authors (e.g. [18,19,20]) recommend using logic models to describe the programme theory for an intervention. Describing the intervention components enables replication across contexts with fidelity of identified core components [14]. Lewis and colleagues [17] describe potential components in the causal pathway of interventions: intervention mechanism(s); context; pre-conditions and/or moderators; proximal and distal outcomes. Such frameworks provide a further lens through which to describe the content and delivery of feedback facilitation interventions.
The effectiveness of audit and feedback with or without a feedback facilitation co-intervention is being explored during the updated Cochrane review of randomised controlled trials. Understanding the content and delivery, as well as the effectiveness, of an intervention is extremely valuable and supports the interpretation and use of the findings. The aim of the current study is to describe the content and delivery of feedback facilitation co-interventions used in trials of audit and feedback.
Method
We explored the content of feedback facilitation co-interventions reported in randomised controlled trials of audit and feedback (A&F). Feedback facilitation trials were identified from the latest update of the Cochrane review of audit and feedback. Within the Cochrane review, co-interventions were described as a form of feedback facilitation, which “could be training about how to use feedback, or to do quality improvement in the practice, or set goals and plans, etc.” [10].
The search criteria and identification of studies is reported by the Cochrane review [21] team, who provided the papers identified as containing feedback facilitation. We reviewed these papers and their citations for further details describing the intervention content.
Inclusion criteria: Papers describing interventions delivered in randomised controlled trials of audit and feedback with additional feedback facilitation co-intervention delivered to health care workers. There were no exclusion criteria.
Participants
Audit and feedback and/or feedback facilitation developers and/or deliverers.
Intervention
Feedback facilitation co-interventions delivered alongside audit and feedback.
Quality assessment
Quality was assessed as part of the Cochrane review.
Data collection and management
We extracted data from papers describing the trial, from publicly available protocols and from companion papers. Eight reviewers extracted data from the included studies using a specifically designed and piloted proforma adapted from the TIDieR framework [11]. The adapted proforma extended TIDieR to capture the form of implementation strategy [12], theory and logic model, the identification of influences upon performance and work to align improvement actions to influences, whether information to describe the implications of performance was reported and the level of change sought.
The adapted proforma also enabled us to explore whether and how the feedback facilitation co-interventions supported teams to tailor their response to feedback. In identifying whether the facilitation explored influences upon performance, we looked for whether influences or causes were given, sought by data recipients or not recorded. The extraction guide (Appendix A) provided the example of using a framework to identify determinants or other potential list of influences from which recipients selected. The data extractors described the procedure to explore influences using language similar to that in the text and categorised this as ‘sought by data recipients’, ‘given by study team’, ‘co-produced’ or ‘not recorded’. The extractors then described the presence or absence of a process by which implementation strategies were determined; for example, whether they were given by the study team or selected by data recipients.
Data was recorded and managed in Excel
Duration of feedback facilitation was calculated in minutes; where specified in days, duration was converted to 450 min per day. Maximum duration was used unless an average time was given. The deliverer of facilitation was classified into expert, peers or improvement specialists [22].
We developed and piloted reviewer guidance notes to accompany the proforma (Appendix A). Each paper was reviewed by 2 reviewers. The reviewers were health service researchers, five of whom were also clinicians. Six reviewers were involved in the development of the codebook through iterative discussion, design and testing. Two further reviewers received training and supervision in use of the code book. The reviewers extracted separately, and disagreements were resolved through consensus between the two reviewers.
Data analysis and synthesis
Two members of the team (MS and SA, both experienced implementation scientists) cleaned the data set and used the extracted data to codify the ERIC strategies, referring to source papers where necessary. MS and SA analysed the data narratively, graphically and statistically using Excel and StataMP 17. Our analysis drew upon the full data set, with the exception of the narrative analysis of the use of theory, which focussed on the period since a review of the use of theory in audit and feedback [13]. Statistical analysis involved a linear regression to determine if the number of TIDieR framework items not reported changed with publication year. We examined plots of residuals from the regression analyses and performed a Breusch-Pagan test for heteroskedasticity. The synthesis was presented to the research team for challenge. We summarised the content of feedback facilitation interventions and drew upon guidance and wider literature to consider implications for research and practice. To support feedback facilitation providers, we made the different forms of content and delivery that we identified explicit as a series of design choices.
The protocol for this review has been published separately [23]. We report upon variations from the protocol in the discussion.
Results
The Cochrane review identified 104 randomised controlled trials that delivered feedback facilitation alongside audit and feedback. We included 146 papers describing these trials, as detailed in the below flowchart (Fig. 1).
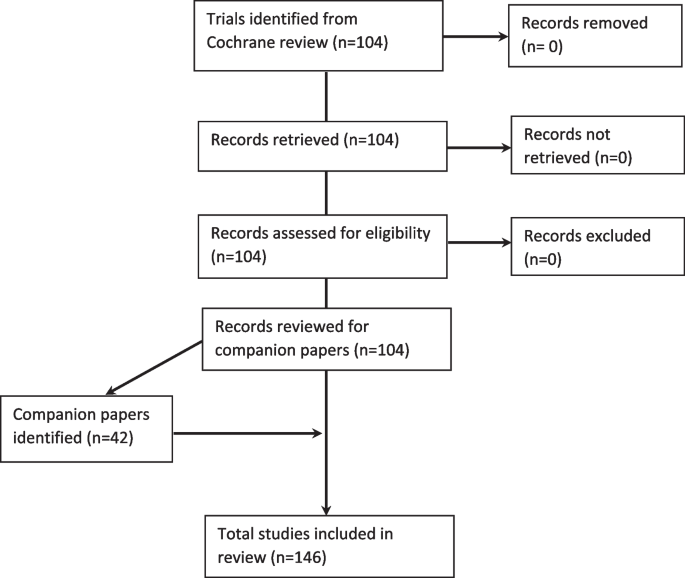
The PRISMA flowchart
Table 2 summarises the content and delivery of feedback facilitation in 104 trials. Additional data is provided in the Supplementary Materials. Table 3 presents a cumulative summary of the content across included studies.
Date and setting
Included trials dated from 1982 to 2020 (Fig. 2). The included studies took place in primary care (n = 54; 52%), secondary care (n = 43; 41%), two in both primary and secondary care, 3 in nursing homes, 1 in an antenatal clinic (unclear whether primary or secondary care) and 1 in dental practice.

A graph describing the date and frequency of included studies of feedback facilitation and the mean number of strategies used per feedback facilitation intervention
Expert Recommendations for Implementing Change (ERIC) strategies
We identified 26 different implementation strategies within feedback facilitation (Fig. 3). The median number of strategies per trial was 3 (IQR 2–4 strategies). Figure 2 shows that the number of strategies used within feedback facilitation interventions has increased over time. There were no apparent differences in the number of strategies used depending on whether the feedback facilitation intervention was undertaken in primary or secondary care (Supplementary materials 6 & 7).

A graph of the frequency of implementation strategy use within included studies [*Added to ERIC coding]
Use of theory and logic models
We found 35 studies (34%) that described using theory. A total of 31 theories were referenced within the included papers. The most frequent were adult learning theory (n = 5; 5%) [e.g. 171], Rogers’ diffusion of innovation theory (n = 4; 4%) [172], Bandura’s self-efficacy theory (n = 4; 4%) [173], and Bandura’s social learning theory (n = 4; 4%) [174]. We found that theory was most frequently used in intervention design. Data from papers published since Colquhoun and colleagues’ exploration of the use of theory in studies of audit and feedback [13] are presented in the Supplementary Materials 2. As illustrated by the quotes, we found that it was often difficult to understand how the authors’ applied theory; for example, “(we) combined strategies shown to change providers’ behaviour with those based on the diffusion of innovation theory” [24] and “technology-assisted learning resources were also developed using motivational systems and instructional design theory” [45].
We found 10 studies provided a logic model to describe the intervention. Table 4 summarises the content of these logic models.
Materials used in feedback facilitation
Feedback facilitation interventions used a range of materials (Supplementary Materials 1). We grouped these into the following categories:
-
Materials to support clinician behaviour change by addressing capability, for example, evidence-based guidelines (e.g. [28, 34, 99]), reminder stickers and cards ([e.g. 100, 116, 143]), written educational materials (e.g. [111, 118, 149]). We identified a subset of these materials that was administrative equipment such as patient care record [84], x-ray ordering stamps [93] and ordering sets [99].
-
Materials to address clinician motivation; for example, information about reimbursement [132]. It is possible that some of the other materials described above as addressing capability may have addressed motivation (e.g. relating to patient outcome), although this was not clear from the description.
-
Materials to support patient behaviour change by addressing capability; for example, patient information leaflets (e.g. [155]) and self-help materials [e.g. 121].
-
Clinical equipment to support clinician behaviour change by addressing ‘opportunity’; for example, testing kits (e.g. [24]) and clinical assessment tools (e.g. [114]).
-
Materials to support the improvement work: Help to analyse influences (e.g. critical event analysis form [58]; a description of ways to use the audit results, including discussions with colleagues, detailed follow up surveys among patients, and establishment of a patient panel [159]); Help both to select strategies (e.g. written recommendations [27]) and to enact strategies (e.g. action plan [58], amendable template to give information to stakeholders [164]).
Identification of priorities
We explored whether and by whom priorities were identified from within the performance feedback during feedback facilitation. In 43 studies (43%), priorities for improvement were identified by the feedback facilitators; for example, Hendryx and colleagues’ educational outreach included that “the (study) team member reviewed the findings, and offered concrete, practical suggestions for improvement” ([82] p420). In 19 studies (18%), priorities were identified by feedback recipients; for example, Ivers and colleagues provided a worksheet “to facilitate goal-setting” ([91] p3). In 4 studies (4%), there was evidence that priorities were co-designed between the study team and the feedback recipients [60, 61, 84, 85]. For example, Frijling and colleagues provided feedback facilitation where “the facilitator and the GPs discussed the content of the feedback reports, prioritized specific aspects of decision making to be improved and made change plans” ([60] p837). In 39 studies (38%), it was not possible to determine whether or by whom priorities were identified within the performance feedback.
Exploration of influences upon performance
We explored whether and how influences upon performance were investigated within feedback facilitation: In 12 studies (12%), influences upon performance were given by the feedback facilitators; for example, “data presented included hospital-specific baseline performance data and information on knowledge and organizational barriers to stroke care identified by the surveys... (including) organisational barriers such as lack of order sets and pathways” ([99] p1635). In 32 studies (31%), influences upon performance were explored by feedback recipients; for example, “a 90-min standardized small group quality improvement meeting, supervised by the medical coordinator of the diagnostic center… (including) a thorough discussion of the difficulties of achieving changes at the individual primary care physician level, the practice level, or at the patient level” ([157] p2408). In 9 studies (9%), we identified that a description of influences upon performance was co-produced by the study team and the feedback recipients. However, there were blurred boundaries between co-produced identification of influences and where influences were sought by feedback recipients; for example, where a focus group might have a facilitator, it was unclear the extent to which they provided a structure or were more directional. In Kennedy et al.’s study, co-ordinators facilitated interdisciplinary care teams to identify “barriers and facilitators to implementing evidence-based strategies, particularly changes that could be made at an organizational level” (p4). In 51 studies, it was not possible to determine whether/how influences upon performance were explored.
Where influences upon performance were given, these may be based upon previous research, including as part of intervention development. Influences upon performance were sought by recipients both in discussion and using proformas. Some focussed on specific barriers (e.g. confidence [78]) whilst others used a broader lens; for example, Chaillet et al. [43] described that, "the training program also sensitized participants to social, economic, organizational, cultural and legal factors”. Proformas were used to support recipients to explore influences (e.g. [58]). The depth of exploration varied (e.g. a 3-h training session [155] or 20-min exercise [111]) and may be a collective (e.g. focus group [27]) or individual exercise (e.g. [116]). Co-production included national analysis followed by local tailoring, information gathering from patients followed by healthcare worker selection and the sharing of learning between sites.
There were no apparent differences in whether the influences were sought by recipients, given or co-produced depending on whether the feedback facilitation intervention was undertaken in primary or secondary care (Supplementary materials 7).
Determining implementation strategies
We explored how strategies were selected: In 33 studies (32%), improvement strategies were given by the feedback facilitators, in 27 studies (26%) they were determined by the feedback recipients. Improvement strategies were co-designed in 20 studies (19%). In 24 studies (23%), it was not reported who determined the improvement strategies.
The suggested strategies given by the study team were sometimes generic suggestions to all teams (e.g. [52]), and sometimes site specific (e.g. [34]). Where the strategies were determined by recipients, this included doing so with the support of learning from other sites [126] and using a plan-do-study-act template [93]. Co-produced strategy selection included selection from a list of strategies provided by the study team and adaptation of proposed strategies (e.g. [68]). Proposed strategies could be in a list presented by peers (e.g. [47]), and/or described in meeting, webinars or calls (e.g. [146]).
The Sankey chart (Supplementary Materials 3) illustrates the lack of relationship between who identified influences and who identified strategies: In 10 (10%) trials, both the identification of influences and identification of strategies was undertaken by recipients; in 4 (4%) trials, both were given by the study team.
There were no apparent differences in whether the actions were determined by recipients, given or co-produced depending on whether the feedback facilitation intervention was undertaken in primary or secondary care (Supplementary materials 7).
Identification of implications of performance
We explored whether feedback facilitation involved identifying implications of performance. We found that implications were given as part of feedback facilitation in 36 studies and identified by feedback recipients in 7 studies (7%). In 61 studies (59%), consideration of implications was not reported. There were no apparent differences in whether the feedback facilitation intervention was undertaken in primary or secondary care (Supplementary materials 7).
Other intervention components
We looked for additional components to the intervention, not described above. We found additional components that sought to address capability and motivation: Components to address capability targeted both capability to improve (e.g. [68]) and capability to deliver care (e.g. [89]). Interventions to increase motivation included motivational text messages (e.g. [47]), celebrating good practice (e.g. [82]), and positional leader prioritisation [e.g. [82]. These may have had some impact upon the social opportunity by changing the social environment (e.g. giving permission). We did not identify additional components that specifically targeted ‘opportunity’ for the target behaviours, defined as factors that lie outside the individual that make the care or improvement behaviour possible.
Delivery of feedback facilitation
A variety of modes were used to deliver facilitation, with the most common being face-to-face (n = 86; 83%) and educational materials (n = 52; 50%). Virtual delivery by telephone (n = 16;15%) and online (n = 12; 12%) was less commonly used, which is likely to be due in-part to the age of the literature. Most studies used one (n = 45; 43%) or two (n = 50; 48%) methods of delivery, with fewer using three (n = 7; 7%; [38, 45, 47, 52, 82, 84, 136]).
Frequency of feedback facilitation
Most studies delivered feedback facilitation between 1 and 3 times (median = 3, interquartile range 1–5). Six studies (6%) delivered facilitation 15 times or more [24, 60, 61, 100, 114, 115]). The maximum times feedback facilitation was delivered was 42 times [115]. Data was not available for 25 studies (24%).
Duration of feedback facilitation
Feedback facilitation delivery took between 15–1800 min, with a median of 120 min and IQR of 75–420 min. For studies with over 420 min of facilitation, this was delivered over several consecutive days and/or as follow up calls following initial delivery. 45 studies (43%) did not record the delivery time.
Timing of feedback facilitation
Most facilitation was delivered with (n = 37; 36%) or after (n = 32; 31%) feedback delivery, so that the feedback could be reviewed with the participants. There were some studies that delivered before (n = 14; 13%), although ten of these studies (10%) also included facilitation during and/or after feedback. The five studies (5%) that only delivered facilitation pre-feedback all included educational materials. Three of these studies (3%) reported local identification of priorities [39, 42, 58], whilst it was not reported in the other two [43, 76].
Who delivered feedback facilitation
Most facilitation was delivered by experts (e.g.specialist physicians with expertise in osteoporosis or geriatrics [93]) (n = 50; 48%), followed by peers (e.g. local co-ordinators [24] (n = 31; 30%) and then quality improvement specialists (n = 21; 20%)) (Supplementary Materials 4). Facilitation was delivered virtually through a computer programme in two studies (2%) [39, 151] (Supplementary Materials 1). We discuss challenges with coding this data below.
Who received feedback facilitation
The majority of facilitation was delivered to clinicians (n = 86; 83%), with a smaller number including both clinicians and non-clinical/managerial (n = 10; 10%). There were no instances of facilitation being delivered to managers only. In eight studies (8%), it was unclear who were the recipients.
Number of recipients receiving feedback facilitation per site
It was difficult to determine the number of recipients of facilitation per site, with 68 studies (65%) either not reporting or providing unclear descriptions. The number of recipients per site ranged from 1 to 135. Studies variably described both minimum and maximum recipients per site, with others giving averages but no range. Of the 36 studies (35%) reporting recipients per site, most sites had small groups of 10 or fewer recipients (n = 28; 28%).
Number of intervention sites receiving feedback facilitation
The number of intervention sites ranged from 1 to 811, with a median of 19 and IQR of 12–38. Data was skewed to the right by 18 studies with large intervention site numbers over 50. Two studies (2%) did not report the number of intervention sites [123, 127].
Comparison of recipients per site with number of intervention arm sites
Where both number of recipients per site and number of intervention sites were recorded (n = 33; 32%), the trend was for the number of recipients per site to decrease as the number of intervention sites increased, however this was not statistically significant on linear regression (p = 0.86, Confidence intervals –0.55 to 0.21) (Supplementary Materials 5).
Number of people receiving the intervention at one time
Most studies (N = 71; 70%) did not record the number of people receiving the intervention at each time; Of the 33 studies (32%) that did, the intervention was delivered most frequently to an individual (n = 9; 9%) and most were delivered to 10 or fewer individuals (n = 28; 27%). Two studies (2%) [98, 102] delivered to 11–20 people and three (3%) to 21 or more [70, 147, 162]. The maximum number of people the intervention was delivered to at one time was 45 [70].
Comparison of number of people receiving the intervention at one time by setting
Interventions delivered in secondary care were often delivered to a larger number of people than those delivered in primary care (secondary care median = 8, IQR = 2.5–16; primary care median = 3.5, IQR = 1–7.5), however this was not a statistically significant finding on a Mann–Whitney U test (p = 0.16) (Supplementary materials 6). This is likely due to primary care studies involving feedback to individual practitioners and smaller team sizes compared to secondary care. The lack of studies describing how many people received the intervention at one time makes drawing conclusions difficult.
Level of change sought
Most facilitation sought a level of change at the team level (n = 74, 71%), with fewer studies seeking level of change at multi-team organisation levels (n = 23, 22%), at the wider system (n = 5, 5%), 2 studies directly targeted patient-level change [45, 150]. For example, Clarke and colleagues provided evidence-based education for women through two antenatal classes as part of an intervention to increase the rates of vaginal birth after caesarean section.
Tailoring of feedback facilitation
Only 19 studies (19%) reported tailoring of the intervention delivery. Types of tailoring included tailoring of the content to identified needs and barriers and local context (e.g. [34, 73, 122, 161, 166]) and additional episodes of facilitation in response to need (40,131). For example, Quinley and colleagues focussed facilitation on physicians with poorer performance where a practice contained multiple physicians [132]. Brown and colleagues [42] tailored content to existing level of knowledge and delivery through, “the use of a variety of media including individualised tuition and feedback” (p443).
Assessment of fidelity
Fidelity of facilitation was reported and described as assessed in 41 studies (39%). Where assessed, 27 out of the 41 studies reported fidelity achievement, given either as a range or mean adherence. Fidelity ranged from 29 to 100%.
Modification
Most studies (n = 60, 58%) did not report whether any modifications to the intervention took place. Of those that did, 18% (n = 8) reported making modifications whereas 82% (n = 36) did not. Examples of modifications included additional re-training sessions [24], modifications due to online system malfunctions [38], changes to number of facilitation sessions offered [74] and delivery mode, for example, where the source was unable to continue to deliver feedback facilitation in-person, so later delivery changed to teleconference [93]. Reporting of the presence or not of modifications to facilitation interventions is improving over time, with 53% of studies reporting modifications published in 2010 or later and 88% since 2000.
Reporting of TIDieR intervention content items
The number of TIDieR items not reported within each study was determined to give a score out of 18. The results are presented in Supplementary Table 1b. The non-reporting of items ranged from 2 to 14, with a median of six content items not recorded (IQR 4.75–8). The number of items not reported reduced over time (p < 0.05) on linear regression, however this only explained 5% of the variation. Heteroskedasticity was not present on testing (p = 0.72).
Discussion
We describe the content and delivery of the feedback facilitation to support designers of future feedback facilitation interventions. Our systematic review of 146 papers describes feedback facilitation delivered alongside audit and feedback in 104 randomised controlled trials. The papers were identified during the Cochrane review of audit and feedback. [21] The Cochrane review includes an assessment of the effectiveness of feedback facilitation.
We found feedback facilitation is a heterogeneous intervention containing at least one of 26 different implementation strategies and drawing upon each of the 9 implementation strategy groupings [175]. We found evidence that the number of strategies used per intervention is increasing over time (Fig. 2). To support future delivery of feedback facilitation we have used this heterogeneity to illuminate previous intervention design choices (Table 5). This is not intended to represent an exhaustive list of choices. In making these choices, guidance [e.g. 14] recommends intervention developers draw upon evidence, theory and stakeholder views about patient outcomes, proximal outcomes, mechanisms, context, pre-conditions and/or moderators and the intervention content. Articulating these may both support consideration of the coherence of the intervention and evaluation of whether it was provided as planned. Detailed description of planned and actual content also supports learning and replication of delivery. We propose both future work with stakeholders to evolve the design options, and further studies evaluating the impact of these choices upon effectiveness and implementation outcomes such as feasibility, appropriateness and acceptability [176].
These design choices have important implications, including those related to tailoring and dose
In relation to tailoring, the source of both the influences and the selection of improvement actions may impact upon the effectiveness of the intervention; for example, strategies selected by the study team may have a more explicit link to theory and evidence, and may include external stakeholders able to challenge existing mental models. Conversely, the study team’s interpretation of the influences upon performance and the alignment between influences and strategies may differ from those involved in change-making, which might undermine buy-in and create barriers to specification of the change. Future research that investigates the impact of different sources and of co-produced tailoring would support providers of feedback facilitation.
We measured the ‘dose’ of the facilitation and found wide variation, including the duration (15 to 1800 min), frequency of facilitation (1 to 42 episodes) and the number of recipients per site (1 to 135). There was also wide variation in the number of people receiving the intervention at once (1 to 45) and different modes used (e.g. through materials, face-to-face or virtual approaches). Future work could investigate the most (cost-) effective way to deliver feedback facilitation; for example, through the use of SMART optimisation designs [177] with economic evaluations. Such studies should assess both cost of delivery and of receipt. Consideration of real-life scalability would be valuable, given only one study delivered to more than 150 sites. All studies delivered facilitation to an intervention group. Questions remain about whether an adaptive intervention delivering sequences of feedback facilitation strategies as a co-intervention to audit and feedback, where the type, intensity or modality of the co-intervention evolve according to changing recipient responsiveness to feedback, might be more (cost-) effective.
Implementation strategies may contain different behaviour change techniques and act upon different mechanisms [17, 178]. The heterogeneity of feedback facilitation undermines the ability to draw conclusions about its effectiveness. We found that the ERIC compilation provided a valuable tool for identifying component strategies. However, given more recent work describing potential behaviour change techniques within strategies [178], it would support replication and learning if future papers describe the active ingredients (such as, instruction on how to perform behaviour, information about health consequences or social support) within strategies. We identified overlap in the content of ERIC strategies; for example, learning collaboratives often contained educational meetings, re-examining implementation, small tests of change, whilst other studies that also delivered these elements to multiple sites at once may not be described as a learning collaborative. Where an intervention was in the overlap between ERIC definitions, we used the terms used by the authors to categorise the intervention components. We were unable to code motivational text messages [47] using ERIC and included them as an additional strategy. Similarly, we determined that ‘clinical decision support systems’ incorporated both ‘change the clinical record system’ and ‘remind clinicians’ as the closest match. We found that 47 ERIC strategies were not incorporated into feedback facilitation (Supplementary materials 8) and may provide alternative content to future feedback facilitation providers; for example, to promote adaptability.
We explored whether reporting was improving over time. We found that later reported studies had fewer non-reports of TIDieR items as expected with changes in publishing requirements, but this only explains 5% of the variance. Further action to improve reporting may be needed to support interpretation of results, replication of interventions and the advancement of implementation science. We draw particular attention to the omission of the rationale and proximal target of the intended change.
As recommended in TIDieR [11], we sought the underlying rationale for the use of feedback facilitation: 35 studies referenced the use of theory and 10 studies provided a logic model describing their programme theory. Understanding the underlying rationale for an intervention supports replication, as adaptation around core components increases fit to the new context [14]. Describing the programme theory of an intervention also supports interpretation of results; for example, consideration of the coherence of the intervention, the proposed mechanism of effect, the context, the work being done by the intervention recipient and the assessed outcomes. Detailing causal pathways helps advance implementation science [17]. We found that within the 10 trials that had a logic model, there were gaps in the reporting of mechanisms (reported in 6 studies) and of contextual, predisposing or moderating factors (reported in 5 studies); Studies reporting this detail dated from 2011.
We found that feedback facilitation interventions sought to address motivation and capability. This was evidenced within: the proximal and distal outcomes where logic models were provided; the intervention materials (e.g. providing guidelines, detailing impacts upon outcomes and information about reimbursement and providing patient information and self-help materials); and the additional components. In relation to capabilities, the interventions sought to target both capabilities to improve (e.g. support to analyse influences upon care using a critical event analysis form or action plan template) and capabilities to deliver care (e.g. reminder cards or guideline documents). However, the target of the intended proximal change was often unclear; for example, whether education targeted improvement capabilities or knowledge about clinical care. Behaviour change literature (e.g. [179]) recommends specifying the target behaviour prior to the development of interventions. Omitting this information again hampers replication and the advancement of knowledge about what influences different behaviours. We found few examples of interventions addressing opportunity. Interventions may be enhanced by supporting the opportunity to undertake the improvement work; for example, by explicitly bringing that work into a workshop [9].
Strengths and limitations
There were minor variations from the protocol: We had planned to exclude papers that provided training in the target care practice, rather than the use of feedback, but found that it was not possible to identify the target behaviour of such training. We also planned to explore the extent to which the co-intervention was solely feedback facilitation but heterogeneity within feedback facilitation undermined our ability to assess this.
We sought the presence of a logic model, as recommended by guidance [19]. More recent guidance [14] recommends that a logic model is accompanied by a more detailed description of the programme theory; some studies (e.g. [123]) provided a narrative summary of the programme theory without a logic model. We included 146 papers describing 104 trials, however as with all reviews, there is a risk that we missed papers. We focussed on feedback facilitation within trials, which may differ from feedback facilitation undertaken outside of clinical trials. We included one paper [156] which described feedback facilitation alongside audit, but that was subsequently excluded from the Cochrane review due to the nature of the outcomes measured. Our data extraction template was adapted from the TIDieR framework, with the addition of prompts to seek strategy type, whether/how priorities for improvement were identified, whether/how influences upon performance were sought, whether/how strategies were selected and whether/how implications from performance were identified. Whilst we also sought other components to the intervention, it is possible that different prompts may have identified alternative factors important to the design and delivery of feedback facilitation. It is possible that increased granularity by categorising at the level of behaviour change technique (BCT) rather than ERIC strategy may have been useful, however gaps in recording would have been amplified at the active ingredient level. It is also possible that future feedback facilitation reviewers are seeking information about the mode of delivery found in ERIC strategies but missing from BCTs. We resolved disagreements through discussion but did not keep a record of the content of the discussion. The intervention deliverer (e.g. expert, peer) was difficult to assess from the information provided. It is possible that what is key is whether they are perceived as 'experts' or 'peers' (for example, if they are viewed as ‘credible source’ [180]), an assessment which might be made by each participant, rather than on the basis of a job title. In piloting, the reviewers found it difficult to agree on whether strategies addressed capability, opportunity or motivation. As a result, this was assessed by two reviewers (MS and SA) with training and experience of using COM-B [15] as part of a focussed assessment of the target of specific strategies. We focussed on the content and delivery and characteristics of the feedback recipients, the setting and the level of change sought. We did not collect information about the target behaviours upon which feedback is being given. Further work to explore the relationship between characteristics of the target behaviour(s) and the content and delivery of feedback facilitation may identify additional design choices.
Conclusion
Feedback facilitation is a much-used intervention delivered alongside large-scale audit and feedback to increase effectiveness. Health system policy and theory-informed hypotheses advocate for the delivery of feedback facilitation, often referred to as support for quality improvement. We describe heterogeneity in the design of feedback facilitation, highlighting some of the design choices for future providers (Table 5). We were able to describe the components with feedback facilitation using ERIC, but there was the opportunity for some minor clarifications in terms and for intervention providers to provide greater specificity. Whilst reporting demonstrated extensive gaps, hindering replication and learning, there was some evidence that reporting is improving over time. We recommend future work to consider the role of ‘opportunity’ within intervention designs and the use of evaluation techniques to maximise intervention efficiency.
Availability of data and materials
All data generated or analysed during this study are included in this published article [and its supplementary materials].
Abbreviations
- A&F:
-
Audit and facilitation
- BCT:
-
Behaviour change techniques
- ERIC:
-
Expert Recommendations for Implementing Change
- FF:
-
Feedback facilitation
- HQIP:
-
Health Quality Improvement Partnership
- IQR:
-
Inter-quartile range
- PRISMA:
-
Preferred Reporting Items for Systematic Reviews & Meta-Analyses (Appendix B)
- QIC:
-
Quality Improvement Collaborative
- SMART:
-
Sequential Multiple Assignment Randomized Trial
- TDF:
-
Theoretical domains framework
- TIDieR:
-
Template for Intervention Description and Replication
References
Ivers N, Jamtvedt G, Flottorp S, Young JM, Odgaard-Jensen J, French SD, O’Brien MA, Johansen M, Grimshaw J, Oxman AD. Audit and feedback: effects on professional practice and healthcare outcomes. Cochrane Database Syst Rev. 2012;6:CD000259.
Brown B, Gude WT, Blakeman T, van der Veer SN, Ivers N, Francis JJ, Lorencatto F, Presseau J, Peek N, Daker-White G. Clinical performance feedback intervention theory (CP-FIT): a new theory for designing, implementing, and evaluating feedback in health care based on a systematic review and meta-synthesis of qualitative research. Implement Sci. 2019;14(1):40.
Colquhoun HL, Carroll K, Eva KW, Grimshaw JM, Ivers N, Michie S, Brehaut JC. Informing the research agenda for optimizing audit and feedback interventions: results of a prioritization exercise. BMC Med Res Methodol. 2021;21(1):1–8.
Health Service Executive. National Review of Clinical Audit. Health Service Executive: Dublin, Ireland. 2019. Available from: national-review-of-clinical-audit-report-2019.pdf. Accessed 26 Sept 2023.
Healthcare Quality Improvement Partnership. Maximising the Quality Improvement potential of the National Clinical Audit and Patient Outcomes Programme. HQIP: London, UK; 2021. Available at: https://www.hqip.org.uk. Accessed 26 Sept 2023.
Cooke LJ, Duncan D, Rivera L, Dowling SK, Symonds C, Armson H. How do physicians behave when they participate in audit and feedback activities in a group with their peers? Implement Sci. 2018;13(1):104.
McHugh SM, Riordan F, Curran GM, Lewis CC, Wolfenden L, Presseau J, Lengnick-Hall R, Powell BJ. Conceptual tensions and practical trade-offs in tailoring implementation interventions. Front Health Serv. 2022;17(2):974095.
Weiner BJ. A theory of organizational readiness for change. Implement Sci. 2009;4(1):1–9.
Sykes M, O’Halloran E, Mahon L, McSharry J, Allan L, Thomson R, Finch T, Kolehmainen N. Enhancing national audit through addressing the quality improvement capabilities of feedback recipients: a multi-phase intervention development study. Pilot Feasibility Stud. 2022;8(1):1–8.
Ivers N. Audit and Feedback Systematic Review: Data Abstraction Guide. 2019. Unpublished.
Hoffmann TC, Glasziou PP, Boutron I, Milne R, Perera R, Moher D, Altman DG, Barbour V, Macdonald H, Johnston M, Lamb SE. Better reporting of interventions: template for intervention description and replication (TIDieR) checklist and guide. Bmj. 2014;348. https://doi.org/10.1136/bmj.g1687.
Powell BJ, Waltz TJ, Chinman MJ, Damschroder LJ, Smith JL, Matthieu MM, Proctor EK, Kirchner JE. A refined compilation of implementation strategies: results from the Expert Recommendations for Implementing Change (ERIC) project. Implement Sci. 2015;10(1):21.
Colquhoun HL, Brehaut JC, Sales A, Ivers N, Grimshaw J, Michie S, Carroll K, Chalifoux M, Eva KW. A systematic review of the use of theory in randomized controlled trials of audit and feedback. Implement Sci. 2013;8(1):1–8.
Skivington K, Matthews L, Craig P, Simpson S, Moore L. Developing and evaluating complex interventions: updating Medical Research Council guidance to take account of new methodological and theoretical approaches. Lancet. 2018;1(392):S2.
Michie S, Van Stralen MM, West R. The behaviour change wheel: a new method for characterising and designing behaviour change interventions. Implement Sci. 2011;6(1):1–2.
Rychetnik L, Hawe P, Waters E, Barratt A, Frommer M. A glossary for evidence based public health. J Epidemiol Comm Health. 2004;58:538–45.
Lewis CC, Klasnja P, Powell BJ, Lyon AR, Tuzzio L, Jones S, Walsh-Bailey C, Weiner B. From classification to causality: advancing understanding of mechanisms of change in implementation science. Front Public Health. 2018;7(6):136.
Smith JD, Li DH, Rafferty MR. The implementation research logic model: a method for planning, executing, reporting, and synthesizing implementation projects. Implement Sci. 2020;15:1–2.
Craig P, Dieppe P, Macintyre S, Michie S, Nazareth I, Petticrew M. Developing and evaluating complex interventions: the new Medical Research Council guidance. BMJ. 2008;337:a1655. https://doi.org/10.1136/bmj.a1655.
Mills T, Lawton R, Sheard L. Advancing complexity science in healthcare research: the logic of logic models. BMC Med Res Methodol. 2019;19(1):1–1.
Ivers N, Antony J, Konnyu, K, O'Connor D, Presseau, J,Grimshaw J. Audit and feedback: effects on professional practice [protocol for a Cochrane review update]. 2022. Available from: https://zenodo.org/record/6354035 Accessed 26 Sept 2023.
Cooke LJ, Duncan D, Rivera L, Dowling SK, Symonds C, Armson H. The Calgary Audit and Feedback Framework: a practical, evidence-informed approach for the design and implementation of socially constructed learning interventions using audit and group feedback. Implement Sci. 2018;13(1):1–8.
Sykes M, Alderson S, Thomas O, Caulfield K, Robinson L, Quigley M, Gupta L, Rosenberg-Yunger Z. Exploring the components of feedback facilitation: a systematic review. Available from: https://www.protocols.io/view/exploring-the-components-of-feedback-facilitation-8epv5jm8dl1b/v1. Accessed 26 Sept 2023.
Althabe F, Chomba E, Tshefu AK, Banda E, Belizán M, Bergel E, Berrueta M, Bertrand J, Bose C, Cafferata ML, Carlo WA. A multifaceted intervention to improve syphilis screening and treatment in pregnant women in Kinshasa, Democratic Republic of the Congo and in Lusaka, Zambia: a cluster randomised controlled trial. Lancet Glob Health. 2019;7(5):e655–63.
Nkamba D, Mwenechanya M, Kilonga AM, et al. Barriers and facilitators to the implementation of antenatal syphilis screening and treatment for the prevention of congenital syphilis in the Democratic Republic of Congo and Zambia: results of qualitative formative research. BMC Health Serv Res. 2017;17:556.
Avery AJ, Rodgers S, Cantrill JA, Armstrong S, Boyd M, Cresswell K, Eden M, Elliott R, Franklin M, Hippisley-Cox J, Howard R. PINCER trial: a cluster randomised trial comparing the effectiveness and cost-effectiveness of a pharmacist-led IT-based intervention with simple feedback in reducing rates of clinically important errors in medicines management in 113, general practices. Available at: https://web.archive.org/web/20170809093609id_/http://www.birmingham.ac.uk/Documents/college-mds/haps/projects/cfhep/psrp/finalreports/PS024PINCERFinalReportOctober2010.pdf. Accessed 29 Aug 2023.
Awad AI, Eltayeb IB, Baraka OZ. Changing antibiotics prescribing practices in health centers of Khartoum State, Sudan. Eur J Clin Pharmacol. 2006;62:135–42.
Ayieko P, Ntoburi S, Wagai J, Opondo C, Opiyo N, Migiro S, Wamae A, Mogoa W, Were F, Wasunna A, Fegan G. A multifaceted intervention to implement guidelines and improve admission paediatric care in Kenyan district hospitals: a cluster randomised trial. PLoS Med. 2011;8(4):e1001018.
Wagai J, Mbindyo P, Mbaabu L, et al. Implementation experience during an eighteen month intervention to improve paediatric and newborn care in Kenyan district hospitals. Implement Sci. 2009;4:45.
Ayieko P, Irimu G, Ogero M, Mwaniki P, Malla L, Julius T, Chepkirui M, Mbevi G, Oliwa J, Agweyu A, Akech S. Effect of enhancing audit and feedback on uptake of childhood pneumonia treatment policy in hospitals that are part of a clinical network: a cluster randomized trial. Implement Sci. 2019;14(1):1–4.
English M, Ayieko P, Nyamai R, Were F, Githanga D, Irimu G. What do we think we are doing? How might a clinical information network be promoting implementation of recommended paediatric care practices in Kenyan hospitals? Heal Res Policy Syst. 2017;15:4. https://doi.org/10.1186/s12961-017-0172-1.
Baker R, Farooqi A, Tait C, Walsh S. Randomised controlled trial of reminders to enhance the impact of audit in general practice on management of patients who use benzodiazepines. BMJ Qual Saf. 1997;6(1):14–8.
Baldwin NS, Gilpin DF, Tunney MM, Kearney MP, Crymble L, Cardwell C, Hughes CM. Cluster randomised controlled trial of an infection control education and training intervention programme focusing on meticillin-resistant Staphylococcus aureus in nursing homes for older people. J Hosp Infect. 2010;76(1):36–41.
Barkun AN, Bhat M, Armstrong D, Dawes M, Donner A, Enns R, Martin J, Moayyedi P, Romagnuolo J, Stitt L. Effectiveness of disseminating consensus management recommendations for ulcer bleeding: a cluster randomized trial. CMAJ. 2013;185(3):E156–66.
Bertoni AG, Bonds DE, Chen H, Hogan P, Crago L, Rosenberger E, Barham AH, Clinch CR, Goff DC. Impact of a multifaceted intervention on cholesterol management in primary care practices: guideline adherence for heart health randomized trial. Arch Intern Med. 2009;169(7):678–86.
Bloos F, Rueddel H, Thomas-Rueddel D, Schwarzkopf D, Pausch C, Harbarth S, Schreiber T, Gründling M, Marshall J, Simon P, Levy MM. Effect of a multifaceted educational intervention for anti-infectious measures on sepsis mortality: a cluster randomized trial. Intensive Care Med. 2017;43:1602–12.
Bloos F, Thomas-Rüddel D, Rüddel H, Engel C, Schwarzkopf D, Marshall JC, Harbarth S, Simon P, Riessen R, Keh D, Dey K. Impact of compliance with infection management guidelines on outcome in patients with severe sepsis: a prospective observational multi-center study. Crit Care. 2014;18(2):1.
Bond TC, Patel PR, Krisher J, Sauls L, Deane J, Strott K, McClellan W. A group-randomized evaluation of a quality improvement intervention to improve influenza vaccination rates in dialysis centers. Am J Kidney Dis. 2011;57(2):283–90.
Bonevski B, Sanson-Fisher RW, Campbell E, Carruthers A, Reid AL, Ireland M. Randomized controlled trial of a computer strategy to increase general practitioner preventive care. Prev Med. 1999;29(6):478–86.
Borgiel AE, Williams JI, Davis DA, Dunn EV, Hobbs N, Hutchison B, Wilson CR, Jensen J, O’Neil JJ, Bass MJ. Evaluating the effectiveness of 2 educational interventions in family practice. CMAJ. 1999;161(8):965–70.
Bregnhøj L, Thirstrup S, Kristensen MB, Bjerrum L, Sonne J. Combined intervention programme reduces inappropriate prescribing in elderly patients exposed to polypharmacy in primary care. Eur J Clin Pharmacol. 2009;65:199–207.
Brown LF, Keily PA, Spencer AJ. Evaluation of a continuing education intervention “Periodontics in General Practice.” Commun Dent Oral Epidemiol. 1994;22(6):441–7.
Chaillet N, Dumont A, Abrahamowicz M, Pasquier JC, Audibert F, Monnier P, Abenhaim HA, Dubé E, Dugas M, Burne R, Fraser WD. A cluster-randomized trial to reduce cesarean delivery rates in Quebec. N Engl J Med. 2015;372(18):1710–21.
Charrier L, Allochis MC, Cavallo MR, Gregori D, Cavallo F, Zotti CM. Integrated audit as a means to implement unit protocols: a randomized and controlled study. J Eval Clin Pract. 2008;14(5):847–53.
Clarke M, Devane D, Gross MM, Morano S, Lundgren I, Sinclair M, Putman K, Beech B, Vehviläinen-Julkunen K, Nieuwenhuijze M, Wiseman H. OptiBIRTH: a cluster randomised trial of a complex intervention to increase vaginal birth after caesarean section. BMC Pregnancy Childbirth. 2020;20:1–7.
Grylka-Baeschlin S, Nicoletti J, Sinclair M, Maguire R, Carroll M, Begley C. Process evaluation for OptiBIRTH, a randomised controlled trial of a complex intervention designed to increase rates of vaginal birth after caesarean section. Trials. 2018;19(1):9. https://doi.org/10.1186/s13063-017-2401-x.
Cundill B, Mbakilwa H, Chandler CI, Mtove G, Mtei F, Willetts A, Foster E, Muro F, Mwinyishehe R, Mandike R, Olomi R. Prescriber and patient-oriented behavioural interventions to improve use of malaria rapid diagnostic tests in Tanzania: facility-based cluster randomised trial. BMC Med. 2015;13:1–6.
Chandler CI, Meta J, Ponzo C, Nasuwa F, Kessy J, Mbakilwa H, et al. The development of effective behaviour change interventions to support the use of malaria rapid diagnostic tests by Tanzanian clinicians. Implement Sci. 2014;9:83.
Curtis JR, Nielsen EL, Treece PD, Downey L, Dotolo D, Shannon SE, Back AL, Rubenfeld GD, Engelberg RA. Effect of a quality-improvement intervention on end-of-life care in the intensive care unit: a randomized trial. Am J Respir Crit Care Med. 2011;183(3):348–55.
Curtis JR, Treece PD, Nielsen EL, Downey L, Shannon SE, Braungardt T, Owens D, Steinberg KP, Engelberg RA. Integrating palliative and critical care: evaluation of a quality-improvement intervention. Am J Respir Crit Care Med. 2008;178:269–75.
Treece PD, Engelberg RA, Shannon SE, Nielsen EL, Braungardt T, Rubenfeld GD, Steinberg KP, Curtis JR. Integrating palliative and critical care: description of an intervention. Crit Care Med. 2006;34:S380–7.
DeVore AD, Cox M, Heidenreich PA, Fonarow GC, Yancy CW, Eapen ZJ, Peterson ED, Hernandez AF. Cluster-randomized trial of personalized site performance feedback in get with the guidelines-heart failure. Circ Cardiovasc Qual Outcomes. 2015;8(4):421–7.
Everett GD, deBlois CS, Chang PF. Effect of cost education, cost audits, and faculty chart review on the use of laboratory services. Arch Intern Med. 1983;143(5):942–4.
Fabbri C, Dutt V, Shukla V, Singh K, Shah N, Powell-Jackson T. The effect of report cards on the coverage of maternal and neonatal health care: a factorial, cluster-randomised controlled trial in Uttar Pradesh, India. Lancet Glob Health. 2019;7(8):e1097–108.
Filardo G, Nicewander D, Herrin J, Edwards J, Galimbertti P, Tietze M, Mcbride S, Gunderson J, Collinsworth A, Haydar Z, Williams J. A hospital-randomized controlled trial of a formal quality improvement educational program in rural and small community Texas hospitals: one year results. Int J Qual Health Care. 2009;21(4):225–32.
Filardo G, Nicewander D, Herrin J, et al. A hospital-randomized controlled trial of an educational quality improvement intervention in rural and small community hospitals in texas following implementation of information technology. Am J Med Qual. 2007;22:418–27.
Filardo G, Nicewander D, Herrin J, et al. Challenges in conducting a hospital-randomized trial of an educational quality improvement intervention in rural and small community hospitals. Am J Med Qual. 2008;23:440–7.
Foster JM, Hoskins G, Smith B, Lee AJ, Price D, Pinnock H. Practice development plans to improve the primary care management of acute asthma: randomised controlled trial. BMC Fam Pract. 2007;8(1):1–3.
Foy R, Penney GC, Grimshaw JM, Ramsay CR, Walker AE, MacLennan G, Stearns SC, McKenzie L, Glasier A. A randomised controlled trial of a tailored multifaceted strategy to promote implementation of a clinical guideline on induced abortion care. BJOG. 2004;111(7):726–33.
Frijling BD, Lobo CM, Hulscher ME, Akkermans RP, Braspenning JC, Prins A, Van Der Wouden JC, Grol RP. Multifaceted support to improve clinical decision making in diabetes care: a randomized controlled trial in general practice. Diabet Med. 2002;19(10):836–42.
Frijling BD, Lobo CM, Hulscher ME, Akkermans RP, van Drenth BB, Prins A, van der Wouden JC, Grol RP. Intensive support to improve clinical decision making in cardiovascular care: a randomised controlled trial in general practice. BMJ Qual Saf. 2003;12(3):181–7.
Lobo CM, Frijling BD, Hulscher ME, Bernsen RM, Braspenning JC, Grol RP, Prins A, van der Wouden JC. Organisational determinants of cardiovascular prevention in general practice. Scand J Prim Health Care. 2003;21(2):99–105.
Frijling BD, Lobo CM, Hulscher ME, van Drenth BB, Braspenning JC, Prins A, van der Wouden JC, Grol RP. Provision of information and advice in cardiovascular care: clinical performance of general practitioners. Patient Educ Couns. 2002;48(2):131–7.
Frijling BD, Spies TH, Lobo CM, Hulscher ME, van Drenth BB, Braspenning JC, Prins A, van der Wouden JC, Grol RP. Blood pressure control in treated hypertensive patients: clinical performance of general practitioners. Br J Gen Pract. 2001;51(462):9–14.
Frijling BD, Lobo CM, Keus IM, Jenks KM, Akkermans RP, Hulscher ME, Prins A, van der Wouden JC, Grol RP. Perceptions of cardiovascular risk among patients with hypertension or diabetes. Patient Educ Couns. 2004;52(1):47–53.
Lobo CM, Frijling BD, Hulscher ME, Bernsen RM, Braspenning JC, Grol RP, Prins A, van der Wouden JC. Improving quality of organizing cardiovascular preventive care in general practice by outreach visitors: a randomized controlled trial. Prev Med. 2002;35(5):422–9.
Lobo CM, Frijling BD, Hulscher ME, Braspenning JC, Grol RP, Prins A, van der Wouden JC. Organizing cardiovascular preventive care in general practice: determinants of a successful intervention. Prev Med. 2002;35(5):430–6.
Gilkey MB, Dayton AM, Moss JL, Sparks AC, Grimshaw AH, Bowling JM, Brewer NT. Increasing provision of adolescent vaccines in primary care: a randomized controlled trial. Pediatrics. 2014;134(2):e346–53.
Gilkey MB, Moss JL, Roberts AJ, Dayton AM, Grimshaw AH, Brewer NT. Comparing in-person and webinar delivery of an immunization quality improvement program: a process evaluation of the adolescent AFIX trial. Implement Sci. 2014;9(1):21.
Gilkey MB, Parks MJ, Margolis MA, McRee AL, Terk JV. Implementing evidence-based strategies to improve HPV vaccine delivery. Pediatrics. 2019;144(1):e20182500.
Gjelstad S, Høye S, Straand J, Brekke M, Dalen I, Lindbæk M. Improving antibiotic prescribing in acute respiratory tract infections: cluster randomised trial from Norwegian general practice (prescription peer academic detailing (Rx-PAD) study). BMJ. 2013;26:347.
Gjelstad S, Fetveit A, Straand J, Dalen I, Rognstad S, Lindbaek M. Can antibiotic prescriptions in respiratory tract infections be improved? A cluster-randomized educational intervention in general practice–the Prescription Peer Academic Detailing (Rx-PAD) Study [NCT00272155]. BMC Health Serv Res. 2006;6:1–2.
Guadagnoli E, Soumerai SB, Gurwitz JH, Borbas C, Shapiro CL, Weeks JC, Morris N. Improving discussion of surgical treatment options for patients with breast cancer: local medical opinion leaders versus audit and performance feedback. Breast Cancer Res Treat. 2000;61:171–5.
Gude WT, van Engen-Verheul MM, van der Veer SN, Kemps HM, Jaspers MW, de Keizer NF, Peek N. Effect of a web-based audit and feedback intervention with outreach visits on the clinical performance of multidisciplinary teams: a cluster-randomized trial in cardiac rehabilitation. Implement Sci. 2016;11:1–6.
van Engen-Verheul MM, de Keizer NF, van der Veer SN, Kemps H, Reimer WJ, Jaspers MW, Peek N. Evaluating the effect of a web-based quality improvement system with feedback and outreach visits on guideline concordance in the field of cardiac rehabilitation: rationale and study protocol. Implement Sci. 2014;9(1):1–5.
Gulliford MC, Juszczyk D, Prevost AT, Soames J, McDermott L, Sultana K, Wright M, Fox R, Hay AD, Little P, Moore M. Electronically delivered interventions to reduce antibiotic prescribing for respiratory infections in primary care: cluster RCT using electronic health records and cohort study. Health Technol Assess. 2019;23(11):1.
Gullion DS, Tschann JM, Adamson TE, Coates TJ. Management of hypertension in private practice: a randomized controlled trial in continuing medical education. J Contin Educ Heal Prof. 1988;8(4):239–55.
Harris MF, Parker SM, Litt J, Van Driel M, Russell G, Mazza D, Jayasinghe UW, Del Mar C, Lloyd J, Smith J, Zwar N. Implementing guidelines to routinely prevent chronic vascular disease in primary care: the Preventive Evidence into Practice cluster randomised controlled trial. BMJ Open. 2015;5(12):e009397.
Hayes R, Armour B, Bratzler D, Moore L, Murray C, Stevens BR, Radford M, Fitzgerald D, Elward K, Ballard DJ. Comparison of an enhanced versus a written feedback model on the management of Medicare inpatients with venous thrombosis. Jt Comm J Qual Improv. 2001;27(3):155–68.
Hayes RP, Baker DW, Luthi JC, Baggett RL, McClellan W, Fitzgerald D, Abrams FR, Bratzler D, Ballard DJ. The effect of external feedback on the management of medicare inpatients with congestive heart failure. Am J Med Qual. 2002;17(6):225–35.
Hayes RP, Ballard DJ. Feedbck about practice patterns for measurable iprovements in quality of care: a challenge for PROs under the Health Care Quality Improvement Initiative. Clin Perform Qual Health Care. 1995;3:15–22.
Hendryx MS, Fieselmann JF, Jeanne Bock M, Wakefield DS, Helms CM, Bentler SE. Outreach education to improve quality of rural ICU care: results of a randomized trial. Am J Respir Crit Care Med. 1998;158(2):418–23.
Herbert CP, Wright JM, Maclure M, Wakefield J, Dormuth C, Brett-MacLean P, Legare J, Premi J. Better Prescribing Project: a randomized controlled trial of the impact of case-based educational modules and personal prescribing feedback on prescribing for hypertension in primary care. Fam Pract. 2004;21(5):575–81.
Hogg W, Lemelin J, Graham ID, Grimshaw J, Martin C, Moore L, Soto E, O’Rourke K. Improving prevention in primary care: evaluating the effectiveness of outreach facilitation. Fam Pract. 2008;25(1):40–8.
Lemelin J, Hogg W, Baskerville N. Evidence to action: a tailored multifaceted approach to changing family physician practice patterns and improving preventive care. CMAJ. 2001;164(757–763):11.
Houston TK, Sadasivam RS, Allison JJ, Ash AS, Ray MN, English TM, Hogan TP, Ford DE. Evaluating the QUIT-PRIMO clinical practice ePortal to increase smoker engagement with online cessation interventions: a national hybrid type 2 implementation study. Implement Sci. 2015;10(1):1–6.
Houston TK, Sadasivam RS, Ford DE, Richman J, Ray MN, Allison JJ. The QUIT-PRIMO provider-patient Internet-delivered smoking cessation referral intervention: a cluster-randomized comparative effectiveness trial: study protocol. Implement Sci. 2010;5(1):1–9.
Huffman MD, Mohanan PP, Devarajan R, Baldridge AS, Kondal D, Zhao L, Ali M, Krishnan MN, Natesan S, Gopinath R, Viswanathan S. Effect of a quality improvement intervention on clinical outcomes in patients in India with acute myocardial infarction: the ACS QUIK randomized clinical trial. JAMA. 2018;319(6):567–78.
Huis A, Schoonhoven L, Grol R, Donders R, Hulscher M, van Achterberg T. Impact of a team and leaders-directed strategy to improve nurses’ adherence to hand hygiene guidelines: a cluster randomised trial. Int J Nurs Stud. 2013;50(4):464–74.
Ivers NM, Tu K, Young J, Francis JJ, Barnsley J, Shah BR, Upshur RE, Moineddin R, Grimshaw JM, Zwarenstein M. Feedback GAP: pragmatic, cluster-randomized trial of goal setting and action plans to increase the effectiveness of audit and feedback interventions in primary care. Implement Sci. 2013;8:1–1.
Ivers NM, Tu K, Francis J, Bransley J, Shah B, Upshur R, Kiss A, Grimshaw JM, Zwarenstein M. Trial of Goal-setting and Action-Plans to increase the effectiveness of audit and feedback interventions in primary care. Study protocol. Implement Sci. 2010;5.
Kaufmann-Kolle P, Szecsenyi J, Broge B, Haefeli WE, Schneider A. Führt die Implementierung von offenem Benchmarking in datengestützten Qualitätszirkeln zur Verbesserung der hausärztlichen Versorgung bei Arzneimittelinteraktion und Asthma bronchiale? Z Evid Fortbild Qual Gesundhwes. 2011;105(5):389–95.
Kennedy CC, Ioannidis G, Thabane L, Adachi JD, Marr S, Giangregorio LM, Morin SN, Crilly RG, Josse RG, Lohfeld L, Pickard LE. Successful knowledge translation intervention in long-term care: final results from the vitamin D and osteoporosis study (ViDOS) pilot cluster randomized controlled trial. Trials. 2015;16(1):1–1.
Kennedy CC, Ioannidis G, Giangregorio LM, Adachi JD, Thabane L, Morin SN, Crilly RG, Marr S, Josse RG, Lohfeld L, Pickard LE. An interdisciplinary knowledge translation intervention in long-term care: study protocol for the vitamin D and osteoporosis study (ViDOS) pilot cluster randomized controlled trial. Implement Sci. 2012;7(1):1–2.
Kennedy CC, Thabane L, Ioannidis G, Adachi JD, Papaioannou A. Implementing a knowledge translation intervention in long-term care: feasibility results from the Vitamin D and Osteoporosis Study (ViDOS). J Am Med Dir Assoc. 2014;15:943–5.
Kiefe CI, Allison JJ, Williams OD, Person SD, Weaver MT, Weissman NW. Improving quality improvement using achievable benchmarks for physician feedback: a randomized controlled trial. JAMA. 2001;285(22):2871–9.
Kritchevsky SB, Braun BI, Bush AJ, Bozikis MR, Kusek L, Burke JP, Wong ES, Jernigan J, Davis CC, Simmons B, TRAPE Study Group*. The effect of a quality improvement collaborative to improve antimicrobial prophylaxis in surgical patients: a randomized trial. Ann Intern Med. 2008;149(7):472–80.
Kritchevsky SB, Simmons BP, Braun BI. The project to monitor indicators: a collaborative effort between the Joint Commission on Accreditation of Healthcare Organizations and the Society for Healthcare Epidemiology of America. Infect Control Hosp Epidemiol. 1995;16:33–5.
Lakshminarayan K, Borbas C, McLaughlin B, Morris NE, Vazquez G, Luepker RV, Anderson DC. A cluster-randomized trial to improve stroke care in hospitals. Neurology. 2010;74(20):1634–42.
Lemelin J, Hogg W, Baskerville N. Evidence to action: a tailored multifaceted approach to changing family physician practice patterns and improving preventive care. CMAJ. 2001;164(6):757–63.
Baskerville NB, Hogg W, Lemelin J. Process evaluation of a tailored multifaceted approach to changing family physician practice patterns improving preventive care. J Fam Pract. 2001;50(3):W242–9.
Lesuis N, van Vollenhoven RF, Akkermans RP, Verhoef LM, Hulscher ME, den Broeder AA. Rheumatologists’ guideline adherence in rheumatoid arthritis: a randomised controlled study on electronic decision support, education and feedback. Clin Exp Rheumatol. 2018;36(1):21–8.
Levi CR, Attia JA, D’Este C, Ryan AE, Henskens F, Kerr E, Parsons MW, Sanson-Fisher RW, Bladin CF, Lindley RI, Middleton S. Cluster-Randomized trial of thrombolysis implementation support in metropolitan and regional Australian stroke centers: lessons for individual and systems behavior change. J Am Heart Assoc. 2020;9(3):e012732.
Paul CL, Levi CR, D’Este CA, Parsons MW, Bladin CF, Lindley RI, Attia JR, Henskens F, Lalor E, Longworth M, Middleton S. Thrombolysis ImPlementation in Stroke (TIPS): evaluating the effectiveness of a strategy to increase the adoption of best evidence practice–protocol for a cluster randomised controlled trial in acute stroke care. Implement Sci. 2014;9(1):1–3.
Lopez-Picazo JJ, Ruiz JC, Sanchez JF, Ariza A, Aguilera B. A randomized trial of the effectiveness and efficiency of interventions to reduce potential drug interactions in primary care. Am J Med Qual. 2011;26(2):145–53.
Lynch EA, Cadilhac DA, Luker JA, Hillier SL. Education-only versus a multifaceted intervention for improving assessment of rehabilitation needs after stroke; a cluster randomised trial. Implement Sci. 2015;11(1):1–3.
Lynch EA, Luker JA, Cadilhac DA, Hillier SL. Rehabilitation assessments for patients with stroke in Australian hospitals do not always reflect the patients’ rehabilitation requirements. Arch Phys Med Rehabil. 2015;96:782–9.
Lynch EA, Luker JA, Cadilhac DA, Fryer CE, Hillier S. A qualitative study using the Theoretical Domains Framework to investigate why patients were or were not assessed for rehabilitation after stroke. Clin Rehabil. 2017;31(7):966–77.
McCartney P, Macdowall W, Thorogood M. A randomised controlled trial of feedback to general practitioners of their prophylactic aspirin prescribing. BMJ. 1997;315(7099):35–6.
McClellan WM, Hodgin E, Pastan S, McAdams L, Soucie M. A Randomized Evaluation of Two Health Care Quality Improvement Program (HCQIP) Interventions to Improve the Adequacy of Hemodialysis Care of ESRD Patients: Feedback Alone: versus: Intensive Intervention. J Am Soc Nephrol. 2004;15(3):754–60.
McCluskey A, Ada L, Kelly PJ, Middleton S, Goodall S, Grimshaw JM, Logan P, Longworth M, Karageorge A. A behavior change program to increase outings delivered during therapy to stroke survivors by community rehabilitation teams: the Out-and-About trial. Int J Stroke. 2016;11(4):425–37.
Mertens JR, Chi FW, Weisner CM, Satre DD, Ross TB, Allen S, Pating D, Campbell CI, Lu YW, Sterling SA. Physician versus non-physician delivery of alcohol screening, brief intervention and referral to treatment in adult primary care: the ADVISe cluster randomized controlled implementation trial. Addict Sci Clin Pract. 2015;10(1):1–7.
Moher M, Yudkin P, Wright L, Turner R, Fuller A, Schofield T, Mant D. Cluster randomised controlled trial to compare three methods of promoting secondary prevention of coronary heart disease in primary care. BMJ. 2001;322(7298):1338.
Mold JW, Fox C, Wisniewski A, Lipman PD, Krauss MR, Harris DR, Aspy C, Cohen RA, Elward K, Frame P, Yawn BP. Implementing asthma guidelines using practice facilitation and local learning collaboratives: a randomized controlled trial. Ann Fam Med. 2014;12(3):233–40.
Mold JW, Aspy CA, Nagykaldi Z. Implementation of evidence-based preventive services delivery processes in primary care: an Oklahoma Physicians Resource/Research Network (OKPRN) study. J Am Board Fam Med. 2008;21(4):334–44.
Myers RE, Turner B, Weinberg D, Hyslop T, Hauck WW, Brigham T, Rothermel T, Grana J, Schlackman N. Impact of a physician-oriented intervention on follow-up in colorectal cancer screening. Prev Med. 2004;38(4):375–81.
Myers RE, Turner B, Weinberg D, Hauck WW, Hyslop T, Brigham T, Rothermel T, Grana J, Schlackman N. Complete diagnostic evaluation in colorectal cancer screening: research design and baseline findings. Prev Med. 2001;33(4):249–60.
Nilsson G, Hjemdahl P, Hässler A, Vitols S, Wallen NH, Krakau I. Feedback on prescribing rate combined with problem-oriented pharmacotherapy education as a model to improve prescribing behaviour among general practitioners. Eur J Clin Pharmacol. 2001;56:843–8.
Palmer RH, Louis TA, Hsu LN, Peterson HF, Rothrock JK, Strain R, Thompson MS, Wright EA. A randomized controlled trial of quality assurance in sixteen ambulatory care practices. Med Care. 1985;1:751–70.
Palmer RH, Strain R, Maurer JV, Thompson MS. A method for evaluating performance of ambulatory pediatric tasks. Pediatrics. 1984;73(3):269–77.
Papadakis S, Cole AG, Reid RD, Assi R, Gharib M, Tulloch HE, Mullen KA, Wells G, Pipe AL. From good to great: the role of performance coaching in enhancing tobacco-dependence treatment rates. Ann Fam Med. 2018;16(6):498–506.
Papadakis S, Pipe AL, Reid RD, Tulloch H, Mullen KA, Assi R, Cole AG, Wells G. Effectiveness of performance coaching for enhancing rates of smoking cessation treatment delivery by primary care providers: study protocol for a cluster randomized controlled trial. Contemp Clin Trials. 2015;1(45):184–90.
Patel MS, Kurtzman GW, Kannan S, Small DS, Morris A, Honeywell S, Leri D, Rareshide CA, Day SC, Mahoney KB, Volpp KG. Effect of an automated patient dashboard using active choice and peer comparison performance feedback to physicians on statin prescribing: the PRESCRIBE cluster randomized clinical trial. JAMA Netw Open. 2018;1(3):e180818.
Peiris D, Usherwood T, Panaretto K, Harris M, Hunt J, Redfern J, Zwar N, Colagiuri S, Hayman N, Lo S, Patel B. Effect of a computer-guided, quality improvement program for cardiovascular disease risk management in primary health care: the treatment of cardiovascular risk using electronic decision support cluster-randomized trial. Circ Cardiovasc Qual Outcomes. 2015;8(1):87–95.
Peiris D, Usherwood T, Panaretto K, Harris M, Hunt J, Patel B, Zwar N, Redfern J, MacMahon S, Colagiuri S, Hayman N. The Treatment of cardiovascular Risk in Primary care using Electronic Decision suppOrt (TORPEDO) study: intervention development and protocol for a cluster randomised, controlled trial of an electronic decision support and quality improvement intervention in Australian primary healthcare. BMJ Open. 2012;2(6):e002177.
Pettersson E, Vernby Å, Mölstad S, Lundborg CS. Can a multifaceted educational intervention targeting both nurses and physicians change the prescribing of antibiotics to nursing home residents? A cluster randomized controlled trial. J Antimicrob Chemother. 2011;66(11):2659–66.
Price-Haywood EG, Harden-Barrios J, Cooper LA. Comparative effectiveness of audit-feedback versus additional physician communication training to improve cancer screening for patients with limited health literacy. J Gen Intern Med. 2014;29:1113–21.
Price-Haywood EG, Roth KG, Shelby K, Cooper LA. Cancer risk communication with low health literacy patients: a continuing medical education program. J Gen Intern Med. 2010;25:126–9.
Quanbeck A, Brown RT, Zgierska AE, Jacobson N, Robinson JM, Johnson RA, Deyo BM, Madden L, Tuan WJ, Alagoz E. A randomized matched-pairs study of feasibility, acceptability, and effectiveness of systems consultation: a novel implementation strategy for adopting clinical guidelines for opioid prescribing in primary care. Implement Sci. 2018;13:1–3.
Quanbeck A, Brown R, Zgierska A, Jacobson N, Robinson J, Alagoz E, Deyo B, Madden L, Johnson R, Tuan WJ. Systems consultation: a novel implementation strategy for adopting clinical guidelines for opioid prescribing in primary care. Annual Research Meeting. 2017. Academy Health: Wisconsin, US. Available from:https://academyhealth.confex.com/academyhealth/2017arm/mediafile/Presentation/Paper16946/Andrew%20Quanbeck_%20academyhealth%20oral%20present%206-23-17.pdf. Accessed 26 Sept 2023.
Quanbeck A, Almirall D, Jacobson N, Brown RT, Landeck JK, Madden L, Cohen A, Deyo BM, Robinson J, Johnson RA, Schumacher N. The Balanced Opioid Initiative: protocol for a clustered, sequential, multiple-assignment randomized trial to construct an adaptive implementation strategy to improve guideline-concordant opioid prescribing in primary care. Implement Sci. 2020;15:1–3.
Quinley JC, Shih A. Improving physician coverage of pneumococcal vaccine: a randomized trial of a telephone intervention. J Community Health. 2004;29:103–15.
Raasch BA, Hays R, Buettner PG. An educational intervention to improve diagnosis and management of suspicious skin lesions. J Contin Educ Heal Prof. 2000;20(1):39–51.
Raasch B. The epidemiology, diagnosis and management of nonmelanoma skin cancer in general practice in Townsville. PhD thesis, James Cook University, Australia. 1999.
Raja AS, Ip IK, Dunne RM, Schuur JD, Mills AM, Khorasani R. Effects of performance feedback reports on adherence to evidence-based guidelines in use of CT for evaluation of pulmonary embolism in the emergency department: a randomized trial. Am J Roentgenol. 2015;205(5):936–40.
Rantz MJ, Popejoy L, Petroski GF, Madsen RW, Mehr DR, Zwygart-Stauffacher M, Hicks LL, Grando V, Wipke-Tevis DD, Bostick J, Porter R. Randomized clinical trial of a quality improvement intervention in nursing homes. Gerontologist. 2001;41(4):525–38.
Rask K, Kohler SA, Wells KI, Williams JA, Diamond CC. Performance improvement interventions to improve delivery of screening services in diabetes care. JCOM-WAYNE PA-. 2001;8(11):23–30.
Ruangkanchanasetr S. Laboratory investigation utilization in pediatric out-patient department Ramathibodi Hospital. J Med Assoc Thai. 1993;1(76):194–208.
Rubin GL, Schofield WN, Dean MG, Shakeshaft AP. Appropriateness of red blood cell transfusions in major urban hospitals and effectiveness of an intervention. Med J Aust. 2001;175(7):354–8.
Sauaia A, Ralston D, Schluter WW, Marciniak TA, Havranek EP, Dunn TR. Influencing care in acute myocardial infarction: a randomized trial comparing 2 types of intervention. Am J Med Qual. 2000;15(5):197–206.
Schectman JM, Schroth WS, Verme D, Voss JD. Randomized controlled trial of education and feedback for implementation of guidelines for acute low back pain. J Gen Intern Med. 2003;18(10):773–80.
Schneider A, Wensing M, Biessecker K, Quinzler R, Kaufmann-Kolle P, Szecsenyi J. Impact of quality circles for improvement of asthma care: results of a randomized controlled trial. J Eval Clin Pract. 2008;14(2):185–90.
Scholes D, Grothaus L, McClure J, Reid R, Fishman P, Sisk C, Lindenbaum JE, Green B, Grafton J, Thompson RS. A randomized trial of strategies to increase chlamydia screening in young women. Prev Med. 2006;43(4):343–50.
Sinclair C, Frankel M. The effect of quality assurance activities on the quality of mental health services. QRB Qual Rev Bull. 1982;8(7):7–15.
Siriwardena AN, Rashid A, Johnson MR, Dewey ME. Cluster randomised controlled trial of an educational outreach visit to improve influenza and pneumococcal immunisation rates in primary care. Br J Gen Pract. 2002;52(482):735–40.
Smith-Bindman R, Chu P, Wang Y, Chung R, Lopez-Solano N, Einstein AJ, Solberg L, Cervantes LF, Nelson TR, Boswell W, Delman BN. Comparison of the effectiveness of single-component and multicomponent interventions for reducing radiation doses in patients undergoing computed tomography: a randomized clinical trial. JAMA Intern Med. 2020;180(5):666–75.
Solomon DH, Katz JN, La Tourette AM, Coblyn JS. Multifaceted intervention to improve rheumatologists’ management of glucocorticoid-induced osteoporosis: a randomized controlled trial. Arthritis Care Res. 2004;51(3):383–7.
Søndergaard J, Hansen DG, Aarslev P, Munck AP. A multifaceted intervention according to the Audit Project Odense method improved secondary prevention of ischemic heart disease: a randomised controlled trial. Fam Pract. 2006;23(2):198–202.
Soumerai SB, McLaughlin TJ, Gurwitz JH, Guadagnoli E, Hauptman PJ, Borbas C, Morris N, McLaughlin B, Gao X, Willison DJ, Asinger R. Effect of local medical opinion leaders on quality of care for acute myocardial infarction: a randomized controlled trial. JAMA. 1998;279(17):1358–63.
Stewardson AJ, Sax H, Gayet-Ageron A, Touveneau S, Longtin Y, Zingg W, Pittet D. Enhanced performance feedback and patient participation to improve hand hygiene compliance of health-care workers in the setting of established multimodal promotion: a single-centre, cluster randomised controlled trial. Lancet Infect Dis. 2016;16(12):1345–55.
Tierney WM, Hui SL, McDonald CJ. Delayed feedback of physician performance versus immediate reminders to perform preventive care: effects on physician compliance. Med Care. 1986;1:659–66.
Trietsch J, van Steenkiste B, Grol R, Winkens B, Ulenkate H, Metsemakers J, van der Weijden T. Effect of audit and feedback with peer review on general practitioners’ prescribing and test ordering performance: a cluster-randomized controlled trial. BMC Fam Pract. 2017;18(1):1–3.
Trietsch J, van der Weijden T, Verstappen W, Janknegt R, Muijrers P, Winkens R, van Steenkiste B, Grol R, Metsemakers J. A cluster randomized controlled trial aimed at implementation of local quality improvement collaboratives to improve prescribing and test ordering performance of general practitioners: study Protocol. Implement Sci. 2009;4(1):1–4.
van der Velden AW, Kuyvenhoven MM, Verheij TJ. Improving antibiotic prescribing quality by an intervention embedded in the primary care practice accreditation: the ARTI4 randomized trial. J Antimicrob Chemother. 2016;71(1):257–63.
van der Weijden TR, Grol RP, Knottnerus JA. Feasibility of a national cholesterol guideline in daily practice. A randomized controlled trial in 20 general practices. Int J Qual Health Care. 1999;11(2):131–7.
Veninga CC, Øv PL, Wahlstrom RO, Muskova M, DenigG P, Berkhof J, Kochen MM, Haaijer-Ruskamp FM, Drug Education Project Group. Evaluating an educational intervention to improve the treatment of asthma in four European countries. Am J Respir Crit Care Med. 1999;160(4):1254–62.
Verstappen WH, van der Weijden T, Sijbrandij J, Smeele I, Hermsen J, Grimshaw J, Grol RP. Effect of a practice-based strategy on test ordering performance of primary care physicians: a randomized trial. JAMA. 2003;289(18):2407–12.
Verstappen WH, van der Weijden T, Dubois WI, Smeele I, Hermsen J, Tan FE, Grol RP. Improving test ordering in primary care: the added value of a small-group quality improvement strategy compared with classic feedback only. Ann Fam Med. 2004;2(6):569–75.
Vingerhoets E, Wensing M, Grol RP. Feedback of patients’ evaluations of general practice care: a randomised trial. BMJ Qual Saf. 2001;10(4):224–8.
Wahlström R, Kounnavong S, Sisounthone B, Phanyanouvong A, Southammavong T, Eriksson B, Tomson G. Effectiveness of feedback for improving case management of malaria, diarrhoea and pneumonia–a randomized controlled trial at provincial hospitals in Lao PDR. Tropical Med Int Health. 2003;8(10):901–9.
Walsh M, Laptook A, Kazzi SN, Engle WA, Yao Q, Rasmussen M, Buchter S, Heldt G, Rhine W, Higgins R, Poole K. A cluster-randomized trial of benchmarking and multimodal quality improvement to improve rates of survival free of bronchopulmonary dysplasia for infants with birth weights of less than 1250 grams. Pediatrics. 2007;119(5):876–90.
Wang Y, Li Z, Zhao X, Wang C, Wang X, Wang D, Liang L, Liu L, Wang C, Li H, Shen H. Effect of a multifaceted quality improvement intervention on hospital personnel adherence to performance measures in patients with acute ischemic stroke in China: a randomized clinical trial. JAMA. 2018;320(3):245–54.
Wang Y, Li Z, Xian Y, Zhao X, Li H, Shen H, Wang C, Liu L, Wang C, Pan Y, Wang D. Rationale and design of a cluster-randomized multifaceted intervention trial to improve stroke care quality in China: the GOLDEN BRIDGE–Acute Ischemic Stroke. Am Heart J. 2015;169(6):767–74.
Wathne JS, Kleppe LK, Harthug S, Blix HS, Nilsen RM, Charani E, Smith I. The effect of antibiotic stewardship interventions with stakeholder involvement in hospital settings: a multicentre, cluster randomized controlled intervention study. Antimicrob Resist Infect Control. 2018;7(1):1–2.
Whidden C, Kayentao K, Liu JX, Lee S, Keita Y, Diakité D, Keita A, Diarra S, Edwards J, Yembrick A, Holeman I. Improving community health worker performance by using a personalised feedback dashboard for supervision: a randomised controlled trial. J Glob Health. 2018;8(2):020418.
Willis TA, Collinson M, Glidewell L, Farrin AJ, Holland M, Meads D, Hulme C, Petty D, Alderson S, Hartley S, Vargas-Palacios A. An adaptable implementation package targeting evidence-based indicators in primary care: a pragmatic cluster-randomised evaluation. PLoS Med. 2020;17(2):e1003045.
Willis TA, Hartley S, Glidewell L, Farrin AJ, Lawton R, McEachan RRC, et al. Action to Support Practices Implement Research Evidence (ASPIRE): protocol for a cluster-randomised evaluation of adaptable implementation packages targeting ‘high impact’ clinical practice recommendations in general practice. Implement Sci. 2016;11(1):1–11.
Glidewell L, Willis TA, Petty D, Lawton R, McEachan RRC, Ingleson E, et al. To what extent can behaviour change techniques be identified within an adaptable implementation package for primary care? A prospective directed content analysis. Implement Sci. 2018;13(32):32.
Wu Y, Li S, Patel A, Li X, Du X, Wu T, Zhao Y, Feng L, Billot L, Peterson ED, Woodward M. Effect of a quality of care improvement initiative in patients with acute coronary syndrome in resource-constrained hospitals in China: a randomized clinical trial. JAMA cardiology. 2019;4(5):418–27.
Li S, Wu Y, Du X, Li X, Patel A, Peterson ED, Turnbull F, Lo S, Billot L, Laba T, Gao R. Rational and design of a stepped-wedge cluster randomized trial evaluating quality improvement initiative for reducing cardiovascular events among patients with acute coronary syndromes in resource-constrained hospitals in China. Am Heart J. 2015;169(3):349–55.
Fox RD, Mazmanian PE, Putnam RW. Changing and learning in the lives of physicians. New York: Praeger; 1989.
Rogers EM. Diffusion of innovations. 3rd ed. New York: Free Press; 1983.
Bandura A. Self-efficacy: toward a unifying theory of behavior change. Psychol Rev. 1977;84:191–215.
Bandura A. Social foundation and thought of action: a social cognitive theory. New York: Prentice Hall; 1986.
Waltz TJ, Powell BJ, Matthieu MM, Damschroder LJ, Chinman MJ, Smith JL, Proctor EK, Kirchner JE. Use of concept mapping to characterize relationships among implementation strategies and assess their feasibility and importance: results from the Expert Recommendations for Implementing Change (ERIC) study. Implement Sci. 2015;10:1–8.
Proctor E, Silmere H, Raghavan R, Hovmand P, Aarons G, Bunger A, Griffey R, Hensley M. Outcomes for implementation research: conceptual distinctions, measurement challenges, and research agenda. Adm Policy Ment Health. 2011;38:65–76.
Collins LM, Murphy SA, Strecher V. The multiphase optimization strategy (MOST) and the sequential multiple assignment randomized trial (SMART): new methods for more potent eHealth interventions. Am J Prev Med. 2007;32(5):S112–8.
McHugh S, Presseau J, Luecking CT, Powell BJ. Examining the complementarity between the ERIC compilation of implementation strategies and the behaviour change technique taxonomy: a qualitative analysis. Implement Sci. 2022;17(1):1–23.
Presseau J, McCleary N, Lorencatto F, Patey AM, Grimshaw JM, Francis JJ. Action, actor, context, target, time (AACTT): a framework for specifying behaviour. Implement Sci. 2019;14:1–3.
Michie S, Richardson M, Johnston M, Abraham C, Francis J, Hardeman W, Eccles MP, Cane J, Wood CE. The behavior change technique taxonomy (v1) of 93 hierarchically clustered techniques: building an international consensus for the reporting of behavior change interventions. Ann Behav Med. 2013;46(1):81–95.
Atkins L, Francis J, Islam R, O’Connor D, Patey A, Ivers N, Foy R, Duncan EM, Colquhoun H, Grimshaw JM, Lawton R. A guide to using the Theoretical Domains Framework of behaviour change to investigate implementation problems. Implement Sci. 2017;12(1):1–8.
Funding
Not applicable.
Author information
Authors and Affiliations
Contributions
MS conceived the study and worked with SA, ZRY, MQ, LG, NI to develop the protocol. OT, LR, KC, MS, SA, ZRY, MQ, LG were involved in data extraction. MS and SA undertook the analysis, MQ produced the Sankey chart. All authors, contributed to the interpretation of the findings and production of the manuscript.
Corresponding author
Ethics declarations
Ethics approval and consent to participate
Not applicable. This article does not contain any studies with human participants or animals performed by any of the authors.
Consent for publication
Not applicable.
Competing interests
MS, MQ and SA have previously developed feedback facilitation interventions, although not ones included within the current review.
Additional information
Publisher’s Note
Springer Nature remains neutral with regard to jurisdictional claims in published maps and institutional affiliations.
Supplementary Information
Rights and permissions
Open Access This article is licensed under a Creative Commons Attribution 4.0 International License, which permits use, sharing, adaptation, distribution and reproduction in any medium or format, as long as you give appropriate credit to the original author(s) and the source, provide a link to the Creative Commons licence, and indicate if changes were made. The images or other third party material in this article are included in the article's Creative Commons licence, unless indicated otherwise in a credit line to the material. If material is not included in the article's Creative Commons licence and your intended use is not permitted by statutory regulation or exceeds the permitted use, you will need to obtain permission directly from the copyright holder. To view a copy of this licence, visit http://creativecommons.org/licenses/by/4.0/. The Creative Commons Public Domain Dedication waiver (http://creativecommons.org/publicdomain/zero/1.0/) applies to the data made available in this article, unless otherwise stated in a credit line to the data.
About this article

Cite this article
Sykes, M., Rosenberg-Yunger, Z.R.S., Quigley, M. et al. Exploring the content and delivery of feedback facilitation co-interventions: a systematic review. Implementation Sci 19, 37 (2024). https://doi.org/10.1186/s13012-024-01365-9
Received:
Accepted:
Published:
DOI: https://doi.org/10.1186/s13012-024-01365-9