
Abstract
Background
Hospitals are the biggest consumers of health system budgets and hence measuring hospital performance by quantitative or qualitative accessible and reliable indicators is crucial. This review aimed to categorize and present a set of indicators for evaluating overall hospital performance.
Methods
We conducted a literature search across three databases, i.e., PubMed, Scopus, and Web of Science, using possible keyword combinations. We included studies that explored hospital performance evaluation indicators from different dimensions.
Results
We included 91 English language studies published in the past 10 years. In total, 1161 indicators were extracted from the included studies. We classified the extracted indicators into 3 categories, 14 subcategories, 21 performance dimensions, and 110 main indicators. Finally, we presented a comprehensive set of indicators with regard to different performance dimensions and classified them based on what they indicate in the production process, i.e., input, process, output, outcome and impact.
Conclusion
The findings provide a comprehensive set of indicators at different levels that can be used for hospital performance evaluation. Future studies can be conducted to validate and apply these indicators in different contexts. It seems that, depending on the specific conditions of each country, an appropriate set of indicators can be selected from this comprehensive list of indicators for use in the performance evaluation of hospitals in different settings.
Background
Healthcare is complex [1] and a key sector [2] that is now globally faced with problems of rising costs, lack of service efficiency, competition, and equity as well as responsiveness to users [3]. One estimate by the WHO has shown a yearly waste of approximately 20–40% of total healthcare resources because of inefficiency [4]. European countries have spent on average 9.6% of their gross domestic product (GDP) on healthcare in 2017 and 9.92% in 2019. Germany, France, and Sweden reported the highest healthcare expenditures in Europe in 2018 (between 10.9% and 11.5% of GDP) [5]. In the U.S., healthcare spending consumes 18% of the GDP, which is likely to eclipse $6 trillion by 2027 [6].
Hospitals, as the biggest consumers of health system budgets [7], are the major part of the health system [8]. In many countries 50–80% of the health sector budget is dedicated to hospitals [8, 9]. As a result, hospital performance analysis is becoming a routine task for every hospital manager. On the one hand, hospital managers worldwide are faced with difficult decisions regarding cost reduction, increasing service efficiency, and equity [10]. On the other hand, measuring hospital efficiency is an issue of interest among researchers because patients demand high-quality care at lower expenses [11].
To address the above mentioned need to measure hospital performance, implementing an appropriate hospital performance evaluation system is crucial in any hospital. In doing so, hospital administrators use various tools to analyse and monitor hospital activities [1], which need well-defined objectives, standards and quantitative indicators [12]. The latter are used to evaluate care provided to patients both quantitatively and qualitatively and are often related to input, output, processes, and outcomes. These indicators can be used for continuous quality improvement by monitoring, benchmarking, and prioritizing activities [13]. These parameters are developed to improve health outcomes and to provide comparative information for monitoring and managing and formulating policy objectives within and across health services [12]. Studies thus far have used their own set of indicators while evaluating hospital performance, which could be context dependent. In addition, those studies have mostly used a limited set of indicators that focus on few dimensions (2–6 dimensions) of hospital performance [14,15,16,17,18].
Therefore, comprehensive knowledge of potential indicators that can be used for hospital performance evaluation is necessary. It would help choose appropriate indicators when evaluating hospital performance in different contexts. It would also help researchers extend the range of analysis to evaluate performance from a wider perspective by considering more dimensions of performance. Although performance is a very commonly used term, it has several definitions [19, 20], yet, it is often misunderstood [21]. Therefore, some researchers have expressed confusion about the related terms and considered them interchangeable. These terms are effectiveness, efficiency, productivity, quality, flexibility, creativity, sustainability, evaluation, and piloting [21,22,23]. Thus, this scoping review aimed to categorize and present a comprehensive set of indicators that can be used as a suitable set for hospital performance evaluation at any needed level of analysis, i.e., clinical, para-clinical, logistical, or departmental, and relate those indicators to the appropriate performance dimensions. The uniqueness of this paper is that it provides its readers with a comprehensive collection of indicators that have been used in different performance analysis studies.
Materials and methods
We conducted a scoping review of a body of literature. The scoping review can be of particular use when the topic has not yet been extensively reviewed or has a complex or heterogeneous nature. This type of review is commonly undertaken to examine the extent, range, and nature of research activity in a topic area; determine the value and potential scope and cost of undertaking a full systematic review; summarize and disseminate research findings; and identify research gaps in the existing literature. As a scoping review provides a rigorous and transparent method for mapping areas of research, it can be used as a standalone project or as a preliminary step to a systematic review [24]. While a systematic review (qualitative or quantitative) usually addresses a narrow topic/scope and is a method for integrating or comparing findings from previous studies [25].
In our study, we used the Preferred Reporting Items for Systematic reviews and Meta-Analyses extension for Scoping Reviews (PRISMA-ScR) Checklist following the methods outlined by Arksey and O’Malley [26] and Tricco [27]. A systematic search for published and English-language literature on hospital performance evaluation models was conducted, using three databases, i.e., PubMed, Scopus, and Web of Science, from 2013 to January 2023. Initially, the identified keywords were refined and validated by a team of experts. Then, a combination of vocabularies was identified by the authors through a brainstorming process. The search strategy was formulated using Boolean operators. The title and abstract of the formulas were searched in the online databases. The search query for each database is presented in Table 1.
In the screening process, relevant references related to hospital performance evaluation were screened and abstracted into researcher-developed Microsoft® Excel forms by dual independent reviewers and conflicting information was provided by other reviewers.
The inclusion criteria were as follows: focused only on the hospital setting, available full text and written in English. We excluded studies that focused on health organization indicators, not specifically on hospital indicators; articles without appropriate data (only focused on models and not indicators; or qualitative checklist questionnaires); and articles that focused only on clinical or disease-related indicators, not hospital performance dimensions, and provided very general items as indicators, not the domains of the indicators themselves. Then, a PRISMA-ScR Checklist was used to improve transparency in our review [28].
To extract the data, researcher-developed Microsoft® Excel forms (data tables) were designed. The following data were subsequently extracted into Microsoft®Excel for synthesis and evaluation: title, author, article year, country, indicator category, study environment (number of hospitals studied), study time frame, indicator name, number of indicators, indicator level (hospital level, department level), evaluation perspective (performance, productivity, efficiency, effectiveness, quality, cost, safety, satisfaction, etc.), study type (quantitative or qualitative), indicator subtype (input (structure), process, output (result), outcome and impact), and other explanations. To create a descriptive summary of the results that address the objectives of this scoping review, numerical summarization was also used.
The purpose of creating the main category and the evaluation perspective section was to develop them and create new categories, which focused on the type of indicators related to the performance term. For example, in the “Category” section, the names of the departments or wards of the hospital (such as hospital laboratories, pharmacies, clinical departments, and warehouses) and in the “Evaluation perspective” section, various terms related to the evaluation of hospital performance were extracted. These two types were used after extracting their information under the title “performance dimension”.
The indicators’ levels were collected to determine the level of performance evaluation with the relevant index. Some indicators were used to evaluate the performance of the entire hospital, some were used to evaluate the performance of hospital departments, and some were used to evaluate the performance at the level of a specific project. For example, several indicators (such as bed occupancy ratio, length of stay, and waiting time) were used to evaluate the performance of the entire hospital, and other indicators (such as laboratory department indicators, energy consumption indicators, and neonatal department indicators) were used only to measure the performance of specific departments. This sections were used under the title “category”. The “category” and “indicator’s name” sections were defined according to the results of the “subcategory” section.
The subtypes of indicators (input (structure), process, output(result), outcome and impact) were defined based on the chain model, and each of the selected indicators was linked to it (Appendix 1). As a result of the chain model, inputs were used to carry out activities, activities led to the delivery of services or products (outputs). The outputs started to bring about change (outcomes), and eventually, this (hopefully) contributed to the impact [29]. The classification of the set of input, process, output, outcome and impact indicators was such that readers could access these categories if necessary according to their chosen evaluation models. The term was used under the title “Indicators by types”.
The type of study was considered quantitative or qualitative for determining whether an indicator was able to perform calculations. In this way, readers can choose articles that use quantitative or qualitative indicators to evaluate hospital performance.
Results
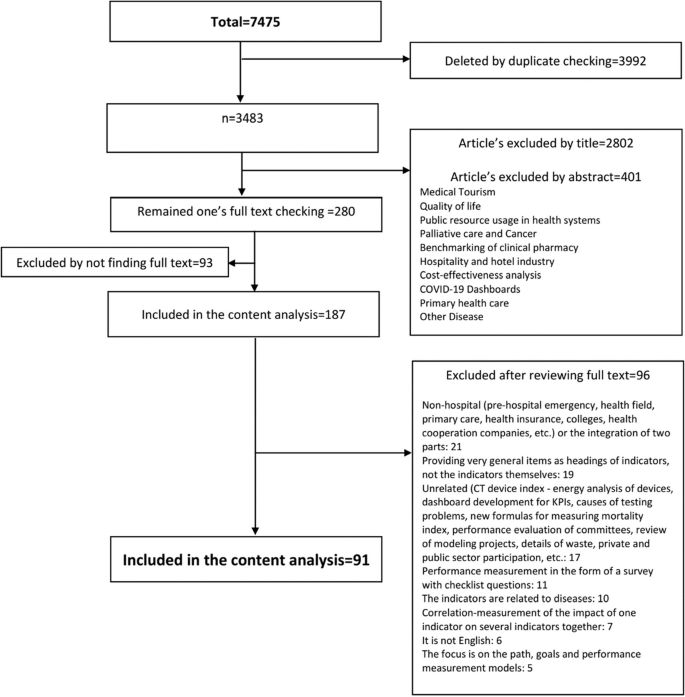
We included 91 full-text studies (out of 7475) in English published between 2013 and January 2023 (Fig. 1), approximately 40% of which were published between 2020 and 2023. More than 20% of the retrieved studies were conducted in Iran and USA.
Study selection and data abstraction
Study characteristic
As shown in Table 2, in 85% of the reviewed studies, a number of hospitals (1 to 3828 hospitals, 13,221 hospitals in total) were evaluated. More than 90% of the studies used a quantitative approach. In more than 70% of the studies, hospital evaluation occurred at the department level, which can also be divided into three levels: administrative, clinical ward, and paramedical department. In addition, the administrative departments consist of 13 departments, including financial management [48, 55, 61, 67, 68, 80, 83, 109, 113], supply chain management and warehouse [15, 43, 84], value-based purchasing [33, 85], human resource management [97, 101], medical equipment [32, 87], health information management department [90], information systems [106], nutritional assessment [93], energy management [30, 45, 92], facility management [52, 53], building sustainability and resilience [35], research activities [44], and education [107].
The clinical wards consisted of 8 wards, namely, emergency departments (EDs) [16, 39, 56, 57, 69, 70, 89], surgery departments [58, 62, 63, 91, 102], intensive care units (ICUs) [47, 64, 65], operating rooms (ORs) [38, 88, 108], surgical intensive care units (SICUs) [111], obstetrics and gynecology department [59], neonatal intensive care units (NICUs) [74, 103] and quality of care [18, 31, 40, 50, 72, 92, 95, 112] indicators. The paramedical departments consisted of 3 departments, pharmacy [60, 76, 98], laboratory and blood bank [37, 42, 43, 49], and outpatient assessment [86] indicators.
With regard to data categorization, firstly, a total of 1204 indicators in 91 studies were extracted and after detailed examination, 43 indices (such as hospital ownership, level of care, admission process, and personal discipline) were removed due to their generality and impossibility of calculation in the hospital environment. Then, 1161 performance indicators were entered in this research and were categorized based on the performance criteria (more details about the indicators can be found in Appendix 1). Secondly, 145 functional dimensions, including divisions based on different departments and units of the hospital, were defined according to several focus group discussions with 5 health experts. Then, re-categorization and functional summarization were performed, after which 21 performance dimensions were finalized.
As shown in Table 4, the 21 performance dimensions were divided into three parts: category, subcategory, and related indicators. Additionally, according to the hospital levels, there were three categories: ‘organizational management’, ‘clinical management’, and ‘administrative management’. Then, according to the type of indicators, fifteen subcategories were defined for the 110 selected main indicators.
Performance dimensions
The ‘productivity’ dimension focuses on indicators reflecting the macro-performance of the hospital, considering that this index is more effective and efficient. The ‘efficiency’ dimension focuses on general performance indicators for the optimal use of resources to create optimal output in the hospital. The ‘effectiveness’ dimension is a general performance indicator with an outcome view. The ‘speed’ dimension focuses on the indicators that show attention to the service delivery time and the speed of the procedures. The ‘development’ dimension focuses on matters related to employees’ and students’ training and related training courses. In terms of ‘safety’ dimension, there were issues related to patient safety, unwanted and harmful events, and hospital infections.
The “quality of work life” dimension emphasizes matters related to personnel volume and work conditions. The ‘quality’ dimension is related to the quality of service provided in different parts of the hospital and possible complications in improving the quality of services. The ‘satisfaction’ dimension focuses on the satisfaction of patients, employees, and their complaints. The ‘innovation’ dimension relates to the research process and its output. The ‘appropriateness’ dimension involves proper service from clinical departments, pharmaceutical services, and patient treatment. The ‘evaluation’ dimension focuses on the indicators related to the assessment scores of the para-clinical departments of the hospital.
The ‘profitability’ dimension focuses on the overall output indicators for income and profitability. The ‘cost’ dimension focuses on indicators related to general expenditures and the average cost per bed and patient and budgeting. The ‘economy’ dimension is related to financial rates and their indicators. The ‘coherence’ dimension emphasizes the indicators related to the continuity of the service delivery process. The ‘patient-centeredness’ dimension focuses on the indicators related to the patient’s experience of the facility, environment, treatment processes, communications, and relevant support for the patient. The ‘equity’ dimension studies indicators related to social and financial justice and life expectancy. The ‘relationship’ dimension evaluates the process of consultations and discussions required during the patients’ care provided by the treatment team. The ‘sustainability’ dimension focuses on indicators related to energy standards. The ‘flexibility’ dimension focuses on the hospital’s response to the crisis.
According to Table 4, most studies focused on ‘efficiency’, ‘productivity’, ‘safety’ and ‘effectiveness’ as performance dimensions in 54, 53, 38 and 37 studies, respectively (40–70% of studies). In the ‘efficiency’ subcategory, resource management, supportive unit assessment, and human resource management indicators were the first to third most common indicators used in 26, 23 and 22 studies, respectively (approximately 25% of the studies).
In addition, for the ‘efficiency’ dimension, ‘medical staff numbers’, ‘emergency department bed numbers’, and ‘nonmedical staff numbers’ were reported in 16, 13, and 11 studies, respectively (between 20 and 30% of the studies). For the ‘productivity’ subcategory, ‘bed utilization rate’ and ‘service delivery and treatment’ were reported in 50% and 20% of the studies, respectively (46 and 19 out of 91).
Additionally, for the ‘productivity’ dimension, the ‘length of stay’ indicator was used more than others and reported in approximately 80% of the studies (43 out of 53), followed by the ‘bed occupancy rate’ in approximately 40% of the studies (21 out of 53). The ‘bed turnover ratio’ and ‘hospitalization rate’ were also reported in 12 studies. Furthermore, for ‘safety’ dimensions, all indicators were in the ‘patient safety’ subcategory, which has been reported in 38 studies, and ‘complications’, ‘accidents or adverse events’, and ‘incidents or errors rates’ were the most concentrated indicators by researchers in 13, 12, and 11 studies, respectively. The performance dimension of ‘effectiveness’ was presented in 37 studies (40%), with only two indicators, ‘mortality rate’ in 29 studies and ‘readmission rate’ in 23 studies.
Performance categories
Considering the three categories shown in Table 4, ‘organizational management’ indicators were more commonly used among the other two categories (‘clinical’ and ‘administrative’) and were present in more than 85% of the studies (78 out of 91). Two categories, ‘clinical management’ and ‘administrative management’, were reported in 62 and 51 studies, respectively.
Performance subcategories
Considering the 14 subcategories shown in Table 4, both the ‘bed utilization rate’ and ‘patient safety’ indicators were mentioned in 46 studies and were more common among the other subcategories. The second most common indicator of the ‘financial management’ subcategory was reported in 38 studies. At the third level, both the ‘human resource management’ and ‘time management’ indicators were presented in 31 studies. The ‘paramedical’ subcategory indicators were presented in less than 10% of the studies [60, 96,97,98, 106, 113].
Performance indicators
According to the indicator columns in Table 3, the most used indicators in reviewed studies were the length of stay, mortality rate, and readmission rate in 47%, 32%, and 25% of studies, respectively. Bed occupancy rate and non-personnel costs were reported in 23% of studies. Additionally, among the 110 indicators, 16 indicators, namely, the lab cancellation rate, exam-physician ratios, number of coded diagnoses, number of medical records, laboratory sample/report intervals, medical information request time, safety standards in the archives, nutritional risk screening, imaging quality control failures, errors in medical reports, average impact factor, nutritional measures, laboratory scoring, imaging inspection, discharge process and emergency response rate, were reported in less than 1% of the studies.
The classification of the indicators in Table 4 was performed based on the chain model, which included the input, process, output, outcome and impact. The assignment of the indicators to each category was performed according to the experts’ opinions. For instance, the number of publications by academic member of an academic hospital and the average impact factor of those publications were considered outcome indicators. As depicted in the Table 4, most studies (80%) focused more on output indicators. Additionally, fifteen studies focused on introducing and extracting some of the input, process, output, outcome and impact indicators; among those, only one study [96] has examined the input, process, output and impact indicators simultaneously.
Additionally, in approximately 42% (36 out of 91) of the studies, the indicators’ definitions, formulas, or descriptions have been illustrated, while less than 10% of the studies have defined measuring units, standard or benchmark units for all studied indicators [15, 43, 45, 51, 52, 57, 67].
Overall, nine studies related to hospital performance evaluation were conducted using systematic review methodologies (five systematic reviews [16, 29, 30, 56, 113], two literature reviews [79, 80], one narrative review [98] and one brief review [92]). Most of these studies focused on extracting performance indicators from one or more hospital departments (e.g., the emergency department) [16, 56], hospital laboratory and radiology information systems [106], supply chain performance [29], resources and financial results and activity [113], hospital water consumption [30], and the pharmaceutical sector [98]. Other reviews included a three-step process to review, evaluate and rank these hospital indicators in a systematic approach [16], or to evaluate performance indicator models to create an interactive network and visualize the causal relationships between performance indicators [79]; moreover, some have focused on the importance of indicators to ensure adequate coverage of the relevant areas of health care services to be evaluated [92].
Only one scoping review aimed to identify current assessments of hospital performance and compared quality measures from each method in the context of the six qualitative domains of STEEEP (safety, timeliness, effectiveness, efficiency, equity, and patient-centeredness) of the Institute of Medicine (IOM) in accordance with Donabedian’s framework and formulating policy recommendations [115].
In addition, 21 studies divided performance indicators into 2 to 6 dimensions of performance. Also, the reviewed studies included 2–40 indicators in zero [29, 30, 98] to 6 domains [34]. Moreover, none of the studies have tried to comprehensively summarize and categorize the performance indicators in several categories, focusing on all the indicators reflecting the performance of the entire hospital organization, or the indicators of administrative units or clinical departments.
Discussion
In this scoping review, a unique set of hospital performance evaluation indicators related to the various performance dimensions was categorized from 91 studies over the past ten years.
Similarly, in a study, 19 performance dimensions, 32 sub-dimensions, and 138 indicators were extracted from only six studies. Those dimensions were described by all studies included in the review, but only three studies specified the relevant indicators, and the list provided for all possible indicators was not comprehensive. Also, despite current review, there was no classification of indicators based on the hospital levels: managerial, clinical, or organizational levels [116]. Another study has similarly investigated the performance evaluation indicators of the hospital in such a way that among 42 studies, 111 indicators were presented in the four categories: input, output, outcome, and impact. But, there was no classification of indicators based on performance dimensions and hospital levels [117].
In this study, the importance of categorized indicators, for the first time to our knowledge, was determined based on their frequency of use in the published literature (Appendix 2). The ‘Organizational management’ indicators were the most common compared with the other two categories (‘clinical’ and ‘administrative’). It could be because of the fact that the indicators such as ‘bed occupancy rate’, ‘average length of stay’, ‘mortality rate’, ‘hospital infection rate’, and ‘patient safety’ are easier to be registered in hospital software compared to other indicators, and also they better reflect the overall performance of hospital. Thus, researchers are more interested in using these indicators.
Considering 14 subcategories, indicators related to three subcategories i.e. bed utilization, patient safety and financial management are the most frequent used indicators for hospital performance evaluation. It reflects the need of hospital managers to increase the profitability of hospital in one hand, and to control cost on the other hand. As a results, researchers have paid special attention to ‘cost income’, ‘profitability’, ‘economic’, etc., as indicators for evaluating hospital performance.
When considering indicators by type, more studies have focused on output indicators, while input indicators were the least common used. This might be because of the fact that at hospital level, it is difficult for managers to change those inputs such as ‘beds’, ‘human resources’, ‘equipment and facilities’. In addition, due to the complexity of interdepartmental relationships in hospitals, process indicators seemed to provide more variety for analysis than input indicators, so they were more often used. As mentioned above, output indicators were the most used indicators for hospital performance evaluation due to their ease of calculation and interpretation.
The main purpose of this paper was to identify a comprehensive set of indicators that can be used to evaluate hospital performance in various hospital settings by being distilled into a smaller and more related set of indicators for every hospital or department setting. future studies could be designed to validate each set of indicators in any specific context. In addition, they could investigate the relationship between the indicators and their outcomes of interest and the performance dimension each could address. This will enable hospital managers to build their own set of indicators for performance evaluation both at organization or at department level. Also it should be mentioned that.
Although some previous studies have provided definitions for each indicator and determined the standard criteria for them, this was not done in this study because the focus of this study was to provide a collection of all the indicators used in hospital performance evaluation, which resulted in the identification of more than a thousand indicators without limiting to specific country or context. So while preparing a smaller set of indicators, specific conditions of each country, such as the type of health system and its policy, the type of financing system, and the structure of services, should be taken into account to select appropriate indicators.
In addition, although it is important to examine the scope of each article to compare the list of indicators and the relationships between the dimensions of the hospital in terms of size and type and between the number and type of selected indicators, this was considered beyond the scope of this review due to the high number of indicators, which made the abovementioned investigations impossible. Future studies could do that while working with a smaller set of indicators.
Conclusion
This review aimed to categorize and present a comprehensive set of indicators for evaluating overall hospital performance in a systematic way. 1161 hospital performance indicators were drawn from 91 studies over the past ten years. They then were summarized into 110 main indicators, and categorized into three categories: 14 subcategories, and 21 performance dimensions This scoping review also highlighted the most frequent used indicators in performance evaluation studies which could reflect their importance for that purpose. The results of this review help hospital managers to build their own set of indicators for performance evaluation both at organization or at department level with regard to various performance dimensions.
As the results of this review was not limited to any specific country or context, specific conditions of each country, such as the type of health system and its policy, the type of financing system, and the structure of services, should be taken into account while selecting appropriate indicators as a smaller set of indicators for hospital performance evaluation in specific context.
Availability of data and materials
The datasets used and/or analyzed during the current study are available from the corresponding author on reasonable request.
Abbreviations
- GDP:
-
Gross domestic product
- PRISMA-ScR:
-
Preferred Reporting Items for Systematic reviews and Meta-Analyses extension for Scoping Reviews
- ED:
-
Emergency departments
- ICU:
-
Intensive care unit
- OR:
-
Operating room
- SICU:
-
Surgical intensive care unit
- NICU:
-
Neonatal intensive care unit
- RR:
-
Readmission rate
- QC:
-
Quality Control
- MUE:
-
Medication use evaluation
- STEEEP:
-
safety, timeliness, effectiveness, efficiency, equity, and patient-centeredness
- IOM:
-
Institute of Medicine
References
Abdullah A, Ahmad S, Athar MA, Rajpoot N, Talib F. Healthcare performance management using integrated FUCOM-MARCOS approach: the case of India. Int J Health Plann Manage. 2022;37(5):2635–68.
Pestana M, Pereira R, Moro S. Improving health care management in hospitals through a productivity dashboard. J Med Syst. 2020;44(4):87.
Amos D. A practical framework for performance measurement of facilities management services in developing countries’ public hospitals. J Facil Manag. 2022;20(5):713–31.
Ahmed S, Hasan MZ, MacLennan M, Dorin F, Ahmed MW, Hasan MM, et al. Measuring the efficiency of health systems in Asia: a data envelopment analysis. BMJ Open. 2019;9(3):e022155.
Mitkova Z, Doneva M, Gerasimov N, Tachkov K, Dimitrova M, Kamusheva M, et al. Analysis of healthcare expenditures in Bulgaria. Healthc. 2022;10(2):274.
Patrinely JR, Walker SH, Glassman GE, Davis MJ, Abu-Ghname A, Khan U, et al. The importance of financial metrics in physician funding and performance evaluation. Plast Reconstr Surg. 2021;147:1213–8.
Buathong S, Bangchokdee S. The use of the performance measures in Thai public hospitals. ASIAN Rev Acc. 2017;25(4):472–85.
Imani A, Alibabayee R, Golestani M, Dalal K. Key indicators affecting hospital efficiency: a systematic review. Front Public Heal. 2022;10:830102.
Mahdiyan S, Dehghani A, Tafti AD, Pakdaman M, Askari R. Hospitals’ efficiency in Iran: a systematic review and meta-analysis. J Educ Health Promot. 2019;8(1):126.
Amos D, Musa ZN, Au-Yong CP. Performance measurement of facilities management services in Ghana’s public hospitals. Build Res Inf. 2020;48(2):218–38.
Feibert DC, Andersen B, Jacobsen P. Benchmarking healthcare logistics processes–a comparative case study of Danish and US hospitals. Total Qual Manag Bus Excell. 2019;30(1–2):108–34.
Gün I, Yilmaz F, Şenel IK. Efficiency analysis of health systems in world bank countries. Arch Heal Sci Res. 2021;8(2):147–52.
Breyer JZ, Giacomazzi J, Kuhmmer R, Lima KM, Hammes LS, Ribeiro RA, et al. Hospital quality indicators: a systematic review. Int J Health Care Qual Assur. 2019;32(2):474–87.
Regragui H, Sefiani N, Azzouzi H. Improving performance through measurement: the application of BSC and AHP in healthcare organization. In: Equipe De Recherche, Ingénierie, Innovation Et Management Des Systèmes Industriels, Université Abdelmalek Saadi. Tanger, Morocco: Institute of Electrical and Electronics Engineers Inc; 2018. p. 51–6.
Ghozali MT, Latifah DN, Darayani A. Analysis of Drug Supply Management of the Pharmacy Warehouse of Prof. Dr. Soerojo Mental Health Hospital, Magelang, Indonesia. Clin Schizophr Relat Psychoses. 2021;15:1–6.
Etu EE, Monplaisir L, Aguwa C, Arslanturk S, Masoud S, Markevych I, et al. Identifying indicators influencing emergency department performance during a medical surge: a consensus-based modified fuzzy Delphi approach. PLoS ONE. 2022;17(4 April):e0265101.
Lin C-Y, Shih F-C, Ho Y-H. Applying the balanced scorecard to build service performance measurements of medical institutions: An AHP-DEMATEL approach. Int J Environ Res Public Health. 2023;20(2):1022.
Backman C, Vanderloo S, Forster AJ. Measuring and improving quality in university hospitals in Canada: the collaborative for excellence in healthcare quality. Health Policy (New York). 2016;120(9):982–6.
Ghalem Â, Okar C, Chroqui R, Semma E. Performance: A concept to define. In: Performance: A concept to define. LOGISTIQUA 2016; 2016. p. 1–13.
Sonnentag S, Frese M. Performance Concepts and Performance Theory. In 2005. p. 1–25.
Tangen S. Demystifying productivity and performance. Int J Prod Perform Manag. 2005;54:34–46.
Elena-Iuliana I, Maria C. Organizational Performance – A Concept That Self-Seeks To Find Itself. Ann - Econ Ser Constantin Brancusi Univ Fac Econ. 2016;4(4):179–83.
Riratanaphong C, Van der Voordt T, Sarasoja A. Performance Measurement in the context of CREM and FM. In: Per Anker Jensen, Theo Van der Voordt CC, editor. The added value of facilities management: concepts, findings and perspectives. Lyngby Denmark: Polyteknisk Forlag; 2012. p. 1–21.
Pham M, Rajić A, Greig J, Sargeant J, Papadopoulos A, Mcewen S. A scoping review of scoping reviews: advancing the approach and enhancing the consistency. Res Synth Methods. 2014;5:371–85.
Chaney M. So you want to write a narrative review article? J Cardiothorac Vasc Anesth. 2021;35:3045–9.
Arksey H, O’Malley L. Scoping studies: towards a methodological framework. Int J Soc Res Methodol. 2005;8(1):19–32.
Tricco AC, Lillie E, Zarin W, O’Brien KK, Colquhoun H, Levac D, et al. PRISMA extension for scoping reviews (PRISMA-ScR): Checklist and explanation. Ann Intern Med. 2018;169(7):467–73.
Tricco A, Lillie E, Zarin W, O’Brien K, Colquhoun H, Levac D, et al. PRISMA extension for scoping reviews (PRISMA-ScR): Checklist and explanation. Ann Intern Med. 2018;169(7):467–73.
Dolatabad AH, Mahdiraji HA, Babgohari AZ, Garza-Reyes JA, Ai A. Analyzing the key performance indicators of circular supply chains by hybrid fuzzy cognitive mapping and Fuzzy DEMATEL: evidence from healthcare sector. Environ Dev Sustain. 2022;1–27.
Batista KJM, da Silva SR, Rabbani ERK, Zlatar T. Systematic review of indicators for the assessment of water consumption rates at hospitals. Water Supply. 2020;20(2):373–82.
Beta G, Role D, Berloviene D, Balkena Z. PATIENTS’ SATISFICATION AS THE QUALITY INDICATOR OF NURSING. In: Lubkina V, Kaupuzs A, Znotina D, editors. SOCIETY INTEGRATION EDUCATION, VOL VI: PUBLIC HEALTH AND SPORT, RESEARCHES IN ECONOMICS AND MANAGEMENT FOR SUSTAINABLE EDUCATION. 2020. p. 79–88.
Bhardwaj P, Joshi NK, Singh P, Suthar P, Joshi V, Jain YK, et al. Competence-based assessment of biomedical equipment management and maintenance system (e-Upkaran) using benefit evaluation framework. CUREUS J Med Sci. 2022;14(10):e30579.
Cheon O, Song M, Mccrea AM, Meier KJ. Health care in America: the relationship between subjective and objective assessments of hospitals. Int PUBLIC Manag J. 2021;24(5):596–622.
Craig KJT, McKillop MM, Huang HT, George J, Punwani ES, Rhee KB. US hospital performance methodologies: a scoping review to identify opportunities for crossing the quality chasm. BMC Health Serv Res. 2020;20(1):640.
Cristiano S, Ulgiati S, Gonella F. Systemic sustainability and resilience assessment of health systems, addressing global societal priorities: Learnings from a top nonprofit hospital in a bioclimatic building in Africa. Renew Sustain ENERGY Rev. 2021;141:110765.
Dadi D, Introna V, Santolamazza A, Salvio M, Martini C, Pastura T, et al. Private Hospital Energy Performance Benchmarking Using Energy Audit Data: An Italian Case Study. Energies. 2022;15(3):1–16.
Dawande PP, Wankhade RS, Akhtar FI, Noman O. Turnaround time: an efficacy measure for medical laboratories. CUREUS J Med Sci. 2022;14(9):e28824.
De Sousa LR, Mazzo A, De Almeida ACF, Tonello C, Lourençone LFM. Evaluation of quality indicators in the management of an operating room at a tertiary-level hospital. Med. 2022;55(1):1–8.
Drynda S, Schindler W, Slagman A, Pollmanns J, Horenkamp-Sonntag D, Schirrmeister W, et al. Evaluation of outcome relevance of quality indicators in the emergency department (ENQuIRE): study protocol for a prospective multicentre cohort study. BMJ Open. 2020;10(9):e038776.
Fekri O, Manukyan E, Klazinga N. Appropriateness, effectiveness and safety of care delivered in Canadian hospitals: a longitudinal assessment on the utility of publicly reported performance trend data between 2012–2013 and 2016–2017. BMJ Open. 2020;10(6):e035447.
Galloa AJO, Ramírez CA. Evaluating Colombian public hospitals productivity during 2004–2015. A luenberger-indicator approach. Rev Gerenc Y Polit Salud. 2020;19:1–23.
Gebreyes M, Sisay A, Tegen D, Asnake A, Wolde M. Evaluation of laboratory performance, associated factors and staff awareness towards achieving turnaround time in tertiary hospitals, Ethiopia. Ethiop J Health Sci. 2020;30(5):767–76.
Gnanaraj J, Kulkarni RG, Sahoo D, Abhishekh B. Assessment of the Key Performance Indicator Proposed by NABH in the Blood Centre of a Tertiary Health Care Hospital in Southern India. Indian J Hematol Blood Transfus. 2022;39:308–16.
Horenberg F, Lungu DA, Nuti S. Measuring research in the big data era: the evolution of performance measurement systems in the Italian teaching hospitals. Health Policy (New York). 2020;124(12):1387–94.
Hwang DK, Cho J, Moon J. Feasibility study on energy audit and data driven analysis procedure for building energy efficiency: bench-marking in Korean hospital buildings. Energies. 2019;14(15):3006.
Jaskova D. Efficiency of management, processes in a private hospital. Entrep Sustain Issues. 2021;9(1):436–46.
Jebraeily M, Valizadeh MA, Rahimi B, Saeidi S. The development of a clinical dashboard for monitoring of key performance indicators in ICU. J Iran Med Counc. 2022;5(2):308–17.
Kang Y, Kim M, Jung K. The equity of health care spending in South Korea: testing the impact of publicness. Int J Environ Res Public Health. 2020;17(5):1775.
Abou Tarieh RR, Zayyat R, Naoufal RN, Samaha HR. A case study exploring the impact of JCI standards implementation on staff productivity and motivation at the laboratory and blood bank. Heal Sci Rep. 2022;5(1):e497.
Kadoic N, Simic D, Mesaric J, Redep NB. Measuring quality of public hospitals in croatia using a multi-criteria Approach. Int J Environ Res Public Health. 2021;18:19.
Khalilabad T, Amir N, Asl P, Raeissi Shali M, Niknam N. Assessment of clinical and paraclinical departments of military hospitals based on the Pabon Lasso Model. J Educ Health Promot. 2020;9:1–6.
Lai JHK, Hou H, Edwards DJ, Yuen PL. An analytic network process model for hospital facilities management performance evaluation. Facilities. 2022;40(5–6):333–52.
Lai J, Yuen PL. Identification, classification and shortlisting of performance indicators for hospital facilities management. Facilities. 2021;39(1–2):4–18.
Lin CS, Chiu CM, Huang YC, Lang HC, Chen MS. Evaluating the operational efficiency and quality of Tertiary hospitals in Taiwan: the application of the EBITDA Indicator to the DEA Method and TOBIT Regression. Healthcare. 2022;10(1):58.
Matos R, Ferreira D, Pedro MI. Economic analysis of portuguese public hospitals through the construction of quality, efficiency, access, and financial related composite indicators. Soc Indic Res. 2021;157(1):361–92.
Morisod K, Luta X, Marti J, Spycher J, Malebranche M, Bodenmann P. Measuring health equity in emergency care using routinely collected data: a systematic review. Heal Equity. 2021;5(1):801–17.
Nik Hisamuddin R, Tuan Hairulnizam TK. Developing key performance indicators for emergency department of teaching hospitals: a mixed fuzzy Delphi and nominal group technique approach. Malays J Med Sci. 2022;29(2):114–25.
Ramírez Calazans A, Paredes Esteban RM, Grijalva Estrada OB, Ibarra Rodríguez MR. Assessment of quality indicators in pediatric major outpatient surgery. Influence of the COVID-19 pandemic. Cir Pediatr. 2023;36(1):17–21.
Shaqura II, Gholami M, Akbari Sari A. Assessment of public hospitals performance in Gaza governorates using the Pabón Lasso Model. Int J Health Plann Manage. 2021;36(4):1223–35.
Al-Jazairi AS, Alnakhli AO. Quantifying clinical pharmacist activities in a tertiary care hospital using key performance indicators. Hosp Pharm. 2021;56(4):321–7.
Aloh HE, Onwujekwe OE, Aloh OG, Nweke CJ. Is bed turnover rate a good metric for hospital scale efficiency? A measure of resource utilization rate for hospitals in Southeast Nigeria. Cost Eff Resour Alloc. 2020;18(1):1–8.
Bari S, Incorvia J, Ahearn O, Dara L, Sharma S, Varallo J, et al. Building safe surgery knowledge and capacity in Cambodia: a mixed-methods evaluation of an innovative training and mentorship intervention. Glob Health Action. 2021;14(1):1998996.
Bari S, Incorvia J, Iverson KR, Bekele A, Garringer K, Ahearn O, et al. Surgical data strengthening in Ethiopia: results of a Kirkpatrick framework evaluation of a data quality intervention. Glob Health Action. 2021;14(1):1–11.
Bastos LSL, Hamacher S, Zampieri FG, Cavalcanti AB, Salluh JIF, Bozza FA. Structure and process associated with the efficiency of intensive care units in low-resource settings: an analysis of the CHECKLIST-ICU trial database. J Crit Care. 2020;59:118–23.
Bastos LSL, Wortel SA, de Keizer NF, Bakhshi-Raiez F, Salluh JIF, Dongelmans DA, et al. Comparing continuous versus categorical measures to assess and benchmark intensive care unit performance. J Crit Care. 2022;70:154063.
Kocisova K, Hass-Symotiuk M, Kludacz-Alessandri M. Use of the dea method to verify the performance model for hospitals. E M Ekon A Manag. 2018;21(4):125–40.
Lee D, Yu S, Yoon SN. Analysis of hospital management based on the characteristics of hospitals: focusing on financial indicators. Glob Bus Financ Rev. 2019;24(3):1–13.
Mirzaei A, Tabibi SJ, Nasiripour AA, Riahi L. Evaluating the feasibility of financial variables of health: A hospital administrator’s viewpoint. Galen Med J. 2016;5(1):25–30.
Middleton S, Gardner G, Gardner A, Considine J, FitzGerald G, Christofis L, et al. Are service and patient indicators different in the presence or absence of nurse practitioners? The EDPRAC cohort study of Australian emergency departments. BMJ Open. 2019;9(7):e024529.
Nobakht S, Jahangiri K, Hajinabi K. Correlation of performance indicators and productivity: A cross sectional study of emergency departments in Tehran, Iran during year 2016. Trauma Mon. 2018;23(5):1–6.
Nuti S, Grillo Ruggieri T, Podetti S. Do university hospitals perform better than general hospitals? A comparative analysis among Italian regions. BMJ Open. 2016;6(8):e011426.
Petrovic GM, Vukovic M, Vranes AJ. The impact of accreditation on health care quality in hospitals. Vojnosanit Pregl. 2018;75(8):803–8.
Pirani N, Zahiri M, Engali KA, Torabipour A. Hospital efficiency measurement before and after health sector evolution plan in Southwest of Iran: a DEA-panel data study. Acta Inf Med. 2018;26(2):106–10.
Profit J, Gould JB, Bennett M, Goldstein BA, Draper D, Phibbs CS, et al. The association of level of care with NICU quality. Pediatrics. 2016;137(3):44–51.
Rahimi H, Bahmaei J, Shojaei P, Kavosi Z, Khavasi M. Developing a strategy map to improve public hospitals performance with balanced scorecard and dematel approach. Shiraz E Med J. 2018;19(7):1–12.
Ahmed S, Hasan MZ, Laokri S, Jannat Z, Ahmed MW, Dorin F, et al. Technical efficiency of public district hospitals in Bangladesh: a data envelopment analysis. COST Eff Resour Alloc. 2019;17:17.
Rahman MH, Tumpa TJ, Ali SM, Paul SK. A grey approach to predicting healthcare performance. Meas J Int Meas Confed. 2019;134:307–25.
Sajadi HS, Sajadi ZS, Sajadi FA, Hadi M, Zahmatkesh M. The comparison of hospitals’ performance indicators before and after the Iran’s hospital care transformations plan. J Educ Health Promot. 2017;6:89.
Si S-L, You X-Y, Liu H-C, Huang J. Identifying key performance indicators for holistic hospital management with a modified DEMATEL approach. Int J Environ Res Public Health. 2017;14(8): 934.
Váchová L, Hajdíková T. Evaluation of Czech hospitals performance using MCDM methods. In: A SI, G WS, C D, editors. Department of exact methods, faculty of management, university of economics, Prague, Jarošovská 1117, Jindřichuv Hradec, vol. 37701. Czech Republic: Newswood Limited; 2017. p. 732–5.
Xenos P, Yfantopoulos J, Nektarios M, Polyzos N, Tinios P, Constantopoulos A. Efficiency and productivity assessment of public hospitals in Greece during the crisis period 2009–2012. Cost Eff Resour Alloc. 2017;15(1):6.
Zhang L, Liu R, Jiang S, Luo G, Liu H-C. Identification of key performance indicators for hospital management using an extended hesitant linguistic DEMATEL Approach. Healthc (Basel Switzerland). 2019;8(1):7.
Aksezer CS. A nonparametric approach for optimal reliability allocation in health services. Int J Qual Reliab Manag. 2016;33(2):284–94.
Cagliano AC, Grimaldi S, Rafele C. Assessing warehouse centralization and outsourcing in the healthcare sector: an Italian case study. In: Department of Management and Production Engineering, Politecnico Di Torino, Corso Duca Degli Abruzzi 24, Torino, 10129. Italy: AIDI - Italian Association of Industrial Operations Professors; 2017. p. 244–50.
Cefalu MS, Elliott MN, Setodji CM, Cleary PD, Hays RD. Hospital quality indicators are not unidimensional: a reanalysis of Lieberthal and Comer. Health Serv Res. 2019;54(2):502–8.
Gao H, Chen H, Feng J, Qin X, Wang X, Liang S, et al. Balanced scorecard-based performance evaluation of Chinese county hospitals in underdeveloped areas. J Int Med Res. 2018;46(5):1947–62.
Gonnelli V, Satta F, Frosini F, Iadanza E. Evidence-based approach to medical equipment maintenance monitoring. In: V HEO, V J, editors. University of Florence, Dept. of Information Engineering. Florence, Italy: Springer; 2017. p. 258–61.
Helkio P, Aantaa R, Virolainen P, Tuominen R. Productivity benchmarks for operative service units. ACTA Anaesthesiol Scand. 2016;60(4):450–6.
Khalifa M, Zabani I. Developing emergency room key performance indicators: What to measure and why should we measure it? J. M, A. H, P. G, A. K, M.S. H, editors. Vol. 226. King Faisal Specialist Hospital and Research Center, Jeddah, Saudi Arabia: IOS Press BV; 2016. p. 179–182.
Ajami S, Ebadsichani A, Tofighi S, Tavakoli N. Medical records department and balanced scorecard approach. J Educ Health Promot. 2013;2:7.
Bosse G, Mtatifikolo F, Abels W, Strosing C, Breuer J-P, Spies C. Immediate outcome indicators in perioperative care: a controlled intervention study on quality improvement in hospitals in Tanzania. PLoS One. 2013;8(6):e65428.
Hung K-Y, Jerng J-S. Time to have a paradigm shift in health care quality measurement. J Formos Med Assoc. 2014;113(10):673–9.
Jeejeebhoy KN, Keller H, Gramlich L, Allard JP, Laporte M, Duerksen DR, et al. Nutritional assessment: comparison of clinical assessment and objective variables for the prediction of length of hospital stay and readmission. Am J Clin Nutr. 2015;101(5):956–65.
Kittelsen SAC, Anthun KS, Goude F, Huitfeldt IMS, Häkkinen U, Kruse M, et al. Costs and quality at the hospital level in the nordic countries. Heal Econ (United Kingdom). 2015;24:140–63.
Koné Péfoyo AJ, Wodchis WP. Organizational performance impacting patient satisfaction in Ontario hospitals: a multilevel analysis. BMC Res Notes. 2013;6: 509.
Li CH, Yu CH. Performance evaluation of public non-profit hospitals using a BP Artificial neural network: the case of Hubei Province in China. Int J Environ Res Public Health. 2013;10(8):3619–33.
Liu K, Jain S, Shi J. Physician performance assessment using a composite quality index. Stat Med. 2013;32(15):2661–80.
Lloyd GF, Bajorek B, Barclay P, Goh S. Narrative review: Status of key performance indicators in contemporary hospital pharmacy practice. J Pharm Pract Res. 2015;45(4):396–403.
Mehrtak M, Yusefzadeh H, Jaafaripooyan E. Pabon Lasso and data envelopment analysis: a complementary approach to hospital performance measurement. Glob J Health Sci. 2014;6(4):107–16.
Mohammadi M, Ziapoor A, Mahboubi M, Faroukhi A, Amani N, Pour FH, et al. Performance evaluation of hospitals under supervision of Kermanshah medical sciences using pabonlasoty diagram of a five-year period (2008–2012). Life Sci J. 2014;11:77–81 (1 SPECL. ISSUE)).
Niaksu O, Zaptorius J. Applying operational research and data mining to performance based medical personnel motivation system. In: Vilnius University, Institute of Mathematics and Informatics. Lithuania: IOS; 2014. p. 63–70.
Córdoba S, Caballero I, Navalón R, Martínez-Sánchez D, Martínez-Morán C, Borbujo J. Analysis of the surgical activity in the dermatology department of Fuenlabrada University Hospital, Madrid, Spain, between 2005 and 2010: determination of the standard operating times. Actas Dermosifiliogr. 2013;104(2):141–7.
Profit J, Kowalkowski MA, Zupancic JAF, Pietz K, Richardson P, Draper D, et al. Baby-MONITOR: a composite indicator of NICU Quality. Pediatrics. 2014;134(1):74–82.
Rabar D, Pap N. Evaluation of crotia’s regional hospital effiency: an application of data envelopment analysis . Bacher U, Barkovic D, Dernoscheg KH, LamzaMaronic M, Matic B, Runzheimer B, editors. Interdisciplinary Management Research IX. 2013;9:649–59.
Ramos MCA, da Cruz LP, Kishima VC, Pollara WM, de Lira ACO, Couttolenc BF. Performance evaluation of hospitals that provide care in the public health system, Brazil. Rev Saude Publica. 2015;49:1–9.
Schuers M, Joulakian MB, Griffon N, Pachéco J, Périgard C, Lepage E, et al. In: S IN, de PM AM, editors. Quality indicators from laboratory and radiology information systems. A. G. Volume 216. France: IOS; 2015. pp. 212–6. Department of Biomedical Informatics, Rouen University Hospital, Rouen Cedex, 76031,.
Tabrizi JS, Saadati M, Sadeghi-Bazargani H, Ebadi A, Golzari SEJ. Developing indicators to improve educational governance in hospitals. Clin Gov. 2014;19(2):117–25.
Costa A Jr, aS., Leão LE, Novais MA, Zucchi P. An assessment of the quality indicators of operative and non-operative times in a public university hospital. Einstein (Sao Paulo). 2015;13(4):594–9.
Coyne JS, Helton J. How prepared are US hospitals for the affordable care act? A financial condition analysis of US hospitals in 2011. J Health Care Finance. 2015;41(3).
Davis P, Milne B, Parker K, Hider P, Lay-Yee R, Cumming J, et al. Efficiency, effectiveness, equity (E-3). Evaluating hospital performance in three dimensions. Health Policy (New York). 2013;112(1–2):19–27.
Flatow VH, Ibragimova N, Divino CM, Eshak DSA, Twohig BC, Bassily-Marcus AM, et al. Quality outcomes in the surgical intensive care unit after electronic health record implementation. Appl Clin Inf. 2015;6(4):611–8.
Fonseca JRS, Ramos RMP, Santos AMP, Fonseca APSS. Policy effects on the quality of public health care: evaluating Portuguese public hospitals’ quality through customers’ views. Cent Eur J Public Policy. 2015;9(2):122–40.
Hadji B, Meyer R, Melikeche S, Escalon S, Degoulet P. Assessing the Relationships Between Hospital Resources and Activities: A Systematic Review. J Med Syst. 2014;38(10):1–21.
Hajduová Z, Herbrik G, Beslerová S. Application of DEA in the environment of Slovak hospitals. Invest Manag Financ Innov. 2015;12(4):148–53.
Thomas Craig KJ, McKillop MM, Huang HT, George J, Punwani ES, Rhee KB. U.S. hospital performance methodologies: a scoping review to identify opportunities for crossing the quality chasm. BMC Health Serv Res. 2020;20(1):640.
Carini E, Gabutti I, Frisicale EM, Di Pilla A, Pezzullo AM, de Waure C, et al. Assessing hospital performance indicators. What dimensions? Evidence from an umbrella review. BMC Health Serv Res. 2020;20(1):1038.
Rasi V, Delgoshaee B, Maleki M. Identification of common indicators of hospital performance evaluation models: a scoping review. J Educ Health Promot. 2020;9(1):63.
Xenos P, Yfantopoulos J, Nektarios M, Polyzos N, Tinios P, Constantopoulos A. Efficiency and productivity assessment of public hospitals in Greece during the crisis period 2009–2012. COST Eff Resour Alloc. 2017;15:15.
Shaqura II, Gholami M, Sari AA. Evaluation of performance at Palestinian public hospitals using Pabon Lasso model. Int J Health Plann Manage. 2021;36(3):896–910.
Li J, Seale H, Ray P, Wang Q, Yang P, Li S, et al. E-Health preparedness assessment in the context of an influenza pandemic: a qualitative study in China. BMJ Open. 2013;3(3):e002293.
Huang C-Y, Lai C-H. Effects of internal branding management in a hospital context. Serv Ind J. 2021;41(15–16):985–1006.
Acknowledgements
The authors are grateful for the support of the Vice Chancellor for Research of Isfahan University of Medical Sciences.
Funding
The present article is part of the result of a doctoral thesis approved by Isfahan University of Medical Sciences with code 55657 (IR.MUI.NUREMA.REC.1401.005), without financial source.
Author information
Authors and Affiliations
Contributions
Shirin Alsadat Hadian and Reza Rezayatmans and Saeedeh Ketabi: Study conceptualization and design. Acquisition of data: Shirin Alsadat Hadian, Reza Rezayatmand. Analysis and interpretation of data: Shirin Alsadat Hadian, Reza Rezayatmand, Nasrin Shaarbafchizadeh, Saeedeh Ketabi. Drafting of the manuscript: Shirin Alsadat Hadian, Reza Rezayatmand. Critical revision of the manuscript for important intellectual content: Reza Rezayatmand, Nasrin Shaarbafchizadeh, Saeedeh Ketabi, Ahmad Reza Pourghaderi.
Corresponding author
Ethics declarations
Ethics approval and consent to participate
Not applicable.
Consent for publication
Not applicable.
Competing interests
The authors declare no competing interests.
Additional information
Publisher’s Note
Springer Nature remains neutral with regard to jurisdictional claims in published maps and institutional affiliations.
Supplementary Information
Rights and permissions
Open Access This article is licensed under a Creative Commons Attribution 4.0 International License, which permits use, sharing, adaptation, distribution and reproduction in any medium or format, as long as you give appropriate credit to the original author(s) and the source, provide a link to the Creative Commons licence, and indicate if changes were made. The images or other third party material in this article are included in the article's Creative Commons licence, unless indicated otherwise in a credit line to the material. If material is not included in the article's Creative Commons licence and your intended use is not permitted by statutory regulation or exceeds the permitted use, you will need to obtain permission directly from the copyright holder. To view a copy of this licence, visit http://creativecommons.org/licenses/by/4.0/. The Creative Commons Public Domain Dedication waiver (http://creativecommons.org/publicdomain/zero/1.0/) applies to the data made available in this article, unless otherwise stated in a credit line to the data.
About this article

Cite this article
Hadian, S.A., Rezayatmand, R., Shaarbafchizadeh, N. et al. Hospital performance evaluation indicators: a scoping review. BMC Health Serv Res 24, 561 (2024). https://doi.org/10.1186/s12913-024-10940-1
Received:
Accepted:
Published:
DOI: https://doi.org/10.1186/s12913-024-10940-1