
Abstract
Background
The micro waveform of His bundle potential can’t be recorded beat-to-beat on surface electrocardiogram yet. We have found that the micro-wavelets before QRS complex may be related to atrioventricular conduction system potentials. This study is to explore the possibility of His bundle potential can be noninvasively recorded on surface electrocardiogram.
Methods
We randomized 65 patients undergoing radiofrequency catheter ablation of paroxysmal superventricular tachycardia (exclude overt Wolff-Parkinson-White syndrome) to receive “conventional electrocardiogram” and “new electrocardiogram” before the procedure. His bundle electrogram was collected during the procedure. Comparative analysis of PAs (PA interval recorded on surface electrocardiogram), AHs (AH interval recorded on surface electrocardiogram) and HVs (HV interval recorded on surface electrocardiogram) interval recorded on surface “new electrocardiogram” and PA, AH, HV interval recorded on His bundle electrogram was investigated.
Results
There was no difference (P > 0.05) between groups in HVs interval (49.63 ± 6.19 ms) and HV interval (49.35 ± 6.49 ms). Results of correlational analysis found that HVS interval was significantly positively associated with HV interval (r = 0.929; P < 0.01).
Conclusions
His bundle potentials can be noninvasively recorded on surface electrocardiogram. Noninvasive His bundle potential tracing might represent a new method for locating the site of atrioventricular block and identifying the origin of a wide QRS complex.
Background
An electrocardiogram exam plays an irreplaceable role in the diagnosis of arrhythmia [1]. To our knowledge, the potentials of specialized conduction system on surface electrocardiogram have not been recorded yet in human. Therefore, it is difficult to evaluate the sinoatrial function, locate the site of atrioventricular block and identify the origin of a wide QRS complex on surface. Although sinoatrial node potential [2,3,4,5] and His bundle potential [6,7,8,9,10,11,12,13,14,15] can be recorded in intracardiac electrophysiology study, it isn’t in a wide range of applications due to its invasive exam. With the clinical expectation, we used new electrocardiogram machine (model PHS-A10) and not only the P-QRS-T waves but also the micro-wavelets on surface electrocardiogram were firstly recorded in healthy and arrhythmia volunteers. In healthy and arrhythmias volunteers, we have found that the micro-wavelets before QRS complex (overlapped on P wave and in PR segment) may be related to atrioventricular conduction system potentials [16, 17]. In this study, we further verified the relationships between the micro-wavelets before QRS complex and atrioventricular conduction system potentials. According to the position and characteristics of these micro-wavelets before QRS complex, PR interval recorded on “new electrocardiogram” was divided into three intervals: PAs (PA interval recorded on surface electrocardiogram) interval, AHs (AH interval recorded on surface electrocardiogram) interval and HVs (HV interval recorded on surface electrocardiogram) interval. Comparative analysis of PAs, AHs and HVs interval recorded on surface “new electrocardiogram” and PA, AH, HV interval recorded on His bundle electrogram was investigated in 65 patients undergoing radiofrequency catheter ablation of paroxysmal superventricular tachycardia. Now we present our preliminary analysis.
Methods
Materials
Sixty-five patients who were proved to have a paroxysmal supraventricular tachycardia formed the subjects of this study in the First Affiliated Hospital of Liaoning Medical University. There were 31 males and 34 females, with a mean age of 52 ± 13 years (ranging from 14 to 84 years). All patients were included 4 groups according to the intracardiac electrophysiology study: 33 patients with atrioventricular nodal reentrant tachycardia; 29 patients with atrioventricular reentrant tachycardia (exclude overt Wolff-Parkinson-White syndrome); one patient with atrial tachycardia; two patients with paroxysmal atrial fibrillation. We used a “new electrocardiogram” machine (model PHS-A10) designed and developed by EmCG US company to record surface electrocardiogram. The intracardiac electrophysiology study was performed by an electrophysiological recording and the analysis system Model CardioLab 7000 (GE Co., USA).
Methods
Resting supine 12-lead electrocardiograms in sinus rhythm and His bundle electrogram in sinus rhythm were recorded before the intracardiac electrophysiology study. Two independent observers who knew the purpose of the study but were blinded to the study design and the results of all investigations evaluated the electrocardiograms and His bundle electrogram.
-
1.
Recording conditions: The subject’s skin was firstly pretreated with sandpaper, and then special electrodes (non-cytotoxic silver/silver chloride substrate) are used to perform the test, in which the arrangement of electrodes were the same as that in a 12 lead electrocardiogram. In addition, both “new electrocardiogram” [It was coined the term of saahECG (SAN-Atrial-AVN-His ECG) by the developers] and “conventional electrocardiogram” have been detected synchronously by the “new electrocardiogram” machine. Moreover, the scanning speed (25 mm/s) and amplitude (10 mm/mV), and the measuring speed (25 mm/s) and amplitude (20 mm/mV) in long trace leads were selected. The micro-wavelets before P wave, before QRS complex (in P wave and PR segment) and after QRS complex (ST segment and upstroke of T wave) can be recorded by the “new electrocardiogram” machine (Fig. 1a, b and c segments, the wavelet mechanism refers to discussion part 1).
Fig. 1 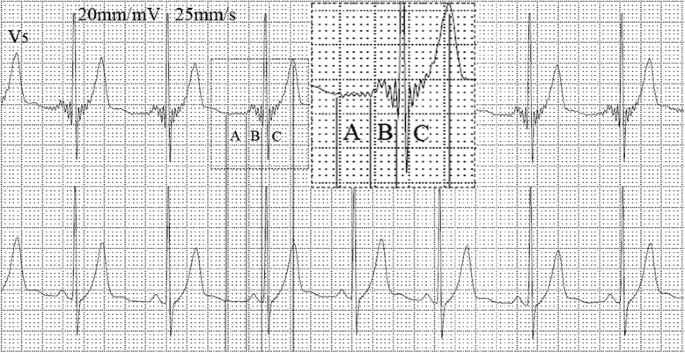
The “new electrocardiogram” and “conventional electrocardiogram” are recorded simultaneously. The upper lead is “new electrocardiogram” and the lower is “conventional electrocardiogram” in lead V5. New wavelets are clearly recorded before P wave (a), before QRS complex (b) and after QRS complex (c)
-
2.
Mapping of HVs, AHs and PAs intervals on surface electrocardiogram was as following: PAs interval (the time interval from the initiation of the P wave to the first notch of the P wave), AHs interval (the time interval from the first notch of the P wave to the initiation of the second wavelet with higher amplitude closed to the QRS complex) and HVs interval (the time interval from the initiation of the second wavelet with higher amplitude closed to the QRS complex to the start of the QRS complex). The values of each intervals measured by the computer were seen in Fig. 2 (principle refer to discussion part 2). These micro-wavelets (the paper speed of electrocardiogram was 25 mm/s and the gain was 20 mm/mV) were amplified (four magnification) on the computer to determine the distinct measuring point (always in leads II or V5). The values of each intervals (ms) measured by the computer.
Fig. 2 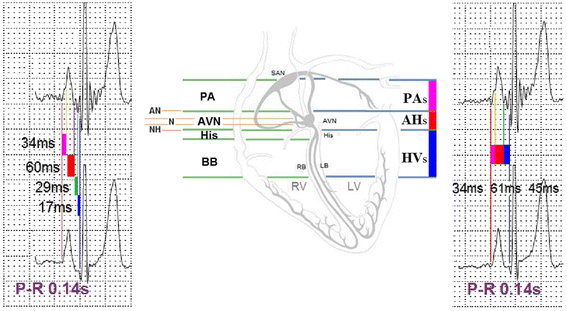
According to the micro-wavelets before QRS complex, PR interval is the summation of three intervals: PAs interval (the time interval from the initiation of the P wave to the first notch of the P wave), AHs interval (the time interval from the first notch of the P wave to the initiation of the second wavelet closed to the QRS complex) and HVs interval (the time interval from the initiation of the second wavelet closed to the QRS complex to the start of the QRS complex). PAs indicates that PA interval recorded on surface electrocardiogram; AHs indicates that AH interval recorded on surface electrocardiogram; HVs indicates that HV interval recorded on surface electrocardiogram
-
3.
Details concerning electrophysiologic study (including His bundle electrogram record and PA, AH, HV interval measurement) were obtained as previously described [18]. They were recorded at paper speeds of 100 mm/sec and be analyzed by ruler in computers (manual selection of measurement points).


Statistical analysis
The results were given as means ± s.d., Paired t tests were used to compare the index of “new electrocardiogram” and His bundle electrogram. The correlation between the same variables measured by the two methods was analyzed by using Pearson correlation analysis. All statistical analysis was performed using SPSS 16.0. A P-value <0.05 was considered significant.
Results
-
1.
Comparative analysis of intervals recorded on “new electrocardiogram” and His bundle electrogram
There were no difference (P > 0.05) between groups in HVs interval recorded on “new electrocardiogram” and HV interval recorded on His bundle electrogram. There were differences (P < 0.05) between groups in PAs, AHs, PR interval recorded on “new electrocardiogram” and PA, AH, PR interval recorded on His bundle electrogram, as shown in Table 1, Figs. 3 and 4.

Comparative study of PAs, AHs and HVs interval recorded on “New electrocardiogram” and PA, AH and HV interval recorded on His bundle electrogram. Compared with intracardiac electrophysiology study, ▲ indicates P < 0.05

Comparative study of PAs, AHs and HVs interval recorded on “New electrocardiogram” and PA, AH and HV interval recorded on His bundle electrogram in one subject. a shows the new electrocardiogram (upper trace) and conventional electrocardiogram (lower trace). b shows the His bundle electrogram. The PAs, AHs and HVs intervals on new electrocardiogram are consistent with the intra-atrial measurement (PA, AH and HV interval). Figure is representative of one subject with similar results
-
2.
Pearson correlation analysis between PAs, AHs, HVs, PRs intervals recorded on “new electrocardiogram” and PA, AH, HV, PR interval recorded on His bundle electrogram
Results of correlational analysis found that PAs was significantly positively associated with PA interval (r = 0.800; P < 0.01); AHs interval was significantly positively associated with AH interval (r = 0.792; P < 0.01); HVs interval was significantly positively associated with HV interval (r = 0.929; P < 0.01); PRs interval was significantly positively associated with PR interval (r = 0.839; P < 0.001), as shown in Fig. 5.

Pearson correlation analysis between PAs, AHs, HVs, PRs interval recorded on “new electrocardiogram” and PA, AH, HV, PR interval recorded on His bundle electrogram. a shows Pearson correlation analysis between PAs interval and PA interval; b shows Pearson correlation analysis between AHs interval and AH interval; c shows Pearson correlation analysis between HVs interval and HV interval; d shows Pearson correlation analysis between PRs interval and PR interval; PAs was significantly positively associated with PA interval (r = 0.800; P < 0.01); AHs interval was significantly positively associated with AH interval (r = 0.792; P < 0.01); HVs interval was significantly positively associated with HV interval (r = 0.929; P < 0.01); PRs interval was significantly positively associated with PR interval (r = 0.839; P < 0.001)
Discussion
-
1.
Why “New electrocardiogram” can record the micro waveform before QRS complex which conventional electrocardiogram couldn’t?
The PHS-A10 electrocardiogram is a new device created by EmCG US company using the latest technology of the software and the hardware, and the signal processing technology. These are based on a collection of various US patents and International patents. The PhySio’s PHS-A10 is highlighted by its success in employing a novel Adaptive Mixture Technology within the electrocardiogram Signal Spectrum enabled by PhySio’s Smart Data Acquisition Module. Along with traditional electrocardiogram scanning/recording, PHS-A10 is able to accurately extract a variety of time-domain electrocardiogram electric potentials in the 0-150Hz range, and perform automated integrating signals recognition. Therefore, not only the P-QRS-T waves but also the micro-wavelets before P wave, before QRS complex (overlapped on P wave and in PR segment), after QRS complex (ST segment and upstroke of T wave) can be recorded on surface electrocardiogram (Fig. 1a, b, c segments). Besides, on base of new wavelets recorded by “new electrocardiogram”, the Electrophysiocardiogram has further been created by EmCG US company. Electrophysiocardiogram has separated the acquired convoluted signals into a plurality of different linear wave forms in various frequency ranges, for examples, for the frequency range from 1 to 150 Hz (conventional electrocardiogram), and it has been divided into 32 linear wave forms. Therefore, these wavelets can be revealed more clearly [19]. The resulting electrocardiogram wavelet signals are displaying the natural signals of various parts of the heart (before P wave, before QRS complex and after QRS complex) without interfering artifacts in our 100 healthy volunteers [17]. In our study, we only discuss the wavelet before QRS complex.
-
2.
According to the micro-wavelets before QRS complex, PR interval was divided into PAs, AHs and HVs interval on “New electrocardiogram”
(1) In 100 healthy individuals, we have found that the new electrocardiogram can record characteristic wavelets before QRS complex: two wavelets in PR segment with higher amplitude closest to QRS complex and one to three wavelets with lower amplitude before these two wavelets) [17]. The wavelets in P wave and PR segment might be related to atrioventricular node and His bundle- bundle potentials due to cardiac anatomy and the sequence of electrical activation. (2) In patients with atrial (atrial contraction, atrial tachycardia, atrial flutter, atrial fibrillation) and junctional arrhythmias (premature junctional contraction, junctional escape), we also have found the characteristic wavelets above. In patients with ventricular arrhythmias (premature ventricular contraction, ventricular tachycardia, ventricular pacing), there was no micro waveform before the wide QRS complex [17]. These suggested the wavelets before QRS complex might be related to atrioventricular conduction system potentials. (3) In patients with second degree atrioventricular block type I (atrioventricular node level block), we have found that two wavelets in PR segment with higher amplitude closest to QRS complex were constant and several wavelets with lower amplitude before these two wavelets (overlapped in P wave and after the P wave) were progressive increased according to the progressive lengthening PR interval [16]. These suggested this two wavelets closed to the QRS complex with high amplitude might be related to His bundle and bundle branch potentials. (4) Based on the above study, we preliminary recognized that PR interval was divided into PAs interval (the time interval from the initiation of the P wave to the first notch of the P wave), AHs interval (the time interval from the first notch of the P wave to the initiation of the second wavelet with higher amplitude closed to the QRS complex) and HVs interval (the time interval from the initiation of the second wavelet with higher amplitude closed to the QRS complex to the start of the QRS complex). A finding in our 100 healthy individuals was that the PAs, AHs and AHs intervals were consistent with the intra-atrial measurement PA, AH and HV intervals [18]. In the patient with first-degree atrioventricular block at atrioventricular nodal level which verified by intracardiac electrogram, we have observed on new electrocardiogram that two wavelets in PR segment with higher amplitude closest to QRS complex maintained unchanged and the number of wavelets with lower amplitude before these two wavelets was increased. Thus, these confirmed that PR interval was divided into PAs, AHs and HVs interval.
-
3.
Comparative study of PAs, AHs and HVs interval recorded on “New electrocardiogram” and PA, AH and HV interval recorded on His bundle electrogram
(1) A finding of Paired t tests in our study in 65 paroxysmal supraventricular tachycardia underwent “New electrocardiogram” and His bundle electrogram (these two weren’t simultaneously recorded) was that there was no difference (P > 0.05) between groups in HVs interval and HV interval. Results of correlational analysis found that HVS interval was significantly positively associated with HV interval (r = 0.929; P < 0.01). These suggested two wavelets closed to the QRS complex with high amplitude in HVs interval was His bundle and bundle branch potentials on surface electrocardiogram. (2) A finding of Paired t tests revealed there were differences (P < 0.05) between groups in AHs interval (79.86 ± 15.35 ms) and AH interval (77.20 ± 16.04 ms). The means difference of AHs and AH interval was in a few milliseconds and was in the range of physiological changes (autonomic nerve change) of AH interval (20–50 ms) [5]. Therefore, there was no clinical significance. Besides, results of correlational analysis found that AHs interval was significantly positively associated with AH interval (r = 0.792; P < 0.01). Therefore, the wavelets (overlapped in P wave and after the P wave) in AHs interval may be atrioventricular nodal potential.
Study limitations
(1) “New electrocardiogram” and His bundle electrogram weren’t simultaneously recorded. Therefore, autonomic nerve change may have effect on atrioventricular nodal, leading to differences between groups in AH interval and PR interval. (2) The paper speed of “New electrocardiogram” weren’t consistent with His bundle electrogram. The paper speed of “New electrocardiogram” was 25 mm/s and the paper speed of His bundle electrogram was 100 mm/s. If the paper speed of “New electrocardiogram” was 100 mm/s, the acute angle of the wavelet before QRS complex became blunt. Therefore, it was difficult to determine the starting point. To reduce the impact of paper speed, the body surface measurements were amplified (four magnification) on the computer. It can not completely exclude the impact of paper speed. (3) In AHs interval, the A point was the initiation of the first notch of the P wave (not an acute angle), but the starting point of A wave in His bundle electrogram was clear. Although these limitations didn’t have effect on clinical significance of our result, the normal scope of PAs, AHs and HVs interval can’t be applied mechanically according to the intracardiac electrophysiology study. It still required statistical analysis of large sample.
Conclusions
In conclusion, our study revealed that His bundle potential can be noninvasively recorded beat by beat in human. It has only begun with a prologue for a new research and still requires a great number of clinical and animal experiments in order to verify the clinical significance, normal scope, characteristics and mechanism of these micro waveforms. The purpose of this study is to put forth in the hope that more doctors and scientists will join hand to greet the second spring of the electrocardiogram.
Abbreviations
- AHs :
-
AH interval recorded on surface electrocardiogram
- HVs :
-
HV interval recorded on surface electrocardiogram
- PAs :
-
PA interval recorded on surface electrocardiogram
References
Fisch C. The clinical electrocardiogram: a classic. Circulation. 1980;62(Suppl III):1–4.
Josephsm ME. Sinus node function. In: Josephson ME, editor. Clinical cardiac electrophysiology techniques and interpretations. 4th ed. Philadelphia: Lippincott Williams &Wilkins; 2008. p. 140–54.
Zaim B, Zaim S, Garan H. Invasive cardiac electrophysiology studies in assessment and management of cardiac arrhythmias. In: Podrid PJ, Kowey PR, editors. Cardiac arrhythmia: mechanisms, diagnosis, and management. Baltimore: Williams &Wilkins; 1995. p. 258–79.
Ho RT. Bradycardias. In: Ho RT, editor. Electrophysiology of arrhythmias: practical images for diagnosis and ablation. Philadelphia: Lippincott Williams & Wilkins; 2010. pp. 1–32.
Reddy CP, Damato AN, Akhtar M, Ogunkelu JB, Caracta AR, Ruskin JN, Lau SH. Time dependent changes in the functional properties of the atrioventricular conduction system in man. Circulation. 1975;52:1012–22.
Narula OS, Cohen LS, Samet P, Lister JW, Scherlag B, Hildner FJ. Localization of A-V conduction defects in man by recording of the His bundle electrogram. Am J Cardiol. 1970;25:228–37.
Damato AN, Lau SH. Clinical value of the electrogram of the conduction system. Prog Cardiovasc Dis. 1970;13:119–40.
Naruls OS, Scherlag BJ, Samet P, Javier RP. Atrioventricular block: localization and classification by His bundle recordings. Am J Med. 1971;50:146–65.
Castellanos Jr A, Castillo CA, Agha AS. Symposium on Electophysiologic Correlates of Clinical Arrhythmias. 3. Contribution of His bundle recording to the understanding of clinical arrhythmias. Am J Cardiol. 1971;28:499–508.
Schuilenburg RM, Durrer D. Problems in the recognition of conduction disturbances in the His bundle. Circulation. 1975;51:68–74.
Schuilenburg RM, Durrer D. Conduction disturbances located within the His bundle. Circulation. 1972;45:612–28.
Bekheit S, Murtagh JG, Morton P, Fletcher E. Measurements of sinus impulse conduction from electrogram of bundle of His. Br Heart J. 1971;33:719–24.
Bekheit S, Murtagh JG, Morton P, Fletcher E. Studies of heart block with His bundle electrograms. Br Heart J. 1972;34:717–34.
Rosen KM. Evaluation of cardiac conduction in the cardiac catheterization laboratory. Am J Cardiol. 1972;30:701–3.
Kupersmith J, Krongrad E, Waldo AL. Conduction intervals and conduction velocity in the human cardiac conduction system. Studies during open-heart surgery. Circulation. 1973;47(4):776–85.
Liu R, Chang Q. An attempt of “new wavelet” analysis on electrocardiogram in locating the site of atrioventricular block. Int J Cardiol. 2015;189:228–30.
Liu R, Chang Q, Chen J. New micro waveforms firstly recorded on electrocardiogram in human. Med Hypotheses. 2015;85:475–9.
Josephsm ME. Electrophysiologic Investigation:General Concepts. In: Josephson ME, editor. Clinical cardiac electrophysiology techniques and interpretations. 3rd ed. Philadelphia: Lippincott Williams &Wilkins; 2002. p. 11–36.
Chen G, Yao L, Zhao R, Zeng J, Liu M. Electrophysiocardiogram: for the first time EPCG has been recorded on human body surface. Int J Cardiol. 2016;222:499–503.
Acknowledgments
Special thanks to EmCG US company for their help on record technique. Special thanks to all volunteers. The individuals tested in order to obtain these results were due to non-profit circumstances.
Funding
This research is supported by the President Fund of Liaoning Medical University under Grant NO. XZJJ20140202.
Availability of data and materials
All relevant data supporting the conclusions of this article is included within the article.
Authors’ contributions
All authors fulfill the criteria for authorship. RGL conceived and designed the research. GPW, RGL, QHC, ZLX, YJZ, DZP acquired the data. GPW, RGL, QHC, ZLX, YJZ, DZP performed statistical analysis. QHC handled funding and supervision. GPW, RGL, QHC, ZLX, YJZ, DZP drafted the manuscript and made critical revision of the manuscript for key intellectual content. All authors read and approved the final version of the manuscript. All authors have agreed to authorship and order of authorship for this manuscript.
Competing interests
The authors declare that they have no competing interests.
Consent for publication
Not applicable.
Ethics approval and consent to participate
All of the subjects gave their informed consent, and the study was approved by the Local Ethics Committee of Liaoning Medical University.
Publisher’s Note
Springer Nature remains neutral with regard to jurisdictional claims in published maps and institutional affiliations.
Author information
Authors and Affiliations
Corresponding author
Rights and permissions
Open Access This article is distributed under the terms of the Creative Commons Attribution 4.0 International License (http://creativecommons.org/licenses/by/4.0/), which permits unrestricted use, distribution, and reproduction in any medium, provided you give appropriate credit to the original author(s) and the source, provide a link to the Creative Commons license, and indicate if changes were made. The Creative Commons Public Domain Dedication waiver (http://creativecommons.org/publicdomain/zero/1.0/) applies to the data made available in this article, unless otherwise stated.
About this article

Cite this article
Wang, G., Liu, R., Chang, Q. et al. Electrocardiogram: his bundle potentials can be recorded noninvasively beat by beat on surface electrocardiogram. BMC Cardiovasc Disord 17, 82 (2017). https://doi.org/10.1186/s12872-017-0516-3
Received:
Accepted:
Published:
DOI: https://doi.org/10.1186/s12872-017-0516-3