
Abstract
Background
The abiotic stress such as soil salinization and heavy metal toxicity has posed a major threat to sustainable crop production worldwide. Previous studies revealed that halophytes were supposed to tolerate other stress including heavy metal toxicity. Though HMAD (heavy-metal-associated domain) was reported to play various important functions in Arabidopsis, little is known in Gossypium.
Results
A total of 169 G. hirsutum genes were identified belonging to the HMAD gene family with the number of amino acids ranged from 56 to 1011. Additionally, 84, 76 and 159 HMAD genes were identified in each G. arboreum, G. raimondii and G. barbadense, respectively. The phylogenetic tree analysis showed that the HMAD gene family were divided into five classes, and 87 orthologs of HMAD genes were identified in four Gossypium species, such as genes Gh_D08G1950 and Gh_A08G2387 of G. hirsutum are orthologs of the Gorai.004G210800.1 and Cotton_A_25987 gene in G. raimondii and G. arboreum, respectively. In addition, 15 genes were lost during evolution. Furthermore, conserved sequence analysis found the conserved catalytic center containing an anion binding (CXXC) box. The HMAD gene family showed a differential expression levels among different tissues and developmental stages in G. hirsutum with the different cis-elements for abiotic stress.
Conclusions
Current study provided important information about HMAD family genes under salt-stress in Gossypium genome, which would be useful to understand its putative functions in different species of cotton.
Background
Halophytes are ideal candidate crop for soil reclamation of heavy metal polluted soils [1]. Heavy metals (HMs), on the one hand, as micronutrient elements level (such as Fe, Cu, Zn, Co, Mn, Mo, Ni) is essential for the plant growth while become toxic in excess; on the other hand, other heavy metals (Ag+, Cd2+, Pb2+, Hg2+) even at low doses, are highly toxic because of no need for life and biological roles [2]. HMs contamination significantly affects not only the plant itself, but also the soil microbial community structure and function [3,4,5]. Heavy metal stress mainly concentrated in the signaling networks of calcium signaling, hormone signaling and MAPK (mitogen activated protein kinase) signaling and peroxide, which focused on ion detoxification and transport [6, 7]. Metal chelators is majorly Phytochelatins (PCs) and Metallothioneins (MTs), although MTs protects the plant from heavy metals by scavenging of the ROS and sequestration, even which is multi-resistant under abiotic stress such as cold, heat, salt, drought and so on [8, 9]. Compared to metal chelators, prominent groups of heavy metal ion transport families are P-type ATPases and the cation antiporters, such as HMA (Heavy metal ATPase), ABC (the ATP-binding cassette), NRAMP (Natural resistance and macrophage protein), CDF (Cation Diffusion Facilitator), yellow-stripe-like (YSL) transporter, ZIP (the Zrt, Irt-like proteins), CAX (the cation exchanger), CTR (the copper transporters), pleiotropic drug resistance (PDR) transporters, and metal responsive transcription factor 1 (MTF-1), distributing at plasma membrane or on tonoplast membrane of cell [10,11,12,13,14]. For HMA hyperaccumulators, vacuolar compartmentalization and HMs ion long-distance translocation that depends on P-type ATPases and a set of tonoplast transporters play important role in heavy metals homeostasis [15,16,17].
P-type ATPases have been subsided into 5 subfamilies, P1B ATPases (heavy metal pumps), P2A and P2B ATPases (Ca2+ pumps), P3A ATPases (plasma membrane H+ pumps), P4 ATPases (phospholipid-transporting ATPase) and P5 (no assigned specificity) subfamilies [18,19,20]. At least four P1B-ATPase subgroups with distinct metal selectivity: P1B-1 (include AtHMA5–8, OsHMA4–9), Cu2+, P1B-2 (include AtHMA2–4), Zn2+, P1B-3, Cu2+, P1B-4 (include AtHMA1), Co2+, which share a common catalytic mechanism with four important domains which are enzyme phosphorylation (P-domain), nucleotide binding (N-domain) and energy transduction (A-domain) and a transmembrane (TM) domain, respectively [21,22,23]. PIB-type ATPase lpg1024 (LpCopA) from L. pneumophila demonstrated that Cu2+ ion-entry path involves two ion-binding sites: one transient Met148-Cys382 site and one intramembranous site formed by trigonal coordination to Cys384, Asn689, and Met717 [24]. One nanobodies (Nbs) selected against the zinc-transporting PIB-2-ATPases ZntA from Shigella sonnei (SsZntA), significantly reduces the ATPase activity [25]. The multifunctional P1B-4-ATPase CzcP is part of the cobalt, zinc, and cadmium resistance system from the metal-tolerant, model organism Cupriavidus metallidurans, because of an evolutionarily adapted flexibility in the TM region likely afforded CzcP the ability to transport Cd2+ and Zn2+ in addition to Co2+ [26]. In Mycobacterium tuberculosis, replacement of the conserved Cys of P1B-4-ATPases at the metal binding pocket leads to a large reduction in Fe2+ but not Co2+ binding affinity [27]. In Sphaerobacter thermophilus, the P1B-1 and P1B-3-ATPase subfamilies both comprise Cu2+ transporters [28].
HMA (Heavy Metal ATPase) belonging to P1B-type ATPases (also called CPx-ATPases), is responsible for ion detoxification/transport [29,30,31] and vacuolar compartmentalization [32]. It is interesting in double mutant that HMA not only affects the transport of heavy metals [33], but also affect the plant growth and development [33]. And in rice, the DNA methylation state was altered in response to the heavy metal stress and showed transgenerational inheritance [34]. In Sorghum bicolor, arsenic stimulates expression of the P1B-ATPase transporter through the abscisic acid signaling pathway. In addition, Antioxidant Protein1 (OsATX1), as a Cu chaperone in rice, interacts with the P1B-ATPases HMA4, HMA5, HMA6, and HMA9, resulting in Cu trafficking and distribution in order to maintain Cu homeostasis in different rice tissues [35]. In a model of semi-halophyte M. crystallinum, HMA4 (heavy metal ATPase 4) and IRT2 (iron-regulated protein 2) had a significantly higher expression level compared to the control between Cd-untreated and NaCl-untreated, and effects on IRT2 expression were cumulative [36]. Moreover, salinity stress overlaps with HMs toxicity to some extent, as several integrated mechanical and chemical signals are responsible for stress-related responses [37]. For example, chloroplast and chlorophyll content can measure salt stress [38], also affect the transport of heavy metals [39, 40]. Even flavonols have shown the ability in alleviating toxic effect of Pb and improving the resistance of plants, because it activated anti-oxidative process [41].
There are many similarities used as indicators for plant between heavy metal stress and salt stress, such as photosynthetic performance and stomatal behavior [42], photosynthetic pigment [43], proline [44, 45] and peroxidase [43]. ROS (reactive oxygen species) signal and the antioxidant system is a crosstalk among abiotic stresses, and the same for salt stress and heavy metal stress [46,47,48,49,50], which genes about peroxidase and GSH-AsA sysytem can not only improve salt tolerance, but also heavy metal tolerance [51,52,53,54]. Even genes associated with the GSH (glutathione) in sulfur metabolism enhance salt tolerance and heavy metals tolerance as well [55,56,57,58]. Furthermore, hormones alleviate salt stress and heavy metals stress, such as IAA (indole-3-acetic acid) [59, 60], Epibrassinolide [61, 62], Melatonin [63, 64], Ethylene-related gene [65, 66]. And the salicylic acid [67,68,69], NO [70,71,72], Silicon [73, 74] and biochar [75, 76] also can increase resistance to salt and heavy metal stresses.
Except the genes related with the antioxidant system, some genes responding to salt tolerance improve resistance to heavy metal stress. For example, a novel salt overly-sensitive 2 (SOS2) interaction protein SIP1 (SOS2 interaction protein 1) [77], the ubiquitin-specific protease (ZmUBP15, ZmUBP16 and ZmUBP19) [78], an ABA biogenesis inhibitor fluridone (FLUN) [79, 80], late embryogenesis abundant (LEA) or -related proteins [81, 82], Aquaporin (AQP) proteins [83, 84], plasma membrane H+-ATPase [85, 86], heat shock proteins [87, 88], a ramie bZIP transcription factor BnbZIP2 [89]. Some genes responding to heavy metal tolerance also enhance resistance to salt stress, such as phytochelatin synthase AtPCS2 [90], OsMT-3a (metallothionein-like type 3) [91]. Otherwise, some genes not reported to salt and heavy metal stresses can also improves salinity and heavy metal tolerance, for example, the pathogenesis-related protein [92,93,94], an ATP-binding cassette (ABC) transporter AtABCG36/AtPDR8 [95,96,97], CBS Domain Containing Protein OsCBSX4 [98], OsMIZ1 (MIZU-KUSSEI1) [99], OsSMP1 (stress membrane protein) [100].
The relationship between salt and heavy metals needs more research to show that the combined application of NaCl and CuSO4 has a significant adverse effect on wheat varieties [101]., while in cucumber (Cucumis sativus L.), salinity decreases the content of Zn uptake and increased other heavy metals (Cd, Cu, Ni, Pb) uptake [102]. What is more, there is an antagonistic effect of sodium chloride to differential heavy metal toxicity, especially to Cd2+ [103]. In Spirodela polyrrhiza (Lemnaceae), a high level of salinity inhibits the accumulation of the cadmium (Cd) and nickel (Ni) [104]. Ni at 20 mg kg-1 will increase the growth of wheat by alleviating salinity stress [105]. Additionally, Cd inhibited the Cu absorption of the root system [106], and cadmium was more toxic than copper on plants [107]. So far, the most researches about microorganisms have been reported both salt-tolerant and heavy-metal resistant, some of which can alleviate the heavy metal and salt stress in plants [108,109,110,111]. In addition, halophytes [112] and semi-halophyte [36] is known to be related to both salt and heavy metals. Besides, the eggplant breeding lines resistant against salt and drought stresses had higher Pb tolerance [113]. In willow species, S. linearistipularis had higher salt tolerance than S. matsudana, which plays important roles in heavy metal phytoextraction [106, 114].
Cotton (Gossypium L.), as a moderately salt-tolerant cash crop, is a pioneer crop for soil reclamation of saline-alkaline land [115, 116]. And cotton is an important fiber crop which provides the natural fiber for the textile industry [117]. Previously, much progress has been made in the identification of HMAD (heavy-metal-associated domain) genes in different plants [118,119,120]. However, there are no detail study has been reported in the identification, functional characterization, conserved domain analysis and expression profiles of the HMAD genes under salt-stress condition in cotton. The released genome sequence data of cotton and a publicly available database on CottonGen (https://www.cottongen.org/) allow us to comprehensively identify and analyze the HMAD gene family in cotton [117]. In this study, we conducted a comprehensive identification of HMAD genes in G. hirsutum, G. barbadense, G. raimondii and G. arboreum, with their chromosomal distribution, syntenic analysis, gene structure and conserved motifs analysis, as well as Ka/Ks values and expression pattern. In addition, predicted regulatory mechanism showed 111 HMAD genes were possibly regulated by salt-stress. This study will provide the basic information to explore the specific functions of HMAD gene family in cotton under salt-stress.
Results
Genome-wide identification and phylogenetic analysis
We used the Hidden Markov Model (HMM) profile of HMAD domain (PF00403) from Pfam (http://www.pfam.sanger.ac.uk/) database as queries to search the HMAD members in G. hirsutum, G. arboreum, G. raimondii and G. barbadense by Hmmer software with default parameters. A total of 169 proteins were identified belonging to the HMAD gene family in G. hirsutum with the number of amino acids ranged from 56 to 1011 (Table 1). Furthermore, we identified 84, 76 and 159 HMAD proteins in each G. raimondii, G. arboreum and G. barbadense, respectively (Table S1).
In order to explore the evolutionary relationships of the HMAD gene family, an unrooted phylogenetic tree was constructed using the full length HMAD protein sequences from G. arboreum, G. barbadense, G. raimondii, G. hirsutum (Fig. 1). The HMAD proteins in the four Gossypium species were divided into five groups (I, II, III, IV, Va, Vb, Vc), which the P1B-ATPases HMA5–8 belongs to IV group (Table S3). Additionally, 87 orthologs of HMAD genes (Table 2) were identified in four Gossypium species (I account for 18.39%, II account for 18.39%, III account for 1.15%, IV account for 10.34%, Va account for 1.15%, Vb account for 20.69%, Vc account for 29.89%) (Fig. 1), such as genes Gh_D08G1950 and Gh_A08G2387 of G. hirsutum are orthologs of the Gorai.004G210800.1 and Cotton_A_25987 gene in G. raimondii and G. arboreum, respectively.

A phylogenetic tree of HMAD genes in four Gossypium species. Five clades (I, II, III, IV, Va, Vb, Vc) of HMAD family genes presented between G. arboreum, G.barbadense, G.hirsutum and G.raimondii were emphasized in different colors using ggtree (v2.2.4) packages of R (v4.0.3) software
Chromosomal distribution and syntenic analysis
Physical mapping of the 169 G. hirsutum HMAD genes showed that 79 and 77 HMAD genes were variably distributed on 26 chromosomes of the A and D sub-genomes, respectively (Fig. 2), among which 13 genes localized in scaffold. Additionally, a maximum of 17 and 16 genes were localized on the paralogous chromosome 12 of the A sub-genomes and D sub-genomes. Moreover, there were nine pairs and two gene clusters were marked as tandem duplication based on the criteria of less than five intervening genes. Among these tandem duplication genes, five pairs and two clusters belonged to group Vb except of Gh_D05G1684 - Gh_D05G1685 and Gh_A05G1510 - Gh_A05G1511pairs, which belonged to group III. To study the locus relationship of orthologs between the A and D sub-genomes, we also performed synteny analysis. 72 and 73 HMAD genes were unevenly mapped onto 13 chromosomes of G. arboreum and G. raimondii, respectively. In G. arboreum, each chromosome contained 2–11 HMAD members. Chromosome 12 contained 11 HMAD genes, while chromosome 5 and chromosome 8 had two HMAD genes, respectively. And one gene of G. arboreum on chromosome 12 correspond to Gh_Sca013298G01 in scaffold13298 (Fig. 3). In G. raimondii, the number of each chromosome genes ranged from 1 to 15 HMAD members. Chromosome 8 contained maximum 15 HMAD genes, while chromosome 13 had only one HMAD gene. Otherwise, one gene of G. raimondii on chromosome 6 correspond to Gh_Sca004952G01 in scaffold4952 (Fig. 3). The result of synteny analysis indicated that most of the HMAD genes loci were highly conserved between the A and D sub-genomes respectively (Fig. 3), and 15 genes were lost during evolution, among which 4 in A genome (Cotton_A_04626, Cotton_A_25931, Cotton_A_00150, Cotton_A_35231), 11 in D genome (Gorai.001G250300.1, Gorai.005G218500.1, Gorai.005G220100.1, Gorai.007G134300.1, Gorai.007G295300.1, Gorai.008G005700.1, Gorai.009G162900.1, Gorai.009G199900.1, Gorai.009G414800.1, Gorai.012G027800.1, Gorai.008G245900.1). We surveyed the collinear relationship among the orthologous HMAD genes between G. barbadense and G. hirsutum (Fig. S2). There were 161 pair genes in G. barbadense and G. hirsutum. In G. barbadense, 154 genes (except GB_A01G1916, GB_A03G2039, GB_A04G0061, GB_A12G2848, GB_D05G3226, GB_D07G1125, GB_D12G2855) showed the correspondent relationship among HMAD gene family from A-subgenome, D-subgenome respectively between G. barbadense and G hirsutum (Fig. S2), and 5 genes (GB_A09G0824, GB_D05G1602, GB_D05G1968, GB_D07G0037, GB_D12G0056) were not found the correspondent relationship to HMAD gene family of G. hirsutum. To G. hirsutum, 153 genes (except Gh_A03G1525, Gh_A03G2159, Gh_A05G1511, Gh_A10G2291, Gh_D08G2126, Gh_D12G2433, Gh_A08G0952 with three correspondent relationship) showed the correspondent relationship among HMAD gene family from A-subgenome, D-subgenome respectively between G. hirsutum and G. barbadense (Fig. S2), and 16 genes (Gh_A04G0031, Gh_A05G1510, Gh_A06G1378, Gh_A07G1489, Gh_A07G2000, Gh_A09G0465, Gh_A11G1104, Gh_A12G1537, Gh_D05G1684, Gh_D07G0041, Gh_D07G1640, Gh_D08G0132, Gh_D09G0474, Gh_D10G0078, Gh_D12G0431, Gh_D12G2254) were not found the correspondent relationship to HMAD gene family of G. barbadense. We also found that the HMAD genes located on A02 and A03 chromosomes while their corresponding orthologs were located on D03 and D02 (Table 2), respectively. These results are consistent with the previous research [121], which might be due to the chromosomal translocation between Chr02 and Chr03 before cotton polyploidization forming an allotetraploid [121].
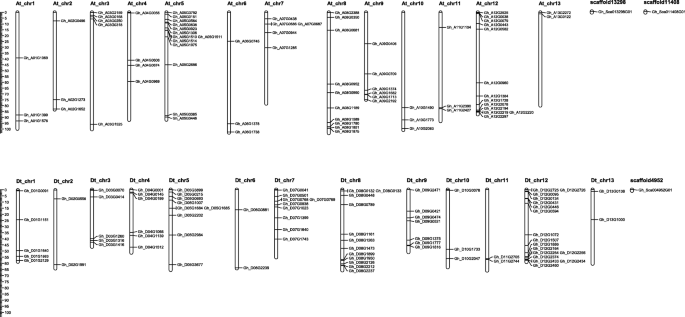
Mapping of the HMAD genes in the chromosomes. Partial HMAD genes localized in scaffolds. White color bar indicated the chromosomes from At and Dt sub genomes of G. hirsutum. At_chr1-At_chr13 represented the chromosomes from At sub genome while Dt_chr1-Dt_chr13 represented the chromosomes from Dt sub genome. Genes’ chromosomal locations calculated from published genome data were presented at the left side of each chromosome of At and Dt sub genome; and corresponding gene names were written at the right of each chromosome of At and Dt sub genome

Genome wide synteny analysis of HMAD genes between G. hirsutum and two diploid cotton species. Collinearity analysis of G. hirsutum (At and Dt) in G. arboreum (A) and G. raimondii (D) genomes. The syntenics were connected by different colored lines. G. hirsutum chromosomes were separated into At and Dt chromosomes. Each genome’s chromosomes were displayed in different colors
Analysis of gene structure and conserved motifs
Gene structure is important to determine its role in showing the phylogenetic relation between the HMAD genes. A NJ tree was generated with MEGA using all the HMAD protein sequences from G. hirsutum and gene structure was determined (Fig. 4). As shown in the Fig. 4, HMAD genes from G. hirsutum were divided into five subclades (group I, group II, group III, group IV, group Va and group Vb, among which, group I contained 13 genes while group II to group Va and group Vb contained 66, 29, 14, 22 and 25 genes, respectively. Furthermore, the analysis of gene structure showed that the introns in the gene structure are particularly variable among of HMAD gene family, which include 5 genes (Gh_D01G1640, Gh_Sca011408G01, Gh_A05G3385 of group I, Gh_D08G1263 and Gh_A08G0990 of group Vb) without intron, 35 genes with 1 intron, 79 genes with 2 introns, 23 genes with 3 introns, 17 genes with 4 introns, one gene (Gh_A05G0564 belonging to P1B-ATPases HMA5) with 7 introns, 3 genes (Gh_D05G0693 belonging to P1B-ATPases HMA5, Gh_A12G0443 belonging to P1B-ATPases HMA7, Gh_D12G0446 belonging to P1B-ATPases HMA7) with 8 introns, one gene (Gh_D07G0041) with 15 introns, 3 genes (Gh_D06G0881 belonging to P1B-ATPases HMA8, Gh_A06G0745 belonging to P1B-ATPases HMA8 and Gh_A03G1525 belonging to P1B-ATPases HMA6) with 16 introns. Gh_D06G0881 and Gh_A06G0745 was divided into cluster I between the four Gossypium species (Fig. 1), and in G. hirsutum (Fig. 4). Gh_A03G1525 was divided into cluster 1 between the four Gossypium species (Fig. 1), whereas it was grouped into cluster II in G. hirsutum (Fig. 4). Gh_A12G0443, Gh_D12G0446, Gh_D05G0693, Gh_A05G0564 was divided into cluster I between the four Gossypium species (Fig. 1), whereas it was grouped into cluster III in G. hirsutum (Fig. 4). Though the number of genes used for generating this phylogenetic tree was different from the phylogenetic tree shown in Fig. 1, the gene members within the subclades were nearly same.

Gene structures of HMAD genes in G. hirsutum. A phylogenetic tree from HMAD protein sequences was constructed with MEGA X using neighbor-joining method. Green blocks and black lines represented exon and intron positions, respectively. And the scale bar is present at the bottom
To investigate the presence of domain sequence and the degree of conservation of the HMAD domain in G. hirsutum, we performed multiple sequence alignment by using the full-length sequences of the HMAD family proteins. The result of different HMAD protein groups indicated that five conserved motifs were identified in the sequences of HMAD family proteins, and the order of motifs on each family protein was not exactly the same (Fig. 5a). In addition, we also analyzed the conserved HMAD domain in all family proteins by multiple sequence alignment, and found a highly conserved motif presence in the domain (Fig. 5b), in which, an anion binding box (CXXC) exist in the catalytic center. Consistent with previous studies [122, 123], the anion binding box with two conserved cysteines as the metal binding.

Logo of conserved motifs in HMAD domain in G. hirsutum. a: Conserved motifs were predicted from MEME (http://meme-suite.org/tools/meme). The length of proteins were estimated using the scale at the bottom. The motifs were displayed in the different colored boxes with various numbers, black line indicated the non-conserved amino acid. b: Logo of conserved motif was predicted from MEME (http://meme-suite.org/tools/meme)
Based on the Ka/Ks ratio, it could be assumed that Darwinian positive selection was linked with the HMAD gene divergence after duplication [124, 125]. In our study, we found that 79 genes pairs had low Ka/Ks ratios (smaller than 0.5) and 24 gene pairs had the Ka/Ks ratios between 0.5 and 1.0. And 13 genes pairs had Ka/Ks larger than 1, might be due to relatively rapid evolution following duplication (Table 2). As most of the Ka/Ks ratios were smaller than 1.0, we presumed that the cotton HMAD gene family had undergone strong purifying selection pressure with limited functional divergence that occurred after segmental duplications and whole genome duplications (WGDs).
Expression profile of HMAD genes across different tissues and different stress conditions in TM-1
To understand the temporal and spatial expression patterns of different HMAD genes, publicly deposited RNA-seq data was used to assess the expression profile across different tissues (root, stem, leaf, torus, petal, stamen, pistil, calycle), developmental stages (−3dpa ovule, −1dpa ovule, 0dpa ovule, 1dpa ovule, 3dpa ovule, 5dpa ovule, 10dpa ovule, 20dpa ovule, 25dpa ovule, 35dpa ovule, 5dpa fiber, 10dpa fiber, 20dpa fiber, 25dpa fiber) and stresses treatment (1 h treated with cold, 3 h treated with cold, 6 h treated with cold, 12 h treated with cold, 1 h treated with hot, 3 h treated with hot, 6 h treated with hot, 12 h treated with hot, 1 h treated with salt, 3 h treated with salt, 6 h treated with salt, 12 h treated with salt, 1 h treated with PEG, 3 h treated with PEG, 6 h treated with PEG, 12 h treated with PEG). Results showed that the 169 genes can be divided into 10 groups, which include cluster 1 with two genes (Gh_A08G1780, Gh_D08G2126), cluster 2 with two genes (Gh_A05G3446, Gh_D04G0145), cluster 3 with just one gene (Gh_A01G1576), cluster 4 with two genes (Gh_D01G1883, Gh_D12G1886), cluster 5 with just one gene (Gh_D03G0414), cluster 6 with just one gene (Gh_D09G0521), cluster 7 with three genes (Gh_A01G1399, Gh_D01G1640 and Gh_Sca011408G01), cluster 8 with two genes (Gh_D04G0001, Gh_Sca013298G01), cluster 9 with four genes (Gh_A12G2296, Gh_D10G2047, Gh_D12G2433 and Gh_D12G2434), cluster 10 with 151 genes (Fig. S3).
In cluster 1, the expression level was higher in torus, ovule development every once day, 25dpa fibers and stresses treatment after 6 h. In cluster 2, the expression level was all high (except petals, −3dpa ovule, −1dpa ovule, 0dpa ovule, 1dpa ovule, 3dpa ovule, 5dpa ovule, 10dpa ovule). In cluster 3, the expression level was higher in calycle tissue and stresses treatment after 1 h, which decreased gradually. In cluster 4, the expression level was higher in calycle tissue, 1 h treated with cold, 1 h treated with hot, 1 h treated with salt, 3 h treated with salt, 1 h treated with PEG, 3 h treated with PEG. In cluster 5, the expression level was higher in root tissue and 1dpa ovule. In cluster 6, the expression level was higher in pistil tissue and ovule development especially at 3dpa, 5dpa and 35dpa. In cluster 7, the expression level was higher in leaf tissue and ovule development especially at -1dpa ovule. In cluster 8, the expression level was higher in root, petal, stamen and pistil. In cluster 9, the expression level was higher in torus tissue, calycle, 6 h treated with hot, 6 h treated with salt and 12 h treated with PEG. In cluster 10, there was the largest number of 151 genes, but most of whose expression level were low or even none. While some genes expression level is different, for example, Gh_D05G1684 highly expressed in the 10dpa in fiber. Interestingly, we found that some HMAD genes highly expressed under stress condition (Fig. 6). For example, Gh_D08G0132 and Gh_A05G1510 highly expressed after 12 h of the salt stress condition, while Gh_A01G1576 highly expressed after 1 h of the stress condition (cold, salt, PEG). Gh_A09G1374, Gh_D09G1375, Gh_D10G0078 expression level increased under stress condition (cold, salt, PEG).

Expression levels of HMAD genes in different tissues and different stress. A phylogenetic tree at left from HMAD protein sequences was constructed with MEGA X using neighbor-joining method. The heatmap at right was generated on the basis of RNA-seq data from the website (http://structuralbiology.cau.edu.cn/gossypium/). The color bar represents the expression values. The color scale was shown at the right of the figure. Higher expression levels were shown in red, and lower in green
Core promoter element analysis
To further explore why HMAD gene family highly expressed under biotic stress condition except heavy metal, the core promoter element of HMAD genes from G. hirsutum were divided into four types (hormone, stress, tissue and others) (Fig. 7), among which, element involved in hormone-responsiveness mainly contained ABA (abscisic acid), GA (gibberellins), IAA/auxin, SA (salicylic acid), MeJA (Methyl jasmonate). Element involved in defense and stress responsiveness mainly contained drought, low-temperature, dehydration, salt stress, anaerobic, among which, 72 genes involved in drought, 51 genes involved in low-temperature responsiveness, 55 genes involved in defense and stress responsiveness with TC-rich repeats element, and 1 gene (Gh_D04G1066) both involved in salt and low-temperature responsiveness. In total, there were 111 genes of 169 HMAD genes with core promoter element responding to stress. As described above in TM-1 RNA-seq data, 12 of the 18 genes were highly expressed with at least one abiotic stress-related promoter element (Table S2). Element involved in tissues including the palisade mesophyll cells, meristem, endosperm, seed-specific. And element involved in other’s function, such as circadian control, cell cycle, flavonoid biosynthetic. It was interesting that 9 of 12 genes with element of flavonoid biosynthetic were along with other’s stress element. In previous study, anthocyanins, as secondary metabolites, may respond to stress resistance through osmotic equilibrium [126,127,128]. For example, Gh_A01G1576 highly expressed after 1 h of the stress condition (cold, salt, PEG), whose core promoter element contained drought-inducibility, low-temperature responsiveness and MBSI promoter element involved in flavonoid biosynthetic genes regulation (Table S2).

Core promoter element. A phylogenetic tree at left from HMAD protein sequences was constructed with MEGA X using neighbor-joining method. The core promoter element at right were generated based on Plant CARE database (http://bioinformatics.psb.ugent.be/webtools/plantcare/html/). AACA_motif: involved in endosperm-specific negative expression.  ABRE: cis-acting element involved in the abscisic acid responsiveness.
  ARE: cis-acting regulatory element essential for the anaerobic induction.
  AT−rich sequence: element for maximal elicitor-mediated activation (2copies).
  AuxRE: part of an auxin-responsive element.
  CAT−box: cis-acting regulatory element related to meristem expression.
  CCAAT−box: MYBHv1 binding site.
  CGTCA−motif: cis-acting regulatory element involved in the MeJA-responsiveness.
  Circadian: cis-acting regulatory element involved in circadian control.
  DRE: cis-acting element involved in dehydration, low-temp, salt stresses.
  GARE−motif: gibberellin-responsive element.
  GC − motif: enhancer-like element involved in anoxic specific inducibility.
  GCN4 − motif: cis-regulatory element involved in endosperm expression.
  HD − Zip 1: element involved in differentiation of the palisade mesophyll cells.
  LTR: cis-acting element involved in low-temperature responsiveness.
  MBS: MYB binding site involved in drought-inducibility.
  MBSI: MYB binding site involved in flavonoid biosynthetic genes regulation.
  MSA − like: cis-acting element involved in cell cycle regulation
  P − box: gibberellin-responsive element.
  RY − element: cis-acting regulatory element involved in seed-specific regulation.
  SARE: cis-acting element involved in salicylic acid responsiveness.
  TATC−box: cis-acting element involved in gibberellin-responsiveness.
  TC − rich repeats: cis-acting element involved in defense and stress responsiveness.
  TCA − element: cis-acting element involved in salicylic acid responsiveness.
  TGA − box: part of an auxin-responsive element.
  TGA − element: auxin-responsive element.
  TGACG−motif: cis-acting regulatory element involved in the MeJA-responsiveness.
  Unnamed_1: 60 K protein binding site.
  WUN − motif: wound-responsive element
The expression level of HMAD gene in different tissues under Na2SO4 stress
To identify the function of HMAD genes under other abiotic stress, we used the material Zhong 9835 [129]. Based on the HMAD gene family of RNA-seq data (Fig. 8) in Zhong 9835 (Table S5), 14 genes significantly expressed differentially in roots, stems and leaves between control and treatment with 300 mM Na2SO4 (Table S4, Fig. S1), in which 10 genes with at least one core promoter element about stress (Table S2). It is interesting to note that 3 of 4 flavonoid biosynthetic element were along with the stress element. More important, some genes highly expressed in both TM-1 and Zhong 9835 under stress condition, such as Gh_D04G0145, Gh_D10G0078, Gh_Sca011408G01, Gh_A01G1576 and so on.

The transcriptome expression levels of HMAD genes in different tissues (root, stem, leaf) between control and treatment with 300 mM Na2SO4. The color bar represents the expression values. The color scale was shown at the right of the figure. Higher expression levels were shown in red, and lower in green
Discussion
In this study, HMAD family genes from G.arboreum (84 genes), G. raimondii (76 genes), G. hirsutum (169 genes), and G. barbadense (159 genes), respectively were identified, which contain the total numbers of HMAD genes in the two diploid cotton (G. arboreum and G. raimondii), as A and D genome donor species, were lower than that in allotetraploid (G. hirsutum and G. barbadense) cotton. Syntenic analysis of the HMAD gene family in four cotton species revealed that 4 genes in G. arboreum and 11 genes in G. raimondii were lost during evolution, while 24 genes appeared in G. hirsutum, showing that these genes played a critical role in cotton evolution. As most of the Ka/Ks ratios were smaller than 1.0, we presumed that the cotton HMAD gene family underwent strong purifying selection pressure with limited functional divergence. These results suggested that there was possible gene loss and/or as a result of chromosome rearrangement during the evolution [121].
169 G. hirsutum genes were identified belonging to the HMAD gene family. The molecular weights (kDa) of 169 HMAD proteins ranged from 5.8 to 108.5 kDa (Table 1). The isoelectric point (pI) of the majority of the 169 HMAD proteins was alkaline except for 55 genes less than 7.6 (Table 1). The various molecular weight and gene sequence length indicated that the physical and chemical properties of HMAD family genes have little difference. Based on the WoLF PSORT analysis, the HMAD family genes are mainly distributed in the chloroplast (62 genes), the cytosol (54 genes), the nucleus (39 genes) and the plasma membrane (11 genes) (Table 1). 169 HMAD genes were divided into five subclasses: I, II, III, IV, Va, Vb, among which the II subclass contained the highest number of genes (66 members) and followed by III subclass (29 members). Structural analysis of the 169 HMAD gene family showed that just 5 genes (Gh_D01G1640, Gh_Sca011408G01, Gh_A05G3385 of group I, Gh_D08G1263 and Gh_A08G0990 of group Vb) contained no intron. While the rest of the HMAD genes contain multiple introns, especially P1B-ATPases HMA5–8 contains most introns than other genes. Among the gene functional annotations of 169 HMAD genes, the number of Heavy metal transport/detoxification superfamily proteins is 116 (Table S5), which are divided into four categories between the phylogeny tree and gene structural. 13 genes pairs had Ka/Ks larger than 1, which includes 13 Heavy metal transport/detoxification superfamily proteins (Gh_A05G2686, Gh_A08G1875, Gh_A10G1490, Gh_A10G2083, Gh_A11G1104, Gh_A12G0038, Gh_A12G0079, Gh_A13G2272, Gh_D05G0215, Gh_D05G2984, Gh_D07G0938, Gh_D08G2237, Gh_D10G1733). Additionally, the signature of four conserved amino acids CXXC for binding metal ions was discovered through sequence alignment [54, 55]. The classified genes and conserved motifs with conserved amino acids CXXC for binding metal ions indicated that 169 HMAD genes may be different response to heavy metals in various organelles, especially some Heavy metal transport/detoxification superfamily proteins under relatively rapid evolution.
Gene expression patterns with the differentiation of promoter regions can provide important insights to gene function [130]. After the RNA-seq data of TM-1 analysis, the most genes of expression level cluster 10 with 151 genes had a lower expression level or none. And after the promoter element analysis of four types (hormone, stress, tissue and others), there were 111 genes of 169 HMAD genes with core promoter element responding to stress. The results showed that 169 HMAD genes were not widely expressed in tissues as well as under stress condition (cold, salt, PEG) (Fig. 6), indicating their critical role in different tissues and stress condition with different promoter elements.
Cotton is half halophytes, and Zhong 9835 was resistance to salt [131], including Na2SO4. Based on the transcriptome data of TM-1, we found that heavy metal transport protein highly expressed under adversity abiotic stress condition. Further, through gene sequences and promoter element analysis, we found that HMAD evolution speed was quickly, which divided into five types of HMAD family, and some of those genes with responding to stress element had a highly expression under adversity abiotic stress condition. According to the analysis of the root, stem and leaf between Na2SO4 treatment and control, 14 genes with stress element significantly expressed differentially (Fig. S1). HMAD highly expressed under salt condition, probably because of ROS caused by ion balance [6]. For example, on the one hand, gene expression in ROS way and ion balance maintenance, such as Ca2+ signaling pathway and MAPK, MYB transcription factor [132, 133], programmed cell death [134, 135]. And then the GSH, as the main way to remove ROS under the condition of high concentration, can not only response to heavy metal ions [136], also can response to salt stress ion [137]. At last, the balance of ions, such as anthocyanins were associated with the salt stress [6]. HMAD with anthocyanins related promoter elements highly expressed under Na2SO4 condition, similar to previous study that anthocyanins involved in resistance to salt, at the same time involved in heavy metal transport [137]. On the other hand, the transfer of heavy metals and salt stress are vacuole segregation [138, 139], such as the P-type ATP as an important role, can not only balance the salt ions and also can balance of heavy metal ions [140, 141].
In additional, HMA genes can selectively absorb and transport metal ions [142]. CtpB, as a plasma membrane copper (I) transporting P-type ATPase of Mycobacterium tuberculosis, is different from copper detoxification [143]. In Mycobacterium tuberculosis, Cu2+, Co2+, Ni2+, Zn2+, Cd2+ and Pb2+ stimulate the ATPase activity of the putative P1B-type ATPase CtpG in the plasma membrane, while Cd2+ more efficiently than other heavy metal cations across the mycobacterial plasma membrane [144]. Chaperone is an important way in delivering Cu to heavy metal P1B-ATPases [143]. In general, HMA contain approximately 6–8 transmembrane helices, a soluble nucleotide binding domain, phosphorylation domain, and a soluble actuator domain, of which HMA1–4 belonging to Zn2+/Co2+/Cd2+/Pb2+ transporting, although HMA1 conserved amino acids is different from the HMA2, HMA3 and HMA4 [143], whereas HMA5–8 belong to the Cu+/Ag+ subclass [144].
The sequences of HMA (Heavy Metal ATPase) of P1B-ATP from G. hirsutum based on the sequences of HMA in A. thaliana, also contained P-ATPases (E1-E2 ATPases) and HAD (halo acid dehydrogenase) domain and HMAD (heavy-metal-associated domain) domain (Table S3). In this study, HMAD gene family contained HMA5-HMA8 (except Gh_A08G2387) (Table S3). HMA5 localized in the plasma membrane, of which Gh_A05G0564, Gh_A08G2388, Gh_D05G0693 with 8 TMHs, while Gh_D08G1950 with 6 TMHs. In HMA6, Gh_A03G1525 with 7 TMHs localized in the plasma membrane, whereas Gh_A04G0969 and Gh_D04G1512 without TMHs localized in the chloroplast. HMA7 and HMA8 localized in the plasma membrane with 8 TMHs and 5 TMHs, respectively. Obviously, in cotton HMA genes evolutionarily adapted quickly in the TM region through the analysis of the sequence, gene structure, Ka/Ks ratio and the phylogenetic tree [144].
Conclusions
In summary, we identified 169, 159, 76 and 84 full-length putative HMAD genes in G. hirsutum, G. barbadense, G. arboreum and G. raimondii, which were much larger than that of the other gene families. We also found that HMAD gene family with promoter elements in response to stress, may plays important roles in different abiotic stress. Our results provided a foundation to further explore the crosstalk of molecular mechanism of HMAD genes under abiotic stress and heavy metal condition.
Methods
Cotton genome and RNA-seq resources
The sequenced genome data and annotation information of four Gossypium species including G. raimondii, (JGI_v2) G. arboreum, (CRI_v1.1) G. hirsutum (NAU-NBI_v1.1) and G. barbadense (ZJU_v1.1) were downloaded from the Cottongen (https://www.cottongen.org/). RNA-seq data for gene expression analysis in G. hirsutum was downloaded from ccNET database (http://structuralbiology.cau.edu.cn/gossypium/), which mainly includes the gene expression data under some stress conditions available in the BioProject database under accession no. PRJNA248163, such as root (SRR1695173), stem (SRR1695174), leaf (SRR1695175), torus (SRR1695176), petal (SRR1695177), stamen (SRR1695178), pistil (SRR1695179), calycle (SRR1695180), −3dpa ovule (SRR1695181), −1dpa ovule (SRR1695182), 0dpa ovule (SRR1695183), 1dpa ovule (SRR1695184), 3dpa ovule (SRR1695185), 5dpa ovule (SRR1695186), 10dpa ovule (SRR1695187), 20dpa ovule (SRR1695188), 25dpa ovule (SRR1695189), 35dpa ovule (SRR1695190), 5dpa fiber (SRR1695191), 10dpa fiber (SRR1695192), 20dpa fiber (SRR1695193), 25dpa fiber (SRR1695194), 1 h treated with cold (SRR1768504), 3 h treated with cold (SRR1768505), 6 h treated with cold (SRR1768506), 12 h treated with cold (SRR1768507), 1 h treated with hot (SRR1768508), 3 h treated with hot (SRR1768509), 6 h treated with hot (SRR1768510), 12 h treated with hot (SRR1768511), 1 h treated with salt (SRR1768512), 3 h treated with salt (SRR1768513), 6 h treated with salt (SRR1768514), 12 h treated with salt (SRR1768515), 1 h treated with PEG (SRR1768516), 3 h treated with PEG (SRR1768517), 6 h treated with PEG (SRR1768518), 12 h treated with PEG (SRR1768519). The raw RNA-Seq data of Zhong 9835, a preserved self-bred line from cultivar of G. hirsutum, about Na2SO4 tolerance generated in this study are available in the BioProject database under accession no. PRJNA703009.
Identification of HMAD domain-containing genes
To identify the HMAD domain-containing genes, the hidden Markov Models (HMM) of HMAD domain (PF00403) was downloaded from Pfam 29.0 database (http://pfam.xfam.org/), then HMMER 3.0 software was used to retrieve the whole genome database of four cotton species by [145] and further identified gene family by pfamscan website (https://www.ebi.ac.uk/Tools/pfa/pfamscan/) and (http://smart.emblheidelberg.de/) SMART (Simple Modular Architecture Research Tool) for confirmation of results. The redundant sequences without HMAD domain were manually checked and then removed. Molecular weight (MW), theoretical isoelectric point (pI), Signal peptide and size of the HMAD were investigated with the online tool ExPASy (http://expasy.org/tools/). Subcellular locations were predicted by software WoLF PSORT (http://wolfpsort.org/). The putative transmembrane helixes were also predicted using TMHMM Server V.2.0 (http://www.cbs.dtu.dk/services/TMHMM/).
Phylogenetic analysis
The multiple sequence alignment of HMAD domain sequence containing genes of four cotton species was accomplished by ClustalX2 software [146] with default parameters. The unrooted phylogenetic tree was constructed by the neighbour joining tree (NJ) in MEGA X software [147] (https://www.megasoftware.net/) with the bootstrap analysis for 1000 iterations and ggtree (v2.2.4) packages [148] of R (v4.0.3) software.
Chromosomal mapping and gene duplication
The physical location data of HMAD genes were retrieved from genome sequence data of four cotton species, and was subsequently used to map these genes using Mapchart-2.23 [149]. Synonymous and non-synonymous rates of evolution were computed using the maximum likelihood method by the Ka/Ks calculator 2.0 [150].
Gene structure and domain analysis
The exon and intron organizations of HMAD genes inferred in the gene structure display server (http://gsds.cbi.pku.edu.cn/) through comparison of genomic and CDS sequences. The conserved motifs in HMAD genes were identified by MEME (http://meme-suite.org/tools/meme) and TBtools-0.6673 [151].
Genome wide synteny analysis of HMAD genes
A BLASTP comparison was used to obtain the pair wise gene information between two allotetraploid cotton species (G. hirsutum and G. barbadense) and two diploid cotton species (G. raimondii and G. arboreum). According to the BLASTP output, the synteny analysis was constructed using circos-0.69-3 software package (http://circos.ca/software/) with default parameters.
Analysis of cis-elements in the promoters
Promoter element sequences extracted from upstream 2000 bp of genes, cis-element were found through Plant CARE database (http://bioinformatics.psb.ugent.be/webtools/plantcare/html/).
RNA-seq between control and treatment with Na2SO4
Zhong 9835, a preserved self-bred line from cultivar of G. hirsutum by our lab, was used for this study. Seeds were sown in sand soil pots. The sand was washed cleanly and sterilized at 121 °C for 8 h. Four seedlings in each pot were cultivated in a 28 °C/16 h light and 25 °C/8 h dark cycle with a light intensity of 150 μmol·m-2·s-1 and 75% relative humidity for approximately 30 days. Then, 300 mM Na2SO4 after 12 h was chosen as the applicable stress concentration and time. Seedlings transplanted into normal water were used as controls. After exposure for 12 h, leaf, stem and whole root samples were collected. Each sample was tested three times. Samples were frozen in liquid nitrogen and stored at − 80 °C.
RNA extraction and qRT-PCR analysis
Total RNA was isolated from root, stem and leaf between control and treatment with 300 mM Na2SO4 in the Zhong 9835 by the EASY spin Plant RNA Kit (TIANGEN). Afterwards, first-strand cDNA was synthesized using Prime Script TM II 1st strand cDNA Synthesis Kit (TaKaRa) according to the manufacturer’s instructions. The qRT-PCR was carried out in 20 μL volume containing 1.4 μL cDNA, 0.8 μL of 10 μM forward and reverse primer, 10 μL SYBR Premix Ex Taq II (2×), and 7.8 μL ddH2O. PCR amplification was performed under the denaturation at 95 °C for 30 s; 40 cycles at 95 °C for 5 s and 60 °C for 30 s; followed by 95 °C for 15 s, 60 °C for 1 min by Bio-Rad CFX96 Real-Time PCR system. qRT-PCR was carried out by the gene-specific primers, Histone3 (AF024716) (F: TCAAGACTGATTTGCGTTTCCA, R: GCGCAAAGGTTGGTGTCTTC) was employed as an internal control. In the end, relative gene expression was quantified using the 2–△△Ct method.
Availability of data and materials
All of the data and materials supporting our research findings are contained in the methods section of the manuscript. Details are provided in the attached Additional files. The datasets generated and/or analysed during the current study are available in the NCBI repository [PRJNA248163 and PRJNA703009].
Abbreviations
- HMAD:
-
Heavy-metal-associated domain
- HMA:
-
Heavy metal ATPase
- DPA:
-
Days post anthesis
- MAPK:
-
Mitogen activated protein kinase
- PCs:
-
Phytochelatins
- MTs:
-
Metallothioneins
- ABC:
-
ATP-binding cassette
- NRAMP:
-
Natural resistance and macrophage protein
- CDF:
-
Cation Diffusion Facilitator
- YSL:
-
Yellow-stripe-like
- HMA4:
-
Heavy metal ATPase 4
- IRT2:
-
Iron-regulated protein 2
- WGDs:
-
Whole genome duplications
References
Manousaki E, Kalogerakis N. Halophytes-an emerging trend in phytoremediation. Int J Phytoremediat. 2011;13(10):959–69. https://doi.org/10.1080/15226514.2010.532241.
Arif N, Yadav V, Singh S, Singh S, Ahmad P, Mishra RK, et al. Influence of high and low levels of plant-beneficial heavy metal ions on plant growth and development. Front Environ Science. 2016;4:69–80.
Lu M, Jiao S, Gao E, Song X, Li Z, Hao X, et al. Transcriptome response to heavy metals in Sinorhizobium meliloti CCNWSX0020 reveals new metal resistance determinants that also promote bioremediation by Medicago lupulina in metal-contaminated soil. Appl Environ Microb. 2017;83(20):e01244–17.
Duan Q, Kita D, Li C, Cheung AY, Wu H. FERONIA receptor-like kinase regulates RHO GTPase signaling of root hair development. Proc Natl Acad Sci. 2010;107(41):17821–6. https://doi.org/10.1073/pnas.1005366107.
Salam LB, Obayori OS, Ilori MO, Amund OO. Effects of cadmium perturbation on the microbial community structure and heavy metal resistome of a tropical agricultural soil. Bioresour Bioprocess. 2020;7:1–19.
Farcasanu IC, Popa CV, Ruta LL. Calcium and cell response to heavy metals: can yeast provide an answer? Calcium Signal Trans. 2018;23:e78941.
Jalmi SK, Bhagat PK, Verma D, Noryang S, Tayyeba S, Singh K, et al. Traversing the links between heavy metal stress and plant signaling. Front Plant Sci. 2018;9:12. https://doi.org/10.3389/fpls.2018.00012.
Emamverdian A, Ding Y, Mokhberdoran F, Xie Y. Heavy metal stress and some mechanisms of plant defense response. Sci World J. 2015;2015:756120.
Chaudhary K, Agarwal S, Khan S. Role of phytochelatins (PCs), metallothioneins (MTs), and heavy metal ATPase (HMA) genes in heavy metal tolerance. In: Mycoremediation and environmental sustainability: Springer; 2018. p. 39–60. http://dx.doi.org/10.1007/978-3-319-77386-5_2.
Yu R, Li D, Du X, Xia S, Liu C, Shi G. Comparative transcriptome analysis reveals key cadmium transport-related genes in roots of two pak choi (Brassica rapa L. ssp. chinensis) cultivars. BMC Genomics. 2017;18(1):1–14.
Xia X, Li J, Zhou Z, Wang D, Huang J, Wang G. High-quality-draft genome sequence of the multiple heavy metal resistant bacterium Pseudaminobacter manganicus JH-7 T. Stand Genomic Sci. 2018;13(1):1–8.
Yu W, Chen X, Sheng Y, Hong Q. Genomic analysis for heavy metal resistance in S. maltophilia. bioRxiv. 2018:404954. https://doi.org/10.1101/404954.
Ghori N, Ghori T, Hayat MQ, Imadi SR, Gul A, Altay V, et al. Heavy metal stress and responses in plants. Int J Environ Sci Te. 2019;16(3):1807–28. https://doi.org/10.1007/s13762-019-02215-8.
Belykh ES, Maystrenko TA, Velegzhaninov IO. Recent trends in enhancing the resistance of cultivated plants to heavy metal stress by transgenesis and transcriptional programming. Mol Biotechnol. 2019;61(10):725–41. https://doi.org/10.1007/s12033-019-00202-5.
Sharma SS, Dietz KJ, Mimura T. Vacuolar compartmentalization as indispensable component of heavy metal detoxification in plants. Plant Cell Environ. 2016;39(5):1112–26. https://doi.org/10.1111/pce.12706.
Kumar SS, Kadier A, Malyan SK, Ahmad A, Bishnoi NR. Phytoremediation and rhizoremediation: uptake, mobilization and sequestration of heavy metals by plants. Plant Micr Interact Agro Ecol Perspect. 2017;367–94. https://doi.org/10.1007/978-981-10-6593-4_15.
Shahid M, Khalid S, Abbas G, Niazi NK, Murtaza B, Rashid MI, et al. Redox mechanisms and plant tolerance under heavy metal stress: genes and regulatory networks. In: Plant Metallomics and Functional Omics: Springer; 2019. p. 71–105. https://doi.org/10.1007/978-3-030-19103-0_5.
Axelsen KB, Palmgren MG. Evolution of substrate specificities in the P-type ATPase superfamily. J Mol Evol. 1998;46(1):84–101. https://doi.org/10.1007/PL00006286.
Zinati Z, Alemzadeh A, KayvanJoo AH. Computational approaches for classification and prediction of P-type ATPase substrate specificity in Arabidopsis. Physiol Mol Biol Pla. 2016;22(1):163–74. https://doi.org/10.1007/s12298-016-0351-5.
Meade JC. P-type transport ATPases in Leishmania and Trypanosoma. Parasite. 2019;26:69. https://doi.org/10.1051/parasite/2019069.
Solioz M, Vulpe C. CPx-type ATPases: a class of P-type ATPases that pump heavy metals. Trends Biochem Sci. 1996;21(7):237–41. https://doi.org/10.1016/S0968-0004(96)20016-7.
Cobbett CS, Hussain D, Haydon MJ. Structural and functional relationships between type 1B heavy metal-transporting P-type ATPases in Arabidopsis. New Phytol. 2003;159(2):315–21. https://doi.org/10.1046/j.1469-8137.2003.00785.x.
Argüello JM, Eren E, González-Guerrero M. The structure and function of heavy metal transport P 1B-ATPases. Biometals. 2007;20(3–4):233–48. https://doi.org/10.1007/s10534-006-9055-6.
Grønberg C, Sitsel O, Lindahl E, Gourdon P, Andersson M. Membrane anchoring and ion-entry dynamics in P-type ATPase copper transport. Biophys J. 2016;111(11):2417–29. https://doi.org/10.1016/j.bpj.2016.10.020.
Longhin E, Grønberg C, Hu Q, Duelli AS, Andersen KR, Laursen NS, et al. Isolation and characterization of nanobodies against a zinc-transporting p-type atpase. Antibodies. 2018;7(4):39. https://doi.org/10.3390/antib7040039.
Smith AT, Ross MO, Hoffman BM, Rosenzweig AC. Metal selectivity of a cd-, co-, and Zn-transporting P1B-type ATPase. Biochemistry-US. 2017;56(1):85–95. https://doi.org/10.1021/acs.biochem.6b01022.
Patel SJ, Lewis BE, Long JE, Nambi S, Sassetti CM, Stemmler TL, et al. Fine-tuning of substrate affinity leads to alternative roles of mycobacterium tuberculosis Fe2+-ATPases. J Biol Chem. 2016;291(22):11529–39. https://doi.org/10.1074/jbc.M116.718239.
Purohit R, Ross MO, Batelu S, Kusowski A, Stemmler TL, Hoffman BM, et al. Cu+-specific CopB transporter: revising P1B-type ATPase classification. Proc Natl Acad Sci. 2018;115(9):2108–13. https://doi.org/10.1073/pnas.1721783115.
Wang X, Gong X, Cao F, Wang Y, Zhang G, Wu F. HvPAA1 encodes a P-Type ATPase, a novel gene for cadmium accumulation and tolerance in barley (Hordeum vulgare L.). Int J Mol Sci. 2019;20(7):1732.
Keeran NS, Ganesan G, Parida AK. A novel heavy metal ATPase peptide from Prosopis juliflora is involved in metal uptake in yeast and tobacco. Transgenic Res. 2017;26(2):247–61. https://doi.org/10.1007/s11248-016-0002-1.
Hussain D, Haydon MJ, Wang Y, Wong E, Sherson SM, Young J, et al. P-type ATPase heavy metal transporters with roles in essential zinc homeostasis in Arabidopsis. Plant Cell. 2004;16(5):1327–39. https://doi.org/10.1105/tpc.020487.
Huang X, Deng F, Yamaji N, Pinson SR, Fujii-Kashino M, Danku J, et al. A heavy metal P-type ATPase OsHMA4 prevents copper accumulation in rice grain. Nat Commun. 2016;7(1):1–13.
Grispen VM, Hakvoort HW, Bliek T, Verkleij JA, Schat H. Combined expression of the Arabidopsis metallothionein MT2b and the heavy metal transporting ATPase HMA4 enhances cadmium tolerance and the root to shoot translocation of cadmium and zinc in tobacco. Environ Exp Bot. 2011;72(1):71–6. https://doi.org/10.1016/j.envexpbot.2010.01.005.
Cong W, Miao Y, Xu L, Zhang Y, Yuan C, Wang J, et al. Transgenerational memory of gene expression changes induced by heavy metal stress in rice (Oryza sativa L.). BMC Plant Biol. 2019;19(1):1–14.
Zhang Y, Chen K, Zhao F, Sun C, Jin C, Shi Y, et al. OsATX1 interacts with heavy metal P1B-type ATPases and affects copper transport and distribution. Plant Physiol. 2018;178(1):329–44. https://doi.org/10.1104/pp.18.00425.
Nosek M, Kaczmarczyk A, Jędrzejczyk RJ, Supel P, Kaszycki P, Miszalski Z. Expression of genes involved in heavy metal trafficking in plants exposed to salinity stress and elevated cd concentrations. Plants. 2020;9(4):475. https://doi.org/10.3390/plants9040475.
Shrivastava M, Khandelwal A, Srivastava S. Heavy metal hyperaccumulator plants: the resource to understand the extreme adaptations of plants towards heavy metals. In: Plant-Metal Interactions: Springer; 2019. p. 79–97. https://doi.org/10.1007/978-3-030-20732-8_5.
Dai W, Wang M, Gong X, Liu JH. The transcription factor fc WRKY 40 of Fortunella crassifolia functions positively in salt tolerance through modulation of ion homeostasis and proline biosynthesis by directly regulating SOS2 and P5CS1 homologs. New Phytol. 2018;219(3):972–89. https://doi.org/10.1111/nph.15240.
Khatiwada B, Hasan MT, Sun A, Kamath KS, Mirzaei M, Sunna A, et al. Probing the role of the chloroplasts in heavy metal tolerance and accumulation in Euglena gracilis. Microorganisms. 2020;8(1):115. https://doi.org/10.3390/microorganisms8010115.
Scheiber IF, Pilátová J, Malych R, Kotabova E, Krijt M, Vyoral D, et al. Copper and iron metabolism in Ostreococcus tauri–the role of phytotransferrin, plastocyanin and a chloroplast copper-transporting ATPase. Metallomics. 2019;11(10):1657–66. https://doi.org/10.1039/C9MT00078J.
Sikder RK, Wang X, Zhang H, Gui H, Dong Q, Jin D, et al. Nitrogen enhances salt tolerance by modulating the antioxidant defense system and osmoregulation substance content in Gossypium hirsutum. Plants. 2020;9(4):450. https://doi.org/10.3390/plants9040450.
Jahan B, AlAjmi MF, Rehman MT, Khan NA. Treatment of nitric oxide supplemented with nitrogen and sulfur regulates photosynthetic performance and stomatal behavior in mustard under salt stress. Physiol Plant. 2020;168(2):490–510.
MacFarlane GR, Burchett MD. Photosynthetic pigments and peroxidase activity as indicators of heavy metal stress in the grey mangrove, Avicennia marina (Forsk.) Vierh. Mar Pollut Bull. 2001;42(3):233–40. https://doi.org/10.1016/S0025-326X(00)00147-8.
Saradhi PP. Proline accumulation under heavy metal stress. J Plant Physiol. 1991;138(5):554–8.
Theriappan P, Gupta AK, Dhasarrathan P. Accumulation of proline under salinity and heavy metal stress in cauliflower seedlings. J Appl Sci Environ Manag. 2011;15(2):251–5.
Gallego SM, Benavides MP, Tomaro ML. Effect of heavy metal ion excess on sunflower leaves: evidence for involvement of oxidative stress. Plant Sci. 1996;121(2):151–9. https://doi.org/10.1016/S0168-9452(96)04528-1.
Davenport SB, Gallego SM, Benavides MP, Tomaro ML. Behaviour of antioxidant defense system in the adaptive response to salt stress in Helianthus annuus L. cells. Plant Growth Regul. 2003;40(1):81–8. https://doi.org/10.1023/A:1023060211546.
Zhang F, Wang Y, Lou Z, Dong J. Effect of heavy metal stress on antioxidative enzymes and lipid peroxidation in leaves and roots of two mangrove plant seedlings (Kandelia candel and Bruguiera gymnorrhiza). Chemosphere. 2007;67(1):44–50. https://doi.org/10.1016/j.chemosphere.2006.10.007.
Dazy M, Masfaraud J, Férard J. Induction of oxidative stress biomarkers associated with heavy metal stress in Fontinalis antipyretica Hedw. Chemosphere. 2009;75(3):297–302. https://doi.org/10.1016/j.chemosphere.2008.12.045.
Siddiqui ZS. Effects of double stress on antioxidant enzyme activity in Vigna radiata (L.) Wilczek. Acta Bot Croat. 2013;72(1):145–56. https://doi.org/10.2478/v10184-012-0011-y.
Soo SJ, Lee KW, Rhee JS, Hwang DS, Lee YM, Park HG, et al. Environmental stressors (salinity, heavy metals and H2O2) modulate expression of glutathione reductase (GR) gene from the intertidal copepod tigriopus japonicus. Aquat Toxicol. 2006;80:281–9.
Reisinger S, Schiavon M, Terry N, Pilon-Smits EA. Heavy metal tolerance and accumulation in Indian mustard (Brassica juncea L.) expressing bacterial γ-glutamylcysteine synthetase or glutathione synthetase. Int J Phytoremediat. 2008;10(5):440–54. https://doi.org/10.1080/15226510802100630.
Kumar S, Asif MH, Chakrabarty D, Tripathi RD, Dubey RS, Trivedi PK. Expression of a rice lambda class of glutathione S-transferase, OsGSTL2, in Arabidopsis provides tolerance to heavy metal and other abiotic stresses. J Hazard Mater. 2013;248:228–37.
Zhou Y, Wen Z, Zhang J, Chen X, Cui J, Xu W, et al. Exogenous glutathione alleviates salt-induced oxidative stress in tomato seedlings by regulating glutathione metabolism, redox status, and the antioxidant system. Sci Hortic-Amsterdam. 2017;220:90–101. https://doi.org/10.1016/j.scienta.2017.02.021.
Barroso C, Romero LC, Cejudo FJ, Vega JM, Gotor C. Salt-specific regulation of the cytosolic O-acetylserine (thiol) lyase gene from Arabidopsis thaliana is dependent on abscisic acid. Plant Mol Biol. 1999;40(4):729–36. https://doi.org/10.1023/A:1006285016296.
Nocito FF, Lancilli C, Crema B, Fourcroy P, Davidian J, Sacchi GA. Heavy metal stress and sulfate uptake in maize roots. Plant Physiol. 2006;141(3):1138–48. https://doi.org/10.1104/pp.105.076240.
Li L, Wang Y, Shen W. Roles of hydrogen sulfide and nitric oxide in the alleviation of cadmium-induced oxidative damage in alfalfa seedling roots. Biometals. 2012;25(3):617–31. https://doi.org/10.1007/s10534-012-9551-9.
Mostofa MG, Saegusa D, Fujita M, Tran LP. Hydrogen sulfide regulates salt tolerance in rice by maintaining Na+/K+ balance, mineral homeostasis and oxidative metabolism under excessive salt stress. Front Plant Sci. 2015;6:1055.
Ostrowski M, Ciarkowska A, Jakubowska A. The auxin conjugate indole-3-acetyl-aspartate affects responses to cadmium and salt stress in Pisum sativum L. J Plant Physiol. 2016;191:63–72. https://doi.org/10.1016/j.jplph.2015.11.012.
Fässler E, Evangelou MW, Robinson BH, Schulin R. Effects of indole-3-acetic acid (IAA) on sunflower growth and heavy metal uptake in combination with ethylene diamine disuccinic acid (EDDS). Chemosphere. 2010;80(8):901–7. https://doi.org/10.1016/j.chemosphere.2010.04.077.
Anuradha S, Rao S. The effect of brassinosteroids on radish (Raphanus sativus L.) seedlings growing under cadmium stress. Plant Soil Environ. 2007;53(11):465.
Sharma P, Kumar A, Bhardwaj R. Plant steroidal hormone epibrassinolide regulate–heavy metal stress tolerance in Oryza sativa L. by modulating antioxidant defense expression. Environ Exp Bot. 2016;122:1–9. https://doi.org/10.1016/j.envexpbot.2015.08.005.
Ke Q, Ye J, Wang B, Ren J, Yin L, Deng X, et al. Melatonin mitigates salt stress in wheat seedlings by modulating polyamine metabolism. Front Plant Sci. 2018;9:914. https://doi.org/10.3389/fpls.2018.00914.
Kaya C, Higgs D, Ashraf M, Alyemeni MN, Ahmad P. Integrative roles of nitric oxide and hydrogen sulfide in melatonin-induced tolerance of pepper (Capsicum annuum L.) plants to iron deficiency and salt stress alone or in combination. Physiol Plantarum. 2020;168(2):256–77.
Siddikee MA, Glick BR, Chauhan PS, Jong Yim W, Sa T. Enhancement of growth and salt tolerance of red pepper seedlings (Capsicum annuum L.) by regulating stress ethylene synthesis with halotolerant bacteria containing 1-aminocyclopropane-1-carboxylic acid deaminase activity. Plant Physiol Bioch. 2011;49(4):427–34. https://doi.org/10.1016/j.plaphy.2011.01.015.
Han Y, Wang R, Yang Z, Zhan Y, Ma Y, Ping S, et al. 1-aminocyclopropane-1-carboxylate deaminase from pseudomonas stutzeri A1501 facilitates the growth of rice in the presence of salt or heavy metals. J Microbiol Biotechn. 2015;25(7):1119–28. https://doi.org/10.4014/jmb.1412.12053.
Song WY, Yang HC, Shao HB, Zheng AZ, Brestic M. The alleviative effects of salicylic acid on the activities of catalase and superoxide dismutase in malting barley (Hordeum uhulgare L.) seedling leaves stressed by heavy metals. CLEAN–Soil, Air, Water. 2014;42(1):88–97. https://doi.org/10.1002/clen.201200310.
Jini D, Joseph B. Physiological mechanism of salicylic acid for alleviation of salt stress in rice. Rice Sci. 2017;24(2):97–108. https://doi.org/10.1016/j.rsci.2016.07.007.
Ghafoor MF, Ali Q, Malik A. Effects of salicylic acid priming for salt stress tolerance in wheat. Biol Clin Sci Res J. 2020;2020(1):e24.
Saxena I, Shekhawat GS. Nitric oxide (NO) in alleviation of heavy metal induced phytotoxicity and its role in protein nitration. Nitric Oxide. 2013;32:13–20. https://doi.org/10.1016/j.niox.2013.03.004.
He J, Ren Y, Chen X, Chen H. Protective roles of nitric oxide on seed germination and seedling growth of rice (Oryza sativa L.) under cadmium stress. Ecotox Environ Safe. 2014;108:114–9. https://doi.org/10.1016/j.ecoenv.2014.05.021.
Imran QM, Falak N, Hussain A, Mun B, Sharma A, Lee S, et al. Nitric oxide responsive heavy metal-associated gene AtHMAD1 contributes to development and disease resistance in Arabidopsis thaliana. Front Plant Sci. 2016;7:1712.
Kim Y, Khan AL, Kim D, Lee S, Kim K, Waqas M, et al. Silicon mitigates heavy metal stress by regulating P-type heavy metal ATPases, Oryza sativa low silicon genes, and endogenous phytohormones. BMC Plant Biol. 2014;14(1):1–13.
Zhu Z, Wei G, Li J, Qian Q, Yu J. Silicon alleviates salt stress and increases antioxidant enzymes activity in leaves of salt-stressed cucumber (Cucumis sativus L.). Plant Sci. 2004;167(3):527–33. https://doi.org/10.1016/j.plantsci.2004.04.020.
Farhangi-Abriz S, Torabian S. Antioxidant enzyme and osmotic adjustment changes in bean seedlings as affected by biochar under salt stress. Ecotox Environ Safe. 2017;137:64–70. https://doi.org/10.1016/j.ecoenv.2016.11.029.
Abd El-Mageed TA, Rady MM, Taha RS, Abd El Azeam S, Simpson CR, Semida WM. Effects of integrated use of residual sulfur-enhanced biochar with effective microorganisms on soil properties, plant growth and short-term productivity of Capsicum annuum under salt stress. Sci Hortic-Amsterdam. 2020;261:108930. https://doi.org/10.1016/j.scienta.2019.108930.
Wang C, Chen Q, Xiang N, Liu Y, Kong X, Yang Y, et al. SIP1, a novel SOS2 interaction protein, is involved in salt-stress tolerance in Arabidopsis. Plant Physiol Bioch. 2018;124:167–74. https://doi.org/10.1016/j.plaphy.2018.01.018.
Kong J, Jin J, Dong Q, Qiu J, Li Y, Yang Y, et al. Maize factors ZmUBP15, ZmUBP16 and ZmUBP19 play important roles for plants to tolerance the cadmium stress and salt stress. Plant Sci. 2019;280:77–89. https://doi.org/10.1016/j.plantsci.2018.11.014.
Shu K, Qi Y, Chen F, Meng Y, Luo X, Shuai H, et al. Salt stress represses soybean seed germination by negatively regulating GA biosynthesis while positively mediating ABA biosynthesis. Front Plant Sci. 2017;8:1372. https://doi.org/10.3389/fpls.2017.01372.
Deng B, Yang K, Zhang Y, Li Z. Can heavy metal pollution defend seed germination against heat stress? Effect of heavy metals (Cu2+, Cd2+ and Hg2+) on maize seed germination under high temperature. Environ Pollut. 2016;216:46–52. https://doi.org/10.1016/j.envpol.2016.05.050.
Shekhawat UKS, Srinivas L, Ganapathi TR. MusaDHN-1, a novel multiple stress-inducible SK 3-type dehydrin gene, contributes affirmatively to drought-and salt-stress tolerance in banana. Planta. 2011;234(5):915–32. https://doi.org/10.1007/s00425-011-1455-3.
Hu T, Zhu S, Tan L, Qi W, He S, Wang G. Overexpression of OsLEA4 enhances drought, high salt and heavy metal stress tolerance in transgenic rice (Oryza sativa L.). Environ Exp Bot. 2016;123:68–77. https://doi.org/10.1016/j.envexpbot.2015.10.002.
Zhang Y, Wang Z, Chai T, Wen Z, Zhang H. Indian mustard aquaporin improves drought and heavy-metal resistance in tobacco. Mol Biotechnol. 2008;40(3):280–92. https://doi.org/10.1007/s12033-008-9084-1.
Hu W, Yuan Q, Wang Y, Cai R, Deng X, Wang J, et al. Overexpression of a wheat aquaporin gene, TaAQP8, enhances salt stress tolerance in transgenic tobacco. Plant Cell Physiol. 2012;53(12):2127–41. https://doi.org/10.1093/pcp/pcs154.
Janicka-Russak M, Kabała K, Burzyński M, Kłobus G. Response of plasma membrane H+-ATPase to heavy metal stress in Cucumis sativu s roots. J Exp Bot. 2008;59(13):3721–8. https://doi.org/10.1093/jxb/ern219.
Yao J, Shen Z, Zhang Y, Wu X, Wang J, Sa G, et al. Populus euphratica WRKY1 binds the promoter of H+-ATPase gene to enhance gene expression and salt tolerance. J Exp Bot. 2020;71(4):1527–39. https://doi.org/10.1093/jxb/erz493.
Neumann D, Lichtenberger O, Günther D, Tschiersch K, Nover L. Heat-shock proteins induce heavy-metal tolerance in higher plants. Planta. 1994;194(3):360–7.
Montero-Barrientos M, Hermosa R, Cardoza RE, Gutierrez S, Nicolas C, Monte E. Transgenic expression of the Trichoderma harzianum HSP70 gene increases Arabidopsis resistance to heat and other abiotic stresses. J Plant Physiol. 2010;167(8):659–65. https://doi.org/10.1016/j.jplph.2009.11.012.
Huang C, Zhou J, Jie Y, Xing H, Zhong Y, Yu W, et al. A ramie bZIP transcription factor BnbZIP2 is involved in drought, salt, and heavy metal stress response. DNA Cell Biol. 2016;35(12):776–86. https://doi.org/10.1089/dna.2016.3251.
Kim Y, Kang H, Ahn S. Overexpression of phytochelatin synthase AtPCS2 enhances salt tolerance in Arabidopsis thaliana. J Plant Physiol. 2019;240:153011. https://doi.org/10.1016/j.jplph.2019.153011.
Mekawy AMM, Assaha DV, Munehiro R, Kohnishi E, Nagaoka T, Ueda A, et al. Characterization of type 3 metallothionein-like gene (OsMT-3a) from rice, revealed its ability to confer tolerance to salinity and heavy metal stresses. Environ Exp Bot. 2018;147:157–66. https://doi.org/10.1016/j.envexpbot.2017.12.002.
Wang J, Yao L, Li B, Meng Y, Ma X, Lai Y, et al. Comparative proteomic analysis of cultured suspension cells of the halophyte Halogeton glomeratus by iTRAQ provides insights into response mechanisms to salt stress. Front Plant Sci. 2016;7:110.
Sarowar S, Kim YJ, Kim EN, Kim KD, Hwang BK, Islam R, et al. Overexpression of a pepper basic pathogenesis-related protein 1 gene in tobacco plants enhances resistance to heavy metal and pathogen stresses. Plant Cell Rep. 2005;24(4):216–24. https://doi.org/10.1007/s00299-005-0928-x.
Jain S, Kumar D, Jain M, Chaudhary P, Deswal R, Sarin NB. Ectopic overexpression of a salt stress-induced pathogenesis-related class 10 protein (PR10) gene from peanut (Arachis hypogaea L.) affords broad spectrum abiotic stress tolerance in transgenic tobacco. Plant Cell, Tissue and Organ Culture (PCTOC). 2012;109(1):19–31.
Moons A. Ospdr9, which encodes a PDR-type ABC transporter, is induced by heavy metals, hypoxic stress and redox perturbations in rice roots. FEBS Lett. 2003;553(3):370–6. https://doi.org/10.1016/S0014-5793(03)01060-3.
Kim DY, Bovet L, Maeshima M, Martinoia E, Lee Y. The ABC transporter AtPDR8 is a cadmium extrusion pump conferring heavy metal resistance. Plant J. 2007;50(2):207–18. https://doi.org/10.1111/j.1365-313X.2007.03044.x.
Kim DY, Jin JY, Alejandro S, Martinoia E, Lee Y. Overexpression of AtABCG36 improves drought and salt stress resistance in Arabidopsis. Physiol Plant. 2010;139(2):170–80. https://doi.org/10.1111/j.1399-3054.2010.01353.x.
Singh AK, Kumar R, Pareek A, Sopory SK, Singla-Pareek SL. Overexpression of rice CBS domain containing protein improves salinity, oxidative, and heavy metal tolerance in transgenic tobacco. Mol Biotechnol. 2012;52(3):205–16. https://doi.org/10.1007/s12033-011-9487-2.
Kaur V, Yadav SK, Wankhede DP, Pulivendula P, Kumar A, Chinnusamy V. Cloning and characterization of a gene encoding MIZ1, a domain of unknown function protein and its role in salt and drought stress in rice. Protoplasma. 2020;257(2):475–87. https://doi.org/10.1007/s00709-019-01452-5.
Zheng S, Liu S, Feng J, Wang W, Wang Y, Yu Q, et al. Overexpression of a stress response membrane protein gene OsSMP1 enhances rice tolerance to salt, cold and heavy metal stress. Environ Exp Bot. 2021;182:104327. https://doi.org/10.1016/j.envexpbot.2020.104327.
Asif S, Ali Q, Malik A. Evaluation of salt and heavy metal stress for seedling traits in wheat. Biol Clin Sci Res J. 2020;2020:e5.
Taghipour M, Jalali M. Impact of some industrial solid wastes on the growth and heavy metal uptake of cucumber (Cucumis sativus L.) under salinity stress. Ecotox Environ Safe. 2019;182:109347. https://doi.org/10.1016/j.ecoenv.2019.06.030.
Bharti N, Singh RP. Antagonistic effect of sodium chloride to differential heavy metal toxicity regarding biomass accumulation and nitrate assimilation in Sesamum indicum seedlings. Phytochemistry. 1994;35(5):1157–61. https://doi.org/10.1016/S0031-9422(00)94813-1.
Leblebici Z, Aksoy A, Duman F. Influence of salinity on the growth and heavy metal accumulation capacity of Spirodela polyrrhiza (Lemnaceae). Turk J Biol. 2011;35(2):215–20.
Ain Q, Akhtar J, Amjad M, Haq MA, Saqib ZA. Effect of enhanced nickel levels on wheat plant growth and physiology under salt stress. Commun Soil Sci Plan. 2016;47(22):2538–46. https://doi.org/10.1080/00103624.2016.1254796.
Wang W, Ke Cheng L, Hao JW, Guan X, Tian X. Phytoextraction of initial cutting of Salix matsudana for cd and cu. Int J Phytoremediat. 2019;21(2):84–91. https://doi.org/10.1080/15226514.2016.1183574.
Hou W, Chen X, Song G, Wang Q, Chang CC. Effects of copper and cadmium on heavy metal polluted waterbody restoration by duckweed (Lemna minor). Plant Physiol Bioch. 2007;45(1):62–9. https://doi.org/10.1016/j.plaphy.2006.12.005.
Mohammad A, Mittra B. Effects of inoculation with stress-adapted arbuscular mycorrhizal fungus Glomus deserticola on growth of Solanum melogena L. and Sorghum sudanese staph. Seedlings under salinity and heavy metal stress conditions. Arch Agron Soil Sci. 2013;59(2):173–83. https://doi.org/10.1080/03650340.2011.610029.
Nawaz I, Iqbal M, Bliek M, Schat H. Salt and heavy metal tolerance and expression levels of candidate tolerance genes among four extremophile Cochlearia species with contrasting habitat preferences. Sci Total Environ. 2017;584:731–41.
Mukherjee P, Mitra A, Roy M. Halomonas rhizobacteria of Avicennia marina of Indian sundarbans promote rice growth under saline and heavy metal stresses through exopolysaccharide production. Front Microbiol. 2019;10:1207. https://doi.org/10.3389/fmicb.2019.01207.
Wang M, Zhao S, Wang L, Chen S, Li S, Lei X, et al. Salt stress-induced changes in microbial community structures and metabolic processes result in increased soil cadmium availability. Sci Total Environ. 2021;782:147125. https://doi.org/10.1016/j.scitotenv.2021.147125.
Wiszniewska A, Koźmińska A, Hanus-Fajerska E, Dziurka M, Dziurka K. Insight into mechanisms of multiple stresses tolerance in a halophyte Aster tripolium subjected to salinity and heavy metal stress. Ecotox Environ Safe. 2019;180:12–22. https://doi.org/10.1016/j.ecoenv.2019.04.059.
Topal MN, Kıran S, Ateș Ç, Ekİcİ M, Ellİaltıoğlu TR, Furtana GB, et al. A comparative study with commercial rootstocks to determine the tolerance to heavy metal (Pb) in the drought and salt stress tolerant eggplant breeding lines. Derim. 2017;34(1):1–10.
Feng S, Ren L, Sun H, Qiao K, Liu S, Zhou A. Morphological and physiological responses of two willow species from different habitats to salt stress. Sci Rep-Uk. 2020;10(1):1–11.
Malik WA, Wang X, Wang X, Shu N, Cui R, Chen X, et al. Genome-wide expression analysis suggests glutaredoxin genes response to various stresses in cotton. Int J Biol Macromol. 2020;153:470–91. https://doi.org/10.1016/j.ijbiomac.2020.03.021.
Li M, Zhang X, Yang H, Li X, Cui Z. Soil sustainable utilization technology: mechanism of flavonols in resistance process of heavy metal. Environ Sci Pollut R. 2018;25(26):26669–81. https://doi.org/10.1007/s11356-018-2485-1.
Zhang T, Hu Y, Jiang W, Fang L, Guan X, Chen J, et al. Sequencing of allotetraploid cotton (Gossypium hirsutum L. acc. TM-1) provides a resource for fiber improvement. Nat Biotechnol. 2015;33(5):531–7. https://doi.org/10.1038/nbt.3207.
Sutkovic J, Kekić M, Ljubijankić M, Glamočlija P. An insilico approach for structural and functional analysis of heavy metal associated (HMA) proteins in Brassica oleracea. Period Eng Nat Sci. 2016;4(2):41–59.
Li C, Sun Y, Liu H, Zeng Q, Wang Y, Ma J, et al. Genetic variation analysis of heavy metal ATPase-like gene in rice. Southwest China J Agric Sci. 2016;29(9):2009–15.
Wu Y, Li X, Chen D, Han X, Li B, Yang Y, et al. Comparative expression analysis of heavy metal ATPase subfamily genes between cd-tolerant and cd-sensitive turnip landraces. Plant Diversity. 2019;41(4):275–83. https://doi.org/10.1016/j.pld.2019.02.001.
Yang Z, Gong Q, Qin W, Yang Z, Cheng Y, Lu L, et al. Genome-wide analysis of WOX genes in upland cotton and their expression pattern under different stresses. BMC Plant Biol. 2017;17(1):1–17.
Bull PC, Cox DW. Wilson disease and Menkes disease: new handles on heavy-metal transport. Trends Genet. 1994;10(7):246–52. https://doi.org/10.1016/0168-9525(94)90172-4.
Gitschier J, Moffat B, Reilly D, Wood WI, Fairbrother WJ. Solution structure of the fourth metal-binding domain from the Menkes copper-transporting ATPase. Nat Struct Biol. 1998;5(1):47–54. https://doi.org/10.1038/nsb0198-47.
Prince VE, Pickett FB. Splitting pairs: the diverging fates of duplicated genes. Nat Rev Genet. 2002;3(11):827–37. https://doi.org/10.1038/nrg928.
Vandepoele K, Simillion C, Van de Peer Y. Evidence that rice and other cereals are ancient aneuploids. Plant Cell. 2003;15(9):2192–202. https://doi.org/10.1105/tpc.014019.
Kovinich N, Kayanja G, Chanoca A, Otegui MS, Grotewold E. Abiotic stresses induce different localizations of anthocyanins in Arabidopsis. Plant Signal Behav. 2015;10(7):e1027850. https://doi.org/10.1080/15592324.2015.1027850.
Trojak M, Skowron E. Role of anthocyanins in high-light stress response. World Sci News. 2017;81(2):150–68.
Gao J, Chen B, Lin H, Liu Y, Wei Y, Chen F, et al. Identification and characterization of the glutathione S-transferase (GST) family in radish reveals a likely role in anthocyanin biosynthesis and heavy metal stress tolerance. Gene. 2020;743:144484. https://doi.org/10.1016/j.gene.2020.144484.
Wang Q, Lu X, Chen X, Malik WA, Wang D, Zhao L, et al. Transcriptome analysis of upland cotton revealed novel pathways to scavenge reactive oxygen species (ROS) responding to Na2SO4 tolerance. Sci Rep-Uk. 2021;11(1):8670. https://doi.org/10.1038/s41598-021-87999-x.
Xue T, Wang D, Zhang S, Ehlting J, Ni F, Jakab S, et al. Genome-wide and expression analysis of protein phosphatase 2C in rice and Arabidopsis. BMC Genomics. 2008;9(1):1–21.
Wang X, Lu X, Malik WA, Chen X, Wang J, Wang D, et al. Differentially expressed bZIP transcription factors confer multi-tolerances in Gossypium hirsutum L. Int J Biol Macromol. 2020;146:569–78. https://doi.org/10.1016/j.ijbiomac.2020.01.013.
Wan S, Wang W, Zhou T, Zhang Y, Chen J, Xiao B, et al. Transcriptomic analysis reveals the molecular mechanisms of Camellia sinensis in response to salt stress. Plant Growth Regul. 2018;84(3):481–92. https://doi.org/10.1007/s10725-017-0354-4.
Xu W, Huang W. Calcium-dependent protein kinases in phytohormone signaling pathways. Int J Mol Sci. 2017;18(11):2436. https://doi.org/10.3390/ijms18112436.
Yang Y, Guo Y. Unraveling salt stress signaling in plants. J Integr Plant Biol. 2018;60(9):796–804. https://doi.org/10.1111/jipb.12689.
Arzani A. Manipulating programmed cell death pathways for enhancing salinity tolerance in crops. In: Salinity Responses and Tolerance in Plants, vol. 2: Springer; 2018. p. 93–118. https://doi.org/10.1007/978-3-319-90318-7_5.
Han M, Lu X, Yu J, Chen X, Wang X, Malik WA, et al. Transcriptome analysis reveals cotton (Gossypium hirsutum) genes that are differentially expressed in cadmium stress tolerance. Int J Mol Sci. 2019;20(6):1479. https://doi.org/10.3390/ijms20061479.
Wei Y, Xu Y, Lu P, Wang X, Li Z, Cai X, et al. Salt stress responsiveness of a wild cotton species (Gossypium klotzschianum) based on transcriptomic analysis. PLoS One. 2017;12(5):e178313.
Zhang W, Wang P, Bao Z, Ma Q, Duan L, Bao A, et al. SOS1, HKT1; 5, and NHX1 synergistically modulate Na+ homeostasis in the halophytic grass Puccinellia tenuiflora. Front Plant Sci. 2017;8:576.
Maeshima M. Vacuolar H+-pyrophosphatase. Biochimica et Biophysica Acta (BBA)-Biomembranes. 2000;1465(1–2):37–51.
Kim H, Lim B, Kim B, Lee Y. Effects of heavy metals on transcription and enzyme activity of Na+/K+-ATPase in the monogonont rotifer, Brachionus koreanus. Toxicol Environ Heal Sci. 2016;8(2):128–34. https://doi.org/10.1007/s13530-016-0270-4.
Vera-Estrella R, Gómez-Méndez MF, Amezcua-Romero JC, Barkla BJ, Rosas-Santiago P, Pantoja O. Cadmium and zinc activate adaptive mechanisms in Nicotiana tabacum similar to those observed in metal tolerant plants. Planta. 2017;246(3):433–51. https://doi.org/10.1007/s00425-017-2700-1.
Beneš V, Leonhardt T, Sácký J, Kotrba P. Two P1B-1-ATPases of amanita strobiliformis with distinct properties in cu/ag transport. Front Microbiol. 2018;9:747. https://doi.org/10.3389/fmicb.2018.00747.
León-Torres A, Arango E, Castillo E, Soto CY. CtpB is a plasma membrane copper (I) transporting P-type ATPase of mycobacterium tuberculosis. Biol Res. 2020;53(1):1–13.
López M, Quitian L, Calderón M, Soto C. The P-type ATPase CtpG preferentially transports Cd2+ across the mycobacterium tuberculosis plasma membrane. Arch Microbiol. 2018;200(3):483–92. https://doi.org/10.1007/s00203-017-1465-z.
Finn RD, Clements J, Eddy SR. HMMER web server: interactive sequence similarity searching. Nucleic Acids Res. 2011;39(suppl_2):W29–37.
Larkin MA, Blackshields G, Brown NP, Chenna R, McGettigan PA, McWilliam H, et al. Clustal W and Clustal X version 2.0. Bioinformatics. 2007;23(21):2947–8. https://doi.org/10.1093/bioinformatics/btm404.
Kumar S, Stecher G, Li M, Knyaz C, Tamura K. MEGA X: molecular evolutionary genetics analysis across computing platforms. Mol Biol Evol. 2018;35(6):1547–9. https://doi.org/10.1093/molbev/msy096.
Yu G. Using ggtree to visualize data on tree-like structures. Curr Protoc Bioinformatics. 2020;69(1):e96. https://doi.org/10.1002/cpbi.96.
Voorrips RE. MapChart: software for the graphical presentation of linkage maps and QTLs. J Hered. 2002;93(1):77–8. https://doi.org/10.1093/jhered/93.1.77.
Wang D, Zhang Y, Zhang Z, Zhu J, Yu J. KaKs_Calculator 2.0: a toolkit incorporating gamma-series methods and sliding window strategies. Genomics Proteomics Bioinformatics. 2010;8(1):77–80. https://doi.org/10.1016/S1672-0229(10)60008-3.
Chen C, Chen H, He Y, Xia R. TBtools, a toolkit for biologists integrating various biological data handling tools with a user-friendly interface. BioRxiv. 2018;289660. https://doi.org/10.1101/289660.
Acknowledgements
We are grateful to Bingbing Zhang, who provided technical assistance.
Funding
This work was supported by grants from National key research and development program (2016ZX08005004–005). The funding bodies were not involved in the design of the study; collection, analysis, or interpretation of data; or manuscript writing.
Author information
Authors and Affiliations
Contributions
WY and QW conceived the research; XL and XC prepared the plant materials; LZ and MH performed the experiments and data analysis; SW, YZ and YF conducted the bioinformatic analysis. QW wrote the manuscript; WY revised the manuscript. All authors have read and approved the manuscript.
Corresponding author
Ethics declarations
Ethics approval and consent to participate
Not applicable.
Consent for publication
Not applicable.
Competing interests
The authors declare that they have no competing interest.
Additional information
Publisher’s Note
Springer Nature remains neutral with regard to jurisdictional claims in published maps and institutional affiliations.
Supplementary Information
Additional file 1
: Fig. S1. Expression profiles of qRT-PCR of HMAD genes between control and treatment with 300 mM Na2SO4 among root, stem and leaf. The expression patterns of 31 HMAD genes in Zhong 9835 between control and treatment. qRT-PCR was conducted to analyze the relative expression of 31 HMAD genes in root, stem, leaf. R represents root, S represents stem, L represents leaf. CK_R represents root with control, SS_R represents root with treatment. CK_S represents stem with control, SS_S represents stem with treatment. CK_L represents leaf with control, SS_L represents leaf with treatment.
Additional file 2
: Fig. S2. The synteny and collinearity analysis of HMAD genes between G.barbadense and G.hirsutum. A01-A13 represented the chromosomes from At sub genome while D01-D13 represented the chromosomes from Dt sub genome. The Arabic numerals (1–3) at G.hirsutum in bars represented scaffold4952, scaffold11408, scaffold13298, respectively.
Additional file 3
: Fig. S3. Expression levels of HMAD genes in different tissues and different stress. The heatmap was generated on the basis of RNA-seq data from the website (http://structuralbiology.cau.edu.cn/gossypium/). The color bar represents the expression values. The color scale was shown at the right of the figure. Higher expression levels were shown in red, and lower in green.
Additional file 4
: Table S1. The information of HMAD proteins in four Gossypium spp.
Additional file 5
: Table S2. Analysis of high-expression gene with cis-elements.
Additional file 6
: Table S3. The information of P1B-ATPases proteins between Gossypium_hirsutum and A. thaliana.
Additional file 7
: Table S4. Primers of qRT-PCR used in this study.
Additional file 8
: Table S5. The information of transcriptome data of HMAD genes between control and treatment with 300 mM Na2SO4.
Rights and permissions
Open Access This article is licensed under a Creative Commons Attribution 4.0 International License, which permits use, sharing, adaptation, distribution and reproduction in any medium or format, as long as you give appropriate credit to the original author(s) and the source, provide a link to the Creative Commons licence, and indicate if changes were made. The images or other third party material in this article are included in the article's Creative Commons licence, unless indicated otherwise in a credit line to the material. If material is not included in the article's Creative Commons licence and your intended use is not permitted by statutory regulation or exceeds the permitted use, you will need to obtain permission directly from the copyright holder. To view a copy of this licence, visit http://creativecommons.org/licenses/by/4.0/. The Creative Commons Public Domain Dedication waiver (http://creativecommons.org/publicdomain/zero/1.0/) applies to the data made available in this article, unless otherwise stated in a credit line to the data.
About this article

Cite this article
Wang, Q., Lu, X., Chen, X. et al. Genome-wide identification and function analysis of HMAD gene family in cotton (Gossypium spp.). BMC Plant Biol 21, 386 (2021). https://doi.org/10.1186/s12870-021-03170-8
Received:
Accepted:
Published:
DOI: https://doi.org/10.1186/s12870-021-03170-8