
Abstract
Background
Moso bamboo, the fastest growing plant on earth, is an important source for income in large areas of Asia, mainly cultivated in China. Lateral organ boundaries domain (LBD) proteins, a family of transcription factors unique to plants, are involved in multiple transcriptional regulatory pathways and play important roles in lateral organ development, pathogen response, secondary growth, and hormone response. The LBD gene family has not previously been characterized in moso bamboo (Phyllostachys edulis).
Results
In this study, we identified 55 members of the LBD gene family from moso bamboo and found that they were distributed non-uniformly across its 18 chromosomes. Phylogenetic analysis showed that the moso bamboo LBD genes could be divided into two classes. LBDs from the same class share relatively conserved gene structures and sequences encoding similar amino acids. A large number of hormone response–associated cis-regulatory elements were identified in the LBD upstream promoter sequences. Synteny analysis indicated that LBDs in the moso bamboo genome showed greater collinearity with those of O. sativa (rice) and Zea mays (maize) than with those of Arabidopsis and Capsicum annuum (pepper). Numerous segmental duplicates were found in the moso bamboo LBD gene family. Gene expression profiles in four tissues showed that the LBD genes had different spatial expression patterns. qRT–PCR assays with the Short Time-series Expression Miner (STEM) temporal expression analysis demonstrated that six genes (PeLBD20, PeLBD29, PeLBD46, PeLBD10, PeLBD38, and PeLBD06) were consistently up-regulated during the rapid growth and development of bamboo shoots. In addition, 248 candidate target genes that function in a variety of pathways were identified based on consensus LBD binding motifs.
Conclusions
In the current study, we identified 55 members of the moso bamboo transcription factor LBD and characterized for the first time. Based on the short-time sequence expression software and RNA-seq data, the PeLBD gene expression was analyzed. We also investigated the functional annotation of all PeLBDs, including PPI network, GO, and KEGG enrichment based on String database. These results provide a theoretical basis and candidate genes for studying the molecular breeding mechanism of rapid growth of moso bamboo.
Background
Moso bamboo (Phyllostachys edulis) is a non-timber forestry species from the subfamily Bambusoideae (Poaceae) that is native to Asia [1]. It has a wide distribution, a high economic value, and a broad range of industrial uses, and it plays an important role in soil and water conservation and climate regulation because of its propensity for fast growth [2]. The ability of moso bamboo shoots to undergo “burst growth” has gradually gained the attention of researchers and motivated investigations into the molecular mechanisms that underlie this rapid growth [3, 4]. However, the molecular mechanisms underlying the rapid growth of moso bamboo shoots are still unclear.
Transcription factors (TFs) regulation controls many important plant developmental processes such as cell morphogenesis, signal transduction, and environmental stress response by affecting gene expression [5]. Among them, the Lateral Organ Boundaries Domain (LBD) gene family, also known as AS2/LOB, is a class of TFs found only in higher plants. It was first identified through the insertion of enhancer traps and is expressed at the base of the proximal axis of the primary lateral organ of Arabidopsis [6, 7]. LBD TFs contain three specific conserved structural domains arranged from the N to the C terminus: the zinc finger-like C-block (C-block), the Gly-Ala-Ser-block (GAS-block), and the leucine-like zipper module (LX6LX3LX6L). The C-block contains four highly conserved cysteine motifs (CX2CX6CX3C), which are necessary for binding DNA. The GAS-block is located in the middle of the LOB structural domain and contains an invariant glycine residue. The leucine-like zipper module, consisting of about 30 amino acids at the C terminus, is involved in protein dimerization [8]. Based on the characteristics of the LOB structural domain, previous studies have divided the LBD gene family into two classes: class I and class II. Class I proteins contain both the conserved CX2CX6CX3C zinc finger-like motif and the leucine zipper module. By contrast, class II proteins contain only the conserved zinc finger-like structural domain [6, 7, 9]. However, recent studies have further subdivided class I into five subclasses, Ia–Ie, and class II into two subclasses, IIa and IIb [10, 11]. In addition, a variable C-terminal region occurs immediately after the leucine-like zipper module of the conserved LOB structural domain. This region can regulate the expression of downstream genes and is associated with nuclear targeting [12]. The LOB structural domain and the variable C terminus together form the expression structure of LBD genes [13].
Studies have shown that the LOB structural domain is involved not only in the regulation of early lateral organ development but also in additional processes such as tissue regeneration and responses to stress and pathogen infestation [14,15,16]. Expression of Arabidopsis AtLOB/AtASL4 was first observed specifically at the base of the proximal axis of the lateral organ [6]. Iwakawa et al. found that AtLBD6 (AtAS2) inhibited cell proliferation in the axial region through regulation of the KNOX gene, causing the leaf proximal-distal axis to develop symmetrically, forming spreading leaves. It also forms a negative feedback loop with AS1 and JAG to regulate lateral organ inflorescence development [7, 14, 15]. TFs ARF7 and ARF19 are expressed by cellular dedifferentiation process and act downstream of LBD16 and LBD18 to participate in the formation of Arabidopsis lateral roots [17]. AtLBD15 regulates WUS expression and is involved in apical meristem cell differentiation [18]. AtLBD38, AtLBD39, and AtLBD40 inhibited anthocyanin biosynthesis and also affected the nitrogen response [19], and OsLBD37, a homolog of this gene in rice, is also involved in nitrogen metabolism [20]. AtLBD20 was the first gene identified to regulate the jasmonic acid (JA) signaling pathway, which plays a part in the response to plant pathogen Fusarium oxysporum [21]. Recent studies have shown that STLBD2–6 is consistently highly expressed in potato stems under drought stress, suggesting that this gene may be associated with stem protection during drought [11].
The recent release of moso bamboo draft genome and chromosome level reference genome is the great potential for enabling genetic manipulation of the bamboo gene family [22, 23]. Based on the rapid development of genome sequencing technology, the identification of LBD TF genes has been reported in plants such as Oryza sativa [13], Brassica napus [24], Gossypium raimondii [25], Vitis vinifera [26], Solanum tuberosum [11], maize [27], and Physcomitrella patens [28]. The specific molecular functions of the LBDs have been validated in the model plants Arabidopsis and rice. LBD TFs have, however, not yet been characterized in moso bamboo. Thus, our present work aimed to identify all LBD family members of moso bamboo from the latest genomic database and to provide a comprehensive analysis of the protein characteristics, evolutionary relationships, conserved structures, repeat patterns, tissue specificity, and shoot rapid growth expression trends of PeLBDs. Our findings provide a theoretical basis for future studies on the functions of moso bamboo LBD genes and reveal their molecular mechanisms in rapid shoot growth.
Results
Identification of LBD genes in Moso bamboo
Fifty-nine putative LBD candidate genes were obtained from an HMMER3 search of the bamboo protein database using the plant LBD-type LOB model (Pfam PF03195) with an E-value threshold of ≤10− 20. We removed redundant genes and verified the presence of conserved domains and motifs to arrive at a final set of 55 LBD family members (Table 1). The genes were renamed PeLBD01–PeLBD55 based on their positions on the chromosomal scaffolds.
Proteins encoded by the 55 LBD genes contained 95 (PeLBD13) to 493 (PeLBD20) amino acids, and their molecular weights (MWs) ranged from 10.25 (PeLBD13) to 52.67 kDa (PeLBD20). Approximately 80% of the LBD proteins had MWs of 20–30 kDa. Their predicted isoelectric point (pI) ranged from 4.78 (PeLBD55) to 9.44 (PeLBD25). Instability index calculations predicted that 51 (95%) of the LBD proteins were unstable in vitro. PeLBD09, PeLBD24, and PeLBD35 had instability indices less than 40 and were classified as stable proteins. Aliphatic amino acid indices showed that the thermal stability of the proteins ranged from 55.701 to 92.67, indicating that differences in their thermal stability were relatively minor. The grand average of hydropathicity (GRAVY) score was negative for 47 (86%) of the LBD proteins, demonstrating that they were predominantly hydrophilic. Cell-PLoc subcellular localization predictions suggested that almost all LBD proteins were located in the nucleus (Table 1).
Phylogenetic analysis and conserved sequence alignment
To clarify the evolutionary relationships between moso bamboo PeLBD proteins and LBD proteins of other species, an Maximum Likelihood (ML) phylogenetic tree was constructed using the amino acid sequences of 55 moso bamboo LBDs, 36 rice LBDs, and 43 Arabidopsis LBDs (Fig. 1). Based on well-established Arabidopsis and rice LBD family classifications [13], the LBD proteins were classified into two major groups, class I and class II. Class I had 112 members: 29, 44, and 39 in rice (25.9%), moso bamboo (39.3%), and Arabidopsis (34.8%), respectively. Class II had 24 members: 6, 11, and 7 in rice (25%), moso bamboo (44%), and Arabidopsis (28%), respectively. Class I could be subdivided into five subclasses (Ia–Ie), and class II could be subdivided into IIa and IIb. Subclass Ia had the most members (34), and subclass IIa had the fewest (10). Each species contained members of each subclass, indicating that all seven subclasses were present among both monocots and dicots. Phylogenetic relationships indicated that the LBD proteins of moso bamboo showed greater homology to those of rice than to those of Arabidopsis.

Phylogenetic analysis of full-length LBD protein sequences from Phyllostachys edulis (Pe, moso bamboo), Arabidopsis thaliana (At, Arabidopsis), and Oryza sativa (Os, rice). MUSCLE was used to build a multiple sequence alignment, and MEGA7.0 was used to construct a maximum likelihood (ML) phylogenetic tree with 1000 bootstrap replicates. White circles, green check marks, and black stars indicate bamboo, Arabidopsis, and rice sequences, respectively
The number of LBD genes in moso bamboo (55) was similar to that in maize (44), S. tuberosum (43), and Arabidopsis (43) but significantly different from that in B. napus (126), and mosses (31). Compared to class II, class I had more members in the different species (Supplemental Fig. 1).
Multiple sequence alignments were created for the 55 PeLBD proteins to investigate the presence and locations of conserved protein domains. All LBD family members contained a highly conserved LOB region at the N terminus, which consisted of approximately 100 amino acids (Fig. 2a). Multiple sequence comparisons showed that all LBD proteins contained the zinc finger-like structural domain (Fig. 2b). By contrast, the leucine zipper-like structural domain was only present in class I PeLBD proteins, similar to results from other plant species.

Conserved domains of the moso bamboo PeLBD proteins. a The CX2CX6CX3C zinc finger-like domain was present in all 55 predicted PeLBD protein sequences, whereas the leucine zipper-like motif (LX6LX3LX6L) was present only in the class I PeLBD proteins. b Sequence alignment of two protein domains by MUSCLE and conserved motif logos generated by the WebLogo program
Gene structure and motif composition analysis
To further investigate the evolutionary relationships among the moso bamboo PeLBDs, we constructed a second phylogenetic tree using only the full-length PeLBD protein sequences. This analysis confirmed that class I was divided into five subclasses, Ia, Ib, Ic, Id, and Ie, with 18, 5, 3, 13, and 5 members, respectively. Class II was divided into two subclasses IIa and IIb, which had 5 and 6 members (Fig. 3a). We identified six highly conserved motifs in each LBD protein using MEME (Fig. 3b and Supplemental Fig. 2). Almost all LBDs contained motif 1 and motif 2, and these constituted the most highly conserved part of the LOB domain. The relative positions of motifs were similar in most sequences, with the exception of PeLBD20 in subclass IIa, which had an extra set of motifs 1, 2, and 4. Interestingly, some motifs were detected only in specific subfamilies. For example, motif 6 and motif 5 were only found in subclasses Ia and IIb, respectively.

The phylogenetic relationships, conserved motifs, and gene structures of PeLBD proteins and PeLBD genes. a An Maximum Likelihood (ML) phylogenetic tree of the moso bamboo proteins was constructed from full-length sequences in MEGA 7.0 with 1000 bootstrap replicates. b Distribution of conserved motifs in the PeLBD proteins. The colored boxes represent motifs 1–6. The scale bar indicates 100 aa. c The gene structures of the PeLBD genes, including introns (black lines), exons (yellow rectangles), and untranslated region (UTRs, green rectangles). The scale bar indicates 0.5 kb
The number of introns in each moso bamboo LBD gene ranged from one to four (Fig. 3c). About 70% of the genes contained one intron, nine genes contained two introns, five genes contained three introns, and one gene contained four introns (PeLBD37). The structures of LBD genes on the same phylogenetic branch were generally similar.
Analysis of cis-elements in PeLBD promoters
The cis-acting elements are non-coding DNA sequences in gene promoters that regulate the transcription of their associated genes. We identified ten important cis-acting elements 1500 bp upstream of the moso bamboo PeLBD genes using PlantCARE software (Fig. 4). Numerous cis-elements in the PeLBD promoters were associated with the response to hormones: abscisic acid (ABRE), MeJA (CGTCA-motif), gibberellic acid (GARE-motif), salicylic acid (TCA-element), and auxin (TGA-element). Some promoters contained stress-related elements, particularly TC-rich repeats involved in defense and stress response and low temperature response (LTR)-related elements. Interestingly, all LBD promoters contained MYB binding site involved in the induction of drought, high salt, and low temperature responses. MYB was the most abundant element (> 200). In addition, the light-responsive element (LRE) was present in the promoters of 28 PeLBD genes (Fig. 4 and Supplemental Fig. 3). These results suggest that the expression of LBD genes in moso bamboo is regulated by cis-elements associated with plant developmental processes and abiotic stress tolerance.

Diagram of cis-acting elements identified in the 1500-bp upstream promoter regions of the moso bamboo PeLBD genes. Rectangular boxes of different colors represent individual cis-acting elements, and some elements overlap with one another
Chromosomal location and Synteny analysis
The moso bamboo PeLBD genes were non-uniformly distributed across the 18 chromosome scaffolds of moso bamboo (Fig. 5). The largest number were found on scaffolds 14 and 21 (8, 14.54%), followed by scaffolds 15 (7, 12.72%), 16 (6, 10.90%), 9 and 13 (5, 9%), 22 (3, 5.45%), and 12 and 18 (2, 3.63%). All other chromosomes contained a single PeLBD gene. Small gene clusters were found on scaffolds 15 and 21, based on the definition of gene clusters.

Chromosomal distribution and inter-chromosomal relationships of PeLBD genes. Red lines connect duplicate PeLBD gene pairs
Gene duplication events are prevalent in all species; they can give rise to new functional genes and drive species evolution [29]. We therefore used MCScanX genome synteny analysis to explore duplications within the moso bamboo LBD gene family (Fig. 5). Twenty-six gene pairs appeared to have arisen from segmental duplications, and 42 (76%) of the PeLBD genes were replicated and retained after whole genome duplications (WGDs).
Evolutionary analysis of the PeLBD genes
To further investigate gene duplications in the LBD gene family, we performed genome-to-genome synteny analysis between moso bamboo and four representative plants: two dicots (Arabidopsis and pepper) (Fig. 6a) and two monocots (rice and maize) (Fig. 6b). Fourteen, 11, 58, and 60 moso bamboo LBD genes were syntenic with those of Arabidopsis, pepper, rice, and maize, respectively. There was, therefore, greater collinearity between the bamboo and monocot genomes than between the bamboo and dicot genomes. Furthermore, the rice LBD genes all had corresponding orthologs in moso bamboo, and most of them had more than two orthologs, suggesting that moso bamboo has undergone additional WGD event(s) during its evolution.

Synteny analysis of the moso bamboo genome with two monocot (a) and two dicot (b) plant genomes. The gray lines represent aligned blocks between the paired genomes, and the red lines indicate syntenic LBD gene pairs
To investigate evolutionary constraints and selection pressures on the PeLBD genes, we calculated Ka, Ks, and Ka/Ks for 17 homologous PeLBD gene pairs (Supplemental Table 1). Ks represents the background base substitution rate, and Ks values can, therefore, be used to predict the timing of whole genome duplications (WGD)events. The Ks values of the PeLBD gene pairs ranged from 0.0718 to 0.2392, indicating that a large-scale PeLBD gene duplication event occurred as early as 18.40 million years ago (MYA) and as recently as 5.52 MYA. The Ka/Ks values of the gene pairs were all less than 1.0, and these genes may therefore have undergone strong purifying selection during evolution.
Expression patterns of PeLBDs in different tissues
We used published transcriptome data to explore the expression patterns of PeLBD genes in four different tissues: roots, rhizomes, panicles, and leaves. Gene expression was calculated as Transcripts Per Kilobase Million (TPM). The results showed that 55 PeLBD genes had significantly different expression patterns among tissues (Fig. 7). Fifteen PeLBD genes had detectable expression in all tissues, suggesting that they participate in the development or physiology of multiple tissues. Four genes (PeLBD12, PeLBD44, PeLBD30, and PeLBD22) were apparently highly expressed in panicles, suggesting that they may be involved in the development and function of bamboo flowers. Specially, PeLBD12 and PeLBD33 were highly abundant in roots (TPM > 100). Interestingly, subclass three Ic members were not expressed in any tissues, suggesting potential functional redundancy among subclass Ic PeLBDs. By contrast, six members of subclass IIb appeared to be expressed in all tissues, suggesting that they may have important functions in tissue growth. In summary, the results of transcriptome sequencing analysis confirm that PeLBD genes was significantly differentially expressed in a variety of tissues.

Expression heatmap of log2 (TPM + 1) values of 55 moso bamboo PeLBD genes in four different tissues: roots, rhizomes, panicles, and leaves. Based on the phylogenetic results (Fig. 2a), the LBD gene family was divided into seven subgroups: classes Ia–Ie and classes IIa and IIb. Red indicates high expression, and blue indicates low expression
To verify the reliability of the transcriptome data, we also used qRT–PCR to further validate the expression of 12 PeLBD genes in four tissues: roots, rhizomes, panicles, and leaves (Fig. 8). Genes such as PeLBD20 and PeLBD29 were expressed in all organs, indicating that they may play a general role in the growth process. Among the same genes, LBDs were moderately expressed in the rhizomes compared to other tissues. However, some genes showed tissue-specific expression patterns. For example, PeLBD22, PeLBD44, PeLBD25, and PeLBD29 were highly expressed in the panicles, and PeLBD09, PeLBD20, PeLBD49, and PeLBD35 were highly expressed in the leaves. PeLBD20 and PeLBD49 had slightly lower expression in roots than in other tissues. Notably, PeLBD33 was highly expressed only in the roots, suggesting that it may be a root-specific gene. Overall, the qRT–PCR results supported the results of the transcriptome sequencing analysis.
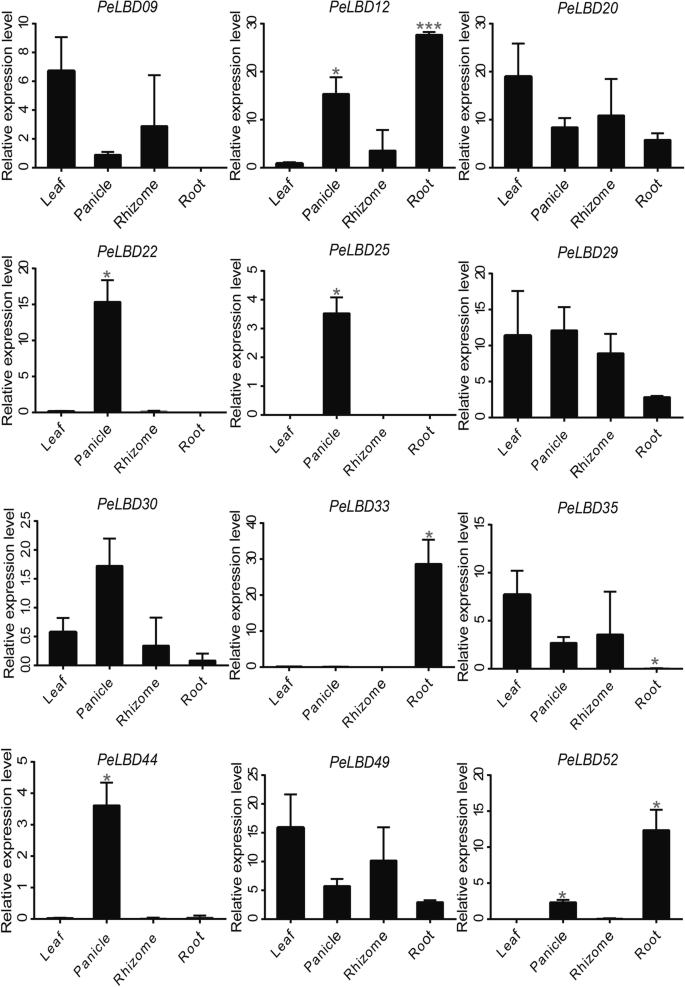
qRT–PCR analysis of 12 genes in four moso bamboo tissues (roots, rhizomes, panicles, and leaves). All experiments were performed independently at least three times. Error bars represent the standard deviation of three replicates. Asterisks indicate significant differences in transcript levels compared with those of leaf. (*P < 0.05, **P < 0.01, ***P < 0.001)
Identification of genes associated with rapid development in bamboo shoots
To investigate the function of PeLBD genes in the rapid developmental pathway of shoots, we performed trend analysis of LBD gene expression profiles using the Short Time-series Expression Miner (STEM) software based on expression data from shoots of different ages/growth heights (0.2–6 m) during the fast growth period. A total of 10 expression trends were identified (Fig. 9a). The trend of significant enrichment (profile 9) showed a positive correlation with shoot development, suggesting that the genes in this profile were gradually upregulated during shoot growth. Six genes (PeLBD20, PeLBD29, PeLBD46, PeLBD10, PeLBD38, and PeLBD06) were assigned to profile 9, and their expression was generally upregulated during shoot development (i.e., it increased with increasing growth height) (Fig. 9b).

Time series expression analysis of moso bamboo PeLBD genes in shoots of different ages/growth heights. a Trend analysis graphs produced by the STEM algorithm. Each graph shows a gene expression change trend; the values in the upper and lower left corners indicate the number of genes assigned to the profile and the corresponding P-value. The line represents the trend in target gene expression over time. Only the red profile (profile 9) is significant. b Expression changes of the six genes in profile nine
To further validate the results of the STEM analysis, we further performed qRT–PCR for the six genes (see above) whose expression increased significantly during the rapid growth and development of bamboo shoots (Fig. 10). With the exception of PeLBD46, the genes all showed a general increase in expression with shoot developmental stage, although there were differences in the magnitude and timing of this increase. PeLBD06 showed a significant increase in expression that peaked in 3 m shoots; PeLBD29 showed the highest expression in 0.2 m shoots but then slowly rose again as shoots increased in height from 0.5 to 6 m. As lignification of bamboo shoots increased during later growth stages, the expression of PeLBD20 and PeLBD38 showed the strongest positive correlation with rapid shoot development, unlike the other four genes. Overall, the qRT–PCR results supported the results of the STEM temporal clustering analysis, which suggested that these PeLBD genes might play an important role in the rapid growth, development, and lignification of bamboo shoots.
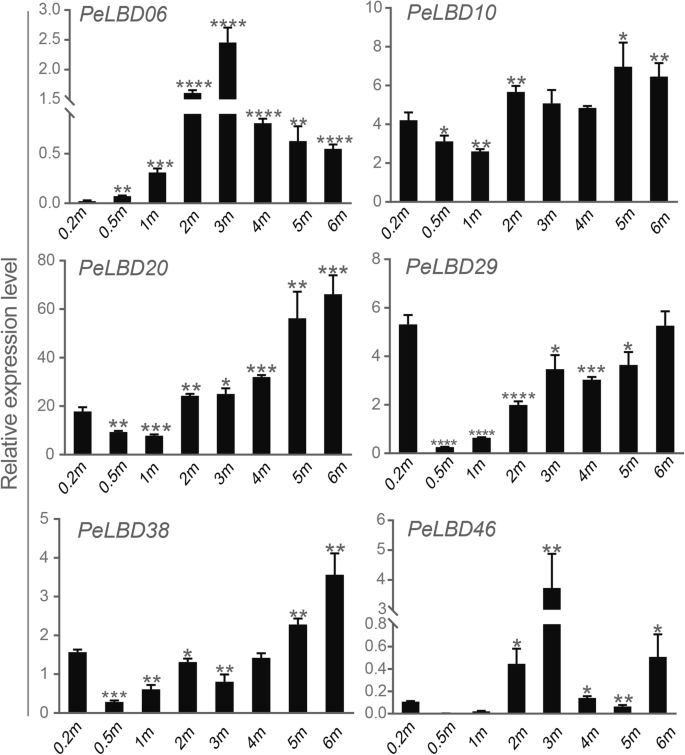
RT–qPCR analysis of six PeLBD genes whose expression was previously shown to increase in shoots of increasing height. All experiments were performed independently at least three times, and the data are expressed as the mean ± standard deviation (SD). Asterisks indicate significant differences in transcript levels compared with those of 0.2 m shoots. (*P < 0.05, **P < 0.01, ***P < 0.001, ****P < 0.0001)
Construction of a PPI network and GO enrichment analysis
We used the STRING database to predict potential interactions among the PeLBD proteins (Fig. 11). There were 17 nodes in the PeLBD protein interaction network, each of which interacted with other nodes. Some proteins exhibited direct interactions, such as PeLBD49 and PeLBD39, whereas others exhibited more complex multigene interactions, such as PeLBD25, PeLBD55, and PeLBD47. Notably, PeLBD20 and PeLBD27 were predicted to be central nodes, radiating eight and nine connections to other genes, respectively.

Protein–Protein Interaction (PPI) network of significant genes in moso bamboo. Nodes represent proteins, central nodes are indicated in red, and black lines indicate interactions between nodes. The darker the color, the more important the protein in the interaction network
To predict their biological functions, we performed GO annotation and enrichment analysis of the 55 PeLBD proteins. The top 20 GO terms are shown in Fig. 12. The strongest enrichment and the highest enrichment factor (0.58) were observed for the process of leaf morphogenesis, followed by the process of petal development (0.33). In addition, the largest number of genes (19) was associated with the GO term “developmental process.”

The top 20 enriched GO terms of the PeLBD genes. The horizontal axis indicates the enrichment factor, and the size of the circle indicates the number of genes annotated with a given GO term
Identification and annotation of PeLBD target genes
To identify the potential downstream target genes regulated by bamboo LBDs and determine their functions, consensus LBD motifs from the JASPAR database (Supplemental Fig. 4) were used to search the 2.0-kb promoter sequences upstream of the moso bamboo protein-coding genes. A total of 248 target genes were identified for further annotation and were classified into three major classes and 32 subclasses. Among the 248 genes, 89 received GO annotations, and 107 were mapped to the KEGG database. GO analysis showed that the terms cell part (GO:0044464), metabolic process (GO:0008152), and catalytic activity (GO:0003824) were assigned to many target genes (Supplemental Fig. 5). Among the top 20 GO terms enriched in the target gene set were ethanol metabolic process (GO:0006067), cell membrane fraction (GO:0016020), organonitrogen compound metabolic process (GO:1901564), and other significantly enriched terms (P < 0.05) (Fig. 13a). Likewise, in the KEGG analysis, the largest number of target genes (112) were assigned to the carbohydrate metabolism pathway (Supplemental Fig. 6). Among the top 20 KEGG pathways enriched in the target genes were fatty acid degradation (Ko00071), plant-pathogen interaction (Ko04326), folate biosynthesis (Ko00790), and mRNA surveillance pathway (Ko03015). These results suggest that PeLBDs can influence multiple pathways by regulating their target genes (Fig. 13b).

The top 20 GO terms (a) and KEGG pathways (b) enriched of candidate PeLBD target genes. The black circles indicate the number of target genes, and different colors indicate the P-value, ranging from 0 to 0.12
Discussion
At present, the chromosome level reference genome of moso bamboo enables the comprehensive characterization of important gene families [22, 23]. Here, we identified 55 PeLBD genes from moso bamboo and divided them into two classes, class I (44, 80%) and class II (11, 20%) (Fig. 3a). These two classes were further divided into different subclasses. Previous studies found that 86% of the LBD genes in Arabidopsis and 88% of those in potato belonged to class I [11, 13] (Supplemental Fig. 1). Our results provide further evidence that the number of class I LBD members is substantially higher than that of class II members in different species. One hundred thirty-four LBD genes from several species were further classified into seven subclasses (Ia–Ie and IIa–IIb), and their phylogenetic relationships were generally consistent with those reported in previous studies [30, 31] (Fig. 1). Many homologous PeLBD gene pairs were expressed at similar levels (Fig. 7), suggesting that duplication of LBD genes in moso bamboo may have mainly led to functional redundancy.
Gene structure analysis revealed that some members within the same subclass have structural differences. For example, the number of introns in PeLBD genes from subclass Ia varies from 1 to 3. We speculate that members of subclass Ia may have undergone splicing or insertion of gene fragments during evolution [32, 33]. Nevertheless, the similar conserved sequences and gene structures within LBD subclasses suggest that genes within a subclass may generally have similar biological functions. Furthermore, comparisons of the LOB conserved structural domains showed that the complete leucine-like zipper motif was detected in all class I genes except PeLBD13, PeLBD18, and PeLBD55, suggesting that motifs in the LBD family are broadly conserved during evolution.
Multiple cis-acting elements located in gene promoters play a crucial role in signaling, and synergistic interactions among them can regulate complex biological processes. AtLBD16 and AtLBD29 have been reported to be involved in the growth hormone response and lateral root formation [34, 35]. AtLBD20 (AtASL21) functions in plant disease resistance mediated by the jasmonate signaling pathway [21]. We found that the LBD promoters contained numerous motifs related to hormone regulation pathways, including those of abscisic acid, MeJA, and IAA. Thus, we conclude that PeLBD genes may also participate in the plant stress response. Interestingly, all PeLBD gene promoters have MYB elements that are involved in drought-inducibility, and MYB elements were the most common cis-elements detected (Supplemental Fig. 3). There are few previous studies on the response of LBD genes to abiotic stress, but recent work in potato has confirmed that the expression levels of StLBD1–5 and StLBD2–6 are down-regulated and up-regulated, respectively, under drought stress to maintain normal physiological functions [11]. Furthermore, members of the potato LBD family also contain numerous MYB elements. A part of MYB genes have been genetically transformed in Arabidopsis, wheat and rice, and it was confirmed that overexpression of MYB genes could improve the drought resistance of transgenic plants [36,37,38]. Overall, we suggest that bamboo LBDs may play an important role in the response to abiotic stresses, particularly drought. Nonetheless, the specific expression patterns of different LBD genes remain to be verified by further molecular biology experiments.
Gene duplication plays an important role in evolution by facilitating the generation of new genes and gene functions. There are three main evolutionary modes of gene duplication [39]: segmental duplication, tandem duplication, and translocation events. Segmental and tandem duplication most commonly underlie the expansion of plant gene families [39, 40]. Moso bamboo contains 55 LBD genes, 12 more than Arabidopsis, and has 1.27, 1.52, 1.25, 1.27, and 0.80 times as many LBD genes as Arabidopsis (43), rice (36), maize (44), potato (43), and G. raimondii (68), respectively. Although the genome size of moso bamboo (2051.7 Mb) is similar to that of its close relative, maize (2066.4 Mb), the number of LBD genes is significantly higher in Moso bamboo, consistent with previous reports of a WGD in moso bamboo [22, 41]. We therefore performed intra- and inter-genomic collinearity analyses of the LBDs. The moso bamboo genome has 28 pairs of duplicated LBD genes, including 26 segmentally duplicated pairs and 2 tandem duplicated pairs and segmental duplicates dominate the expansion of the LBD gene family in moso bamboo. Similarly, a previous study reported only three tandem repeat events among 131 G. hirsutum LBD genes [25]. Synteny analysis of the moso bamboo genome with four other sequenced plant genomes showed that there was significant collinearity of LBD family members between bamboo and the monocots maize and rice. Only a few LBD members were collinear between bamboo and the dicots Arabidopsis and pepper. This result is consistent with the evolutionary relationship between dicot and monocot plants.
Although LBD genes have been shown to be downstream genes of a series of transcriptional regulatory networks. However, to date, little research has been done on the regulation of downstream target genes by the TF LBD genes, which induce transcription important in the process of cell dedifferentiation E2Fa, which enhances the formation of healing tissue [42]. In Arabidopsis, LOB/AS2 differentiates stem tips into leaf primordia to form leaves by repressing the expression of KNAT2 and KNAT6 [14, 43]. The GO enrichment results of the identified target genes suggest that PeLBDs may influence multiple regulatory pathways by regulating their target genes. Among the top 20 GO terms, two target genes, PH02Gene50093 and PH02Gene50387, were not only significantly enriched as molecular functions of S-(hydroxymethyl) glutathione dehydrogenase activity but also involved in biological processes such as ethanol metabolism (Supplementary Table 2). Also, significantly enriched were several target genes such as PH02Gene21014, PH02Gene43347 and PH02Gene43347 associated with the composition of the membrane. These results suggest that target genes regulated by PeLBDs can function through multiple pathways.
Several studies have shown that LBDs regulate lateral organ development and have important effects on plant organs during flower, stem, leaf, and root formation [14, 44, 45], consistent with the results of GO enrichment analysis studies. More than half of the top 20 enriched GO terms in the LBDs were related to plant organ development and formation, among which morphogenic functions involving petal development and leaves were the most significant. LBD gene expression profiles were analyzed in different bamboo tissues, and many PeLBDs showed relatively high expression levels in specific tissues (Fig. 7). For example, PeLBD12 and PeLBD33 were highly expressed in roots, and their functions may be similar to that of AS2, which participates directly in the differentiation of stem tip meristematic tissues into leaf primordia in rice, a closely related species. Some PeLBD genes were minimally expressed in all the tissues tested, suggesting that they may function in other tissues or at other developmental stages. Interestingly, we found that two genes (PeLBD20 and PeLBD29) were not only highly expressed in the four tissue organs but also detected a consistently elevated expression trend in 0.2–6 m shoots (Fig. 10). This result suggests that PeLBD20 and PeLBD29 play an important role in rapid bamboo development. The qRT–PCR was used to further validate the expression of 12 PeLBD genes that were expressed at various levels in roots, rhizomes, panicles, and leaves. Among them, we validated a leaf-specific gene, PeLBD33, and a flower-specific gene, PeLBD25. Overall, the qRT–PCR results differed only slightly from those of the transcriptome sequencing analysis, perhaps due to variations in experimental conditions. Based on these results, we speculate that the PeLBD genes play a key role in the tissue development of bamboo.
Early studies on the LBD gene family focused on the biological role of these genes in the development of lateral organs in plants. For example, AtLOB/AtASL4 was first shown to be specifically expressed at the base of the proximal axis of lateral organs and at the base of lateral roots in Arabidopsis [6]. The LBD gene family, together with a variety of TFs, forms multiple molecular regulatory networks that are important for plant response to environmental stress and regulation of growth and development and other physiological processes [46]. After stimulation of healing tissue cells by growth hormone signals, lysine methyltransferase (ATXR2) promotes cells to enter the dedifferentiation stage. Subsequently, the TFs ARF7 and ARF19 recruit ATXR2, which in turn combines with the promoter of LBD genes to induce the expression of genes LBD16, LBD17, LBD18 and LBD29 during cell dedifferentiation. LBD genes then regulate E2Fa, an important TF in cell dedifferentiation, thereby enhancing the formation of healing tissue [42]. In this study, we focused on the expression of PeLBD genes during the rapid growth of bamboo shoots. We performed temporal clustering analysis using gene Transcriptome data and identified six genes (PeLBD20, PeLBD29, PeLBD46, PeLBD10, PeLBD38, and PeLBD06) whose expression was strongly positively associated with the rapid growth and development of bamboo shoots. The expression levels of these six genes were verified by qRT–PCR (Fig. 10). Their expression tended to increase as the lignification of bamboo shoots increased during growth, with PeLBD20 and PeLBD38 showing the most significant positive correlation. It is hypothesized that they play important biological functions in the rapid growth stage of moso bamboo. These results not only strongly suggested the involvement of LBDs in the lignification process during rapid growth of bamboo shoots but also provided potential candidate genes for future research on bamboo growth and development.
Conclusions
This is the first systematic identification and analysis of LBD TFs in Moso bamboo. We identified a total of 55 PeLBD genes, which can be classified into two classes and seven subclasses. Each subclass has similar gene structure and sequence, indicating that LBD genes are conserved during evolution. Evolutionary analyses indicated that segmental duplications associated with WGD events were responsible for most of the expansion of the Mauve LBD gene family. Based on the STEM version software and RNA-seq data, the tissue and temporal specificity of PeLBD gene expression was revealed, which was also supported by quantitative analysis and functional enrichment. Six genes (PeLBD6/10/20/29/38/46) showed a continuous upward trend in shoot development, which implies that these genes are vitally important for the fast-growing development of moso bamboo. This study provides a good data base for the in-depth study of the functions of the moso bamboo LBD TF family genes and provides new insights to explore the molecular mechanisms of rapid growth in moso bamboo.
Methods
Identification and sequence analysis of LBD proteins from Moso bamboo
Genomic data of moso bamboo was downloaded from the P. edulis genome database (ftp://parrot.genomics.cn/gigadb/pub/10.5524/100001_101000/100498/). A hidden Markov model of the lateral organ boundaries domain (DUF260, PF03195) was obtained from the Pfam database (http://pfam.xfam.org/) and used as the seed model for an HMMER3 search (http://hmmer.janelia.org/) of the local bamboo protein database (E ≤ 10− 20) [47], and redundant genes were removed to produce a set of preliminary LBD candidate sequences. To verify that these candidates are LBDs, we used the SMART (http://smart.embl-heidelberg.de/) [48] and Pfam [49] databases to filter out sequences that lacked a complete LOB domain. The confirmed LBD genes were renamed according to their positions on the moso bamboo chromosomes.
Subcellular localization predictions were generated with Cell-PLoc 2.0 (http://www.csbio.sjtu.edu.cn/bioinf/Cell-PLoc-2/) [50], and the ExPASy ProtParam tool (https://web.expasy.org/protparam/) [51] was used to predict protein physicochemical parameters such as molecular weight (MW), isoelectric point (PI) and grand average of hydropathicity (GRAVY).
Sequence alignment and phylogenetic tree construction
Whole genome information for Arabidopsis and rice was downloaded from the TAIR10 database (http://www.arabidopsis.org/index.jsp) and the Rice Genome Annotation Project database (http://rice.plantbiology.msu.edu), respectively. Maize and pepper genomic data were downloaded from the Ensembl database (http://asia.ensembl.org/index.html).
Forty-three Arabidopsis LBD proteins and 36 rice LBD proteins were identified from HMMER3 searches of the corresponding local protein databases [47]. The Arabidopsis and rice LBD sequences were combined with those from moso bamboo, and a multiple protein sequence alignment was produced with MUSCLE [52]. The resulting alignment was used to construct a maximum likelihood (ML) phylogenetic tree in MEGA 7.0 with 1000 bootstrap replicates [53]. Intraspecific phylogenetic trees were also constructed using the LBD protein sequences from bamboo. The amino acid sequences of conserved domains were compared and edited using Jalview software (http://www.jalview.org/) [54], and conserved motif Logos were generated with the WebLogo program (http://weblogo.threeplusone.com) [55].
Gene structure, motif composition, and promoter element analysis
The intron–exon distributions of the moso bamboo LBD genes were obtained using GFF annotation files from the moso bamboo genome. Conserved amino acid sequences of LBD proteins were analyzed using the online MEME tool (http://meme-suite.org/) [56]. MEME analysis parameters included a minimum width ≥ 6, a maximum width of 50, and a motif number of 6; all other parameters were set to default values. PlantCARE (http://bioinformatics.psb.ugent.be/webtools/plantcare/html/) was used to identify cis-acting elements in the 1500-bp promoter region upstream of each gene’s transcription start site, and the results were visualized using TBtools (v1.0697) [57].
Synteny analysis and Ka/Ks ratios
The moso bamboo protein sequences were aligned to one another or to the protein sequences from Arabidopsis, rice, maize, or pepper using TBtools software. MCScanX [58] was used to identify gene duplication events and syntenic relationships among the LBD proteins, and the results were visualized using Circos and Dual Synteny Plot in TBtools [59].
For Ka/Ks analysis, seventeen homologous gene pairs were identified by BLASTn using two criteria: (1) > 75% sequence similarity and (2) an alignable region > 75% of the length of the longer sequence [60]. KaKs_Calculator2.0 was used to calculate the synonymous substitution rate (Ks), nonsynonymous substitution rate (Ka), and Ka/Ks ratio between homologous gene pairs [61]. Evolutionary divergence times within the bamboo LBD gene family were calculated using the bamboo-specific divergence time formula T = Ks/2λ (where λ = 6.5 × 10− 9).
Transcription profiling of PeLBDs based on RNA-Seq data
In a recent study, we obtained 24 original transcriptome datasets (accession number GSM2810849: SRR6171235-SRR6171258) from the Gene Expression Omnibus (GEO) database (http://www.ncbi.nlm.nih.gov/geo). Tissue samples from eight fast-growing developmental nodes were included (located at 0.2, 0.5, 1, 2, 3, 4, 5, and 6 m on young shoots), with three biological replicates from each developmental node. In addition, transcriptome data from different plant tissues (roots, rhizomes, panicles, and leaves) were downloaded from the European Nucleotide Archive (https://www.ebi.ac.uk/ena/browser/home) (accession numbers ERR105067–ERR105076). Transcriptome data from different tissues were expressed as log2 (TPM + 1) and visualized using the function pheatmap package in R. (https://cran.r-project.org/web/packages/pheatmap/index.html).
The STEM version 1.3.11 [62] was used to analyze and visualize trends in PeLBD gene expression during rapid shoot growth with the STEM clustering method, a maximum of 20 model profiles, and all other parameters set to their default values [63].
Plant material, RNA extraction, and qRT–PCR analysis
The qRT–PCR analysis was used to verify the expression of PeLBD genes in different tissues and organs (root, rhizome, panicle and leaf), as well as their expression and potential regulatory roles during the rapid development of bamboo shoots. Bamboo shoots of different heights (0.2 m, 0.5 m, 1 m, 2 m, 3 m, 4 m, 5 m, 6 m) were taken from the part that was combined with the rhizomes, and the underground part was taken from 0.2 m as the base point.
Tissue samples of bamboo rhizomes, inflorescences, young leaves, roots, and shoots of different heights (0.2, 0.5, 1, 2, 3, 4, 5, and 6 m) were obtained from bamboo plants growing in a Bamboo Garden, Guilin city, Guangxi, China. The study area is 155 m above sea level, an average annual temperature is 19.0 °C | 66.3 °F, and the mean annual rainfall is 2174 mm | 85.6 in.. All materials collected in the field did not require ethical approval and a license. Three biological replicates of each tissue type were obtained. After harvesting, tissue samples were immediately placed in liquid nitrogen and stored at − 80 °C until RNA extraction.
Total RNA was extracted from each sample using the FastPure Plant Total RNA Isolation kit (Nanjing Vazyme Biotech, China, RC401), and the reverse-transcribed cDNA products were stored at − 20 °C for backup. cDNA was diluted five-fold before using as a template. Primers for qRT–PCR were designed using Beacon Designer 7 (Supplemental Table 1). The qRT–PCR reaction system (final volume 20 μL) contained 10 μL 2 × chamQ Universal SYBR qPCR Master Mix, 0.4 μL 10 μM forward primer, 0.4 μL 10 μM reverse primer, 2 μL template cDNA, and 7.2 μL ddH2O. The reaction program was 95 °C for 30 s; 95 °C for 10 s and 60 °C for 30 s; and 40 cycles of 95 °C for 15 s, 60 °C for 60 s, and 95 °C for 15 s. There were three technical replicates per sample. PeActin (PH02Gene08372) was used as the internal reference gene. Amplification was performed using a Bio-Rad iCycler iQ real-time quantitative PCR instrument (CFX96, USA), and the relative expression level of each gene was calculated using the 2−ΔΔCt method. All statistical analysis was performed using GraphPad Prism 7 Software. Comparisons between paired groups were performed with Student’s t-test.
Protein–protein interaction (PPI) network construction and GO enrichment analyses
The LBD protein sequences were uploaded to the STRING database (https://string-db.org/) for node comparison, and relationships among important proteins were predicted based on rice protein interactions. Cytoscape (V3.7.1) was used to visualize the resulting network [64].
GOATOOLS (http://github.com/tanghaibao/GOatools) [65] was used to assign Gene Ontology (GO) annotations to LBDs, and Fisher’s exact test was used to identify biological functions enriched in the PeLBDs relative to the full GO database. An false discovery rate (FDR) multiple testing correction [66] was used to minimize false positives, and functions were considered to be significantly enriched when their FDR-corrected P-values (Padjust) were < 0.05.
Identification and annotation of LBD target genes
To obtain a list of downstream target genes potentially regulated by the LBDs, we used TBtools (v1.0697) [59] to extract the 2000-bp promoter sequences of the moso bamboo genes. The consensus motif of the LBD DNA binding site (MA1673.1) was obtained from the JASPA_CORE database (http://jaspar.genereg.net) of eukaryotic TF binding profiles [67]. The Motif FIMO program in the MEME suite (5.3.0) (http://meme-suite.org/) [56] was then used to detect the consensus LBD binding motif in the moso bamboo promoter set. Final target gene candidates were identified based on a screening criterion of P < 1 × e− 6. The candidate LBD target genes were functionally annotated using the GO and Kyoto Encyclopedia of Genes and Genomes (KEGG) databases. Analysis and visualization were performed using the Majorbio online platform (https://cloud.majorbio.com).
Availability of data and materials
All data generated or analysed during this study are included in this published article and its supplementary information files. The raw sequencing data used during this study have been deposited in NCBI (http://www.ncbi.nlm.nih.gov/geo) and European Nucleotide Archive (https://www.ebi.ac.uk/ena/browser/home) under accession numbers GSM2810849: SRR6171235-SRR6171258 and ERR105067-ERR105076, respectively. Public access to the library is completely open.
Abbreviations
- MCScanX:
-
Multiple Collinearity Scan toolkit
- Ka:
-
Non-synonymous
- Ks:
-
Synonymous
- TPM:
-
Transcripts Per Kilobase Million
- WGDs:
-
whole genome duplications
- STEM:
-
Short Time-series Expression Miner
- KEGG:
-
Kyoto Encyclopedia of Genes and Genomes databases
References
Biswas P, Chakraborty S, Dutta S, Pal A, Dasl M. Bamboo flowering from the perspective of comparative genomics and transcriptomics. Front Plant Sci. 2016;7. https://doi.org/10.3389/fpls.2016.01900.
Ramakrishnan M, Yrjl K, Vinod KK, Sharma A, Zhou M. Genetics and genomics of moso bamboo (Phyllostachys edulis ): current status, future challenges, and biotechnological opportunities toward a sustainable bamboo industry. Food Energy Security. 2020;9(4). https://doi.org/10.1002/fes3.229.
Wei Q, Jiao C, Ding Y, Gao S, Guo L, Chen M, et al. Cellular and molecular characterizations of a slow-growth variant provide insights into the fast growth of bamboo. Tree Physiol. 2018;38(4):641–54. https://doi.org/10.1093/treephys/tpx129.
Singh SR, Singh R, Kalia S, Dalal S, Dhawan AK, Kalia RK. Limitations, progress and prospects of application of biotechnological tools in improvement of bamboo—a plant with extraordinary qualities. Physiol Mol Biol Plants. 2013;19(1):21–41. https://doi.org/10.1007/s12298-012-0147-1.
Latchman DS. Introductory overview - transcription factors: an overview. Int J Biochem Cell Biol. 1997;29(12):1305–1312(1308). https://doi.org/10.1016/S1357-2725(97)00085-X.
Shuai. The Lateral Organ Boundaries Gene Defines a Novel, Plant-Specific Gene Family. Plant Physiol. 2002;129(2):747–61.
Hidekazu I, Yoshihisa U, Endang S, Hitoshi O, Shoko K, Hirokazu T, et al. The ASYMMETRIC LEAVES2 gene of Arabidopsis thaliana, required for formation of a symmetric flat leaf Lamina, Encodes a Member of a Novel Family of Proteins Characterized by Cysteine Repeats and a Leucine Zipper. Plant Cell Physiol. 2002;5:467.
Majer C, Hochholdinger F. Defining the boundaries: structure and function of LOB domain proteins. Trends Plant Sci. 2011;16(1):47–52. https://doi.org/10.1016/j.tplants.2010.09.009.
Landschulz WH, Johnson PF, McKnight SL. The leucine zipper: a hypothetical structure common to a new class of DNA binding proteins. Science. 1988;240(4860):1759-64.
Chanderbali AS, He F, Soltis PS, Soltis DE. Out of the water: origin and diversification of the LBD gene family. Mol Biol Evol. 2015;32(8):1996–2000. https://doi.org/10.1093/molbev/msv080.
Liu H, Cao M, Chen X, Ye M, Zhao P, Nan Y, Li W, Zhang C, Kong L, Kong N, et al. Genome-Wide Analysis of the Lateral Organ Boundaries Domain (LBD) Gene Family in Solanum tuberosum. Int J Mol Sci. 2019;20(21):5360.
Kim M-J, Kim J. Identification of nuclear localization signal in ASYMMETRIC LEAVES2-LIKE18/LATERAL ORGAN BOUNDARIES DOMAIN16 (ASL18/LBD16) from Arabidopsis. J Plant Physiol. 2012;169(12):1221–6. https://doi.org/10.1016/j.jplph.2012.04.004.
Yang Y, Yu X, Wu P. Comparison and evolution analysis of two rice subspecies LATERAL ORGAN BOUNDARIES domain gene family and their evolutionary characterization from Arabidopsis. Mol Phylogen Evolution. 2006;39(1):248–62. https://doi.org/10.1016/j.ympev.2005.09.016.
Semiarti E, Ueno Y, Tsukaya H, Iwakawa H, Machida C, Machida Y. The ASYMMETRIC LEAVES2 gene of Arabidopsis thaliana regulates formation of a symmetric lamina, establishment of venation and repression of meristem-related homeobox genes in LEAVES. Development. 2001;128(10):1771–83. https://doi.org/10.1242/dev.128.10.1771.
Iwakawa H, Iwasaki M, Kojima S, Ueno Y, Soma T, Tanaka H, Semiarti E, Machida Y, Machida C. Expression of the ASYMMETRIC LEAVES2 gene in the adaxial domain of Arabidopsis leaves represses cell proliferation in this domain and is critical for the development of properly expanded leaves. Plant J. 2007;51(2):173-184.
Goh T, Toyokura K, Yamaguchi N, Okamoto Y, Uehara T, Kaneko S, et al. Lateral root initiation requires the sequential induction of transcription factors LBD16 and PUCHI in Arabidopsis thaliana. New Phytol. 2019;224(2):749–60. https://doi.org/10.1111/nph.16065.
Lee HW, Cho C, Pandey SK, Park Y, Kim M-J, Kim J. LBD16 and LBD18 acting downstream of ARF7 and ARF19 are involved in adventitious root formation in Arabidopsis. BMC Plant Biol. 2019;19(1):46. https://doi.org/10.1186/s12870-019-1659-4.
Sun X, Feng Z, Meng L, Zhu J, Geitmann A. Arabidopsis ASL11/LBD15 is involved in shoot apical meristem development and regulates WUS expression. Planta. 2013;237(5):1367–78. https://doi.org/10.1007/s00425-013-1844-x.
Rubin G, Tohge T, Matsuda F, Saito K, Scheible WR. Members of the LBD family of transcription factors repress anthocyanin synthesis and affect additional nitrogen responses in Arabidopsis. Plant Cell. 2009;21(11):3567–84. https://doi.org/10.1105/tpc.109.067041.
Albinsky D, Kusano M, Higuchi M, Hayashi N, Kobayashi M, Fukushima A, Mori M, Ichikawa T, Matsui K, Kuroda H, et al. Metabolomic screening applied to rice FOX Arabidopsis lines leads to the identification of a gene-changing nitrogen metabolism. Mol Plant. 2010;3(1):125-42.
Thatcher LF, Powell JJ, Aitken EAB, Kazan K, Manners JM. The lateral organ boundaries domain transcription factor LBD20 functions in Fusarium wilt susceptibility and Jasmonate signaling in Arabidopsis. Plant Physiol. 2012;160(1):407–18. https://doi.org/10.1104/pp.112.199067.
Peng Z, Lu Y, Li L, Zhao Q, Feng Q, Gao Z, et al. The draft genome of the fast-growing non-timber forest species moso bamboo (Phyllostachys heterocycla). Nat Genet. 2013;45(4):456–61. https://doi.org/10.1038/ng.2569.
Zhao H, Gao Z, Wang L, Wang J, Wang S, Fei B, Chen C, Shi C, Liu X, Zhang H, et al. Chromosome-level reference genome and alternative splicing atlas of moso bamboo (Phyllostachys edulis). Gigascience. 2018;7(10):giy115.
Xie T, Zeng L, Chen X, Rong H, Wu J, Batley J, Jiang J, Wang Y. Genome-Wide Analysis of the Lateral Organ Boundaries Domain Gene Family in Brassica napus. Genes. 2020;11(3):280.
Yu J, Xie Q, Li C, Dong Y, Zhu S, Chen J. Comprehensive characterization and gene expression patterns of LBD gene family in Gossypium. Planta. 2020;251(4):81.
Cao H, Liu CY, Liu CX, Zhao YL, Xu RR. Genomewide analysis of the lateral organ boundaries domain gene family in Vitis vinifera. J Genet. 2016;95(3):515–26. https://doi.org/10.1007/s12041-016-0660-z.
Zhang Y-M, Zhang S-Z, Zheng C-C. Genomewide analysis of LATERAL ORGAN BOUNDARIES domain gene family in Zea mays. J Genet. 2014;93(1):79–91. https://doi.org/10.1007/s12041-014-0342-7.
Huang X, Yan H, Liu Y, Yi Y. Genome-wide analysis of LATERAL ORGAN BOUNDARIES DOMAIN-in Physcomitrella patens and stress responses. Genes Genomics. 2020;42(6):651–62. https://doi.org/10.1007/s13258-020-00931-x.
Lynch M, Conery JS. The evolutionary fate and consequences of duplicate genes. Science. 2000;290(5494):1151-5.
Song B, Tang Z, Li X, Li J, Zhang M, Zhao K, Liu H, Zhang S, Wu J. Mining and evolution analysis of lateral organ boundaries domain (LBD) genes in Chinese white pear (Pyrus bretschneideri). BMC Genomics. 2020;21(1):644.
Guo BJ, Wang J, Lin S, Tian Z, Xu RG. A genome-wide analysis of the ASYMMETRIC LEAVES2/LATERAL ORGAN BOUNDARIES (AS2/LOB) gene family in barley (Hordeum vulgare L.). J Zhejiang Univ Sci B. 2016;17(10):763–74. https://doi.org/10.1631/jzus.B1500277.
Staiger D, Brown JWSJPC. Alternative splicing at the intersection of biological timing. Devel Stress Responses. 2013;25(10):3640–56.
Jun L, Xiangbing, Meng Y, Zong K, Chen H, ZJN P. Gene replacements and insertions in rice by intron targeting using CRISPR-Cas9; 2016.
Okushima Y, Fukaki H, Onoda M, Theologis A, Tasaka M. ARF7 and ARF19 regulate lateral root formation via direct activation of LBD/ASL genes in Arabidopsis. Plant Cell. 2007;19(1):118–30. https://doi.org/10.1105/tpc.106.047761.
Xu L. De novo root regeneration from leaf explants: wounding, auxin, and cell fate transition. Curr Opin Plant Biol. 2017;41:39–45.
Yu YT, Wu Z, Lu K, Bi C, Liang S, Wang XF, et al. Overexpression of the MYB37 transcription factor enhances abscisic acid sensitivity, and improves both drought tolerance and seed productivity in Arabidopsis thaliana. Plant Mol Biol. 2016;90(3):267–79. https://doi.org/10.1007/s11103-015-0411-1.
Zhao Y, Tian X, Wang F, Zhang L, Xin M, Hu Z, et al. Characterization of wheat MYB genes responsive to high temperatures. BMC Plant Biol. 2017;17(1):208. https://doi.org/10.1186/s12870-017-1158-4.
Dai X, Xu Y, Ma Q, Xu W, Chong K. Overexpression of an R1R2R3 MYB gene, OsMYB3R-2, increases tolerance to freezing, drought, and salt stress in transgenic Arabidopsis. Plant Physiol. 2007;143(4):1739–51. https://doi.org/10.1104/pp.106.094532.
Cannon SB, Mitra A, Baumgarten A, Young ND, GJBPB M. The roles of segmental and tandem gene duplication in the evolution of large gene families in Arabidopsis thaliana, vol. 4; 2004. p. 10.
Zhu Y, Wu N, Song W, Yin G, Qin Y, Yan Y, Hu Y. Soybean (Glycine max) expansin gene superfamily origins: segmental and tandem duplication events followed by divergent selection among subfamilies. BMC Plant Biol. 2014;14:93.
Opanowicz M, Vain P, Draper J, Parker D, Doonan JH. Brachypodium distachyon: making hay with a wild grass. Trends Plant Sci. 2008;13(4):172-7.
Ikeuchi M, Sugimoto K, Iwase A. Plant callus: mechanisms of induction and repression [OPEN]. Plant Cell. 2013;25(9):3159–73. https://doi.org/10.1105/tpc.113.116053.
Borghi L, Bureau M, Simon R. Arabidopsis JAGGED LATERAL ORGANS is expressed in boundaries and coordinates KNOX and PIN activity. Plant Cell Online. 2007;19(6):1795–808. https://doi.org/10.1105/tpc.106.047159.
Thatcher LF, Powell JJ, Aitken EAB, Kazan K, Manners JM. The Lateral Organ Boundaries Domain Transcription Factor LBD20 Functions in Fusarium Wilt Susceptibility and Jasmonate Signaling in Arabidopsis. Plant Physiol. 2012;160(1):407-18.
Cabrera J, Díaz-Manzano FE, Sanchez M, Rosso MN, Melillo T, Goh T, et al. A role for LATERAL ORGAN BOUNDARIES-DOMAIN 16 during the interaction Arabidopsis-Meloidogyne spp. provides a molecular link between lateral root and root-knot nematode feeding site development. New Phytol. 2014;203(2):632–45. https://doi.org/10.1111/nph.12826.
Lee K, Park OS, Seo PJ. Arabidopsis ATXR2 deposits H3K36me3 at the promoters of LBD genes to facilitate cellular dedifferentiation. Sci Signal. 2017;10(507):eaan0316.
Finn RD, Clements J, Eddy SR. HMMER web server: interactive sequence similarity searching. Nucleic Acids Res. 2011;39(Web Server issue):W29-37.
Letunic I, Doerks T, Bork P. SMART 7: recent updates to the protein domain annotation resource. Nucleic Acids Res. 2012;40(D1):D302–5. https://doi.org/10.1093/nar/gkr931.
Finn RD, Coggill P, Eberhardt RY, Eddy SR, Mistry J, Mitchell AL, Potter SC, Punta M, Qureshi M, Sangrador-Vegas A, et al. The Pfam protein families database: towards a more sustainable future. Nucleic Acids Res. 2016;44(D1):D279-85.
Chou KC, Shen HB. Cell-PLoc 2.0: an improved package of web-servers for predicting subcellular localization of proteins in various organisms. Nat Sci. 2010;2(10):1090–103. https://doi.org/10.4236/ns.2010.210136.
Wilkins MR, Gasteiger E, Bairoch A, Sanchez JC, Williams KL, Appel RD, Hochstrasser DF. Protein identification and analysis tools in the ExPASy server. Methods Mol Biol. 1999;112:531-52.
Edgar RC. MUSCLE: multiple sequence alignment with high accuracy and high throughput. Nucleic Acids Res. 2004;32(5):1792-7.
Kumar S, Stecher G, Tamura K. MEGA7: Molecular Evolutionary Genetics Analysis Version 7.0 for Bigger Datasets. Mol Biol Evol. 2016;33(7):1870-4.
Waterhouse, Andrew, Procter, Jim, Martin, David A, Barton, Geoffrey J. Jalview: Visualization and Analysis of Molecular Sequences, Alignments, and Structures. BMC Bioinformatics. 2005;6:28.
Crooks, Gavin, E., Hon, Gary, Chandonia, John-Marc, Brenner, Steven, E.: WebLogo: a sequence Logo generator. Genome Res 2004, 14(6):1188–1190, doi: https://doi.org/10.1101/gr.849004.
Bailey TL, Boden M, Buske FA, Frith M, Grant CE, Clementi L, et al. MEME SUITE: tools for motif discovery and searching; 2009. https://doi.org/10.1093/nar/gkp335.
Magali L, Patrice D, Gert T, Kathleen M, Yves M, Yves VdP, Pierre R, Stephane R. PlantCARE, a database of plant cis-acting regulatory elements and a portal to tools for in silico analysis of promoter sequences. Nucleic Acids Res. 2002;30(1):325-7.
Wang Y, Tang H, Debarry JD, Tan X, Li J, Wang X, Lee TH, Jin H, Marler B, Guo H, et al. MCScanX: a toolkit for detection and evolutionary analysis of gene synteny and collinearity. Nucleic Acids Res. 2012;40(7):e49.
Chen C, Chen H, Zhang Y, Thomas HR, Frank MH, He Y, et al. TBtools: an integrative toolkit developed for interactive analyses of big biological data. Mol Plant. 2020;13(8):1194–202. https://doi.org/10.1016/j.molp.2020.06.009.
Gu Z, Cavalcanti A, Chen FC, Bouman P, Li WH. Extent of gene duplication in the genomes of Drosophila, nematode, and yeast. Mol Biol Evol. 2002;19(3):256-62.
Wang DP, Wan HL, Zhang S, Yu J. Gamma-MYN: a new algorithm for estimating Ka and Ks with consideration of variable substitution rates. Biol Direct. 2009;4:20.
Ernst J, Bar-Joseph Z. STEM: a tool for the analysis of short time series gene expression data. BMC Bioinformatics. 2006;7(1):191.
Ernst J, Nau GJ, Bar-Joseph Z. Clustering Short Time Series Gene Expression Data. Bioinformatics. 2005;21(Suppl 1):i159–68.
Otasek D, Morris JH, Bouças J, Pico AR, Demchak B. Cytoscape Automation: empowering workflow-based network analysis. Genome Biol. 2019;20(1):185.
Klopfenstein DV, Zhang L, Pedersen BS, Fidel R, Alex WV, Aurélien N, et al. GOATOOLS: A Python library for Gene Ontology analyses. Sci Rep. 2018;8(1):10872.
Benjamini Y, Hochberg Y. Controlling the false discovery rate: a practical and powerful approach to multiple testing. J R Stat Soc. 1995;57(1):289–300.
Khan A, Fornes O, Stigliani A, Gheorghe M, Castro-Mondragon JA, van der Lee R, Bessy A, Chèneby J, Kulkarni SR, Tan G, et al. JASPAR 2018: update of the open-access database of transcription factor binding profiles and its web framework. Nucleic Acids Res. 2018;46(D1):D260-d266.
Acknowledgements
We are grateful to the members of the lab for their assistance and helpful discussions. The authors would like to thank TopEdit (www.topeditsci.com) for its linguistic assistance during the preparation of this manuscript.
Funding
This study was financially supported by National Natural Science Foundation of China (NSFC, Project grant: 31770721). The funding agencies had no role in the design, analysis, interpretation of the data or writing of the manuscript.
Author information
Authors and Affiliations
Contributions
BH performed data collection and processing, participated in study design and interpretation, performed experiments, and wrote the manuscript. ZH participated in some of the experiments. RM MR andJC assisted in the interpretation of the results. ZZ and KY are responsible for the completeness of the data and accuracy of the data analysis. The manuscript was reviewed and edited by all authors. The author(s) read and approved the final manuscript.
Corresponding authors
Ethics declarations
Ethics approval and consent to participate
The plant materials used in this study were tissue samples of bamboo rhizomes, inflorescences, young leaves, roots, and shoots of different heights during fast growth period were obtained from bamboo plants growing in a Bamboo Garden, Guilin city, Guangxi, China. This study did not require ethical approval or consent, as it did not involve any endangered or protected species.
Consent for publication
Not applicable.
Competing interests
The authors declare that they have no competing interests.
Additional information
Publisher’s Note
Springer Nature remains neutral with regard to jurisdictional claims in published maps and institutional affiliations.
Supplementary Information
Additional file 1: Supplemental Fig. 1.
The total number of LBD gene subfamilies in the nine species.
Additional file 2: Supplemental Fig. 2.
The LOGO of six amino acid motifs in LBD proteins.
Additional file 3: Supplemental Fig. 3.
Number of cis–acting elements on promoters of PeLBD genes.
Additional file 4: Supplemental Fig. 4.
The consensus motif of the LBD DNA binding site from the JASPA_CORE database.
Additional file 5: Supplemental Fig. 5.
GO analysis of potential PeLBD target genes.
Additional file 6: Supplemental Fig. 6.
KEGG analysis of potential PeLBD target genes.
Additional file 7: Supplemental Table 1.
The Ka-Ks analysis of 17 PeLBD duplicated gene pairs.
Additional file 8: Supplemental Table 2.
Detailed information on GO and KEGG enrichment analysis in PeLBD target gene.
Additional file 9: Supplemental Data 1.
Detailed information on interspecies synteny of the moso bamboo genome.
Additional file 10: Supplemental Data 2.
The specific primers of PeLBD genes for qRT-PCR.
Additional file 11: Supplemental Data 3.
Detailed information on gene ontology enrichment analysis in PeLBD family.
Rights and permissions
Open Access This article is licensed under a Creative Commons Attribution 4.0 International License, which permits use, sharing, adaptation, distribution and reproduction in any medium or format, as long as you give appropriate credit to the original author(s) and the source, provide a link to the Creative Commons licence, and indicate if changes were made. The images or other third party material in this article are included in the article's Creative Commons licence, unless indicated otherwise in a credit line to the material. If material is not included in the article's Creative Commons licence and your intended use is not permitted by statutory regulation or exceeds the permitted use, you will need to obtain permission directly from the copyright holder. To view a copy of this licence, visit http://creativecommons.org/licenses/by/4.0/. The Creative Commons Public Domain Dedication waiver (http://creativecommons.org/publicdomain/zero/1.0/) applies to the data made available in this article, unless otherwise stated in a credit line to the data.
About this article

Cite this article
Huang, B., Huang, Z., Ma, R. et al. Genome-wide identification and expression analysis of LBD transcription factor genes in Moso bamboo (Phyllostachys edulis). BMC Plant Biol 21, 296 (2021). https://doi.org/10.1186/s12870-021-03078-3
Received:
Accepted:
Published:
DOI: https://doi.org/10.1186/s12870-021-03078-3