
Abstract
Background
Globodera rostochiensis belongs to major potato pathogens with a sophisticated mechanism of interaction with roots of the host plants. Resistance of commercial varieties is commonly based on specific R genes introgressed from natural populations of related wild species and from native potato varieties grown in the Andean highlands. Investigation of molecular resistance mechanisms and screening the natural populations for novel R genes are important for both fundamental knowledge on plant pathogen interactions and breeding for durable resistance. Here we exploited the Solanum phureja accessions collected in South America with contrasting resistance to G. rostochiensis.
Results
The infestation of S. phureja with G. rostochiensis juveniles resulted in wounding stress followed by activation of cell division and tissue regeneration processes. Unlike the susceptible S. phureja genotype, the resistant accession reacted by rapid induction of variety of stress response related genes. This chain of molecular events accompanies the hypersensitive response at the juveniles’ invasion sites and provides high-level resistance. Transcriptomic analysis also revealed considerable differences between the analyzed S. phureja genotypes and the reference genome.
Conclusion
The molecular processes in plant roots associated with changes in gene expression patterns in response to G. rostochiensis infestation and establishment of either resistant or susceptible phenotypes are discussed. De novo transcriptome assembling is considered as an important tool for discovery of novel resistance traits in S. phureja accessions.
Background
Potato cyst nematodes originated in Andean regions of South America [1]. The Golden Potato Cyst Nematode (GPCN, Globodera rostochiensis) is a quarantine pest found worldwide and responsible for considerable losses in potato production [2, 3]. At present, G. rostochiensis (pathotype Ro1) was registered in 61 territorial entities of the Russian Federation, including 861 administrative districts covering an area of 1,794,442 ha [4, 5]. Depending on the potato cultivar, yield losses can range from 19 to 90% [6], and GPCN eggs can remain dormant and viable inside the cyst for 30 years [7]. The predicted impact of G. rostochiensis may also grow due to the climate change [8].
The protection of plants against potato cyst nematodes is complicated and commonly involves the usage of nematicides [8, 9] and trap crops (e.g., Solanum sisymbriifolium) [3, 10]. However, many chemical nematicides are either low efficient [11, 12] or toxic and prohibited in Europe, and the control of GPCN is mainly based on deployment of major resistance genes (R-genes) (e.g., [13]). R genes conferring strong resistance to the pathotype Ro1 of GPCN were introgressed into commercial varieties from South America originated species: the H1 gene from the cultivated species Solanum tuberosum subsp. andigenum [14], and the Gro1–4 gene from the Bolivian wild species S. spegazzinii [15, 16]. It is widely discussed that introgression of new R genes is of importance since there is a threat of nematode evolving [13, 17].
The GPCN juveniles penetrate plant roots in which they induce the formation of feeding syncytia. The effector proteins from oesophageal glands trigger the chain of metabolic and morphological changes resulting in fusion of several root cells into a feeding structure as well as suppression of plant immune response [18]. In a few investigations of plant varieties resistant to sedentary nematodes the revealed resistance mechanisms were mainly based on incompatible interaction and hypersensitive response: a zone of dead cells formed either at early or at later stages after infestation isolated juveniles from nutrient supply and prevented completion of their life cycle [19]. The natural variety of resistance mechanisms against potato sedentary nematodes has not been evaluated yet. Recent studies highlighted the biological complexity of plant-nematode interactions, for example the role of unusual R genes (such as soybean Rhg1 alpha-SNAP proteins efficient against a wide variety of cyst nematodes) [20, 21], new nematode effectors and related mechanisms of immunity suppression (e.g., RHA1B) [22].
Both compatible and incompatible plant-nematode interactions provide unique models for detailed investigation of fundamental genetic mechanisms of plant cell reprogramming, its prevention by defense systems and host-pathogen coevolution. The process of interaction is rather complicated: an important feature of nematode inoculation is significant tissue damage resulting in a non-specific wounding stress. This non-specific wounding response may overlap with the specific response to GPCN or be an integral part of it [23].
Here we present the results of detailed comparative analysis of root transcriptomes of two diploid potato accessions of S. phureja with contrasting resistance to GPCN. The dynamics of transcriptome changes after nematode juveniles inoculation revealed a combination of biological processes related to cell division, tissue regeneration, non-specific defense against pathogens, as well as some processes with an unknown role (e.g., changes in plastid associated metabolic chains). The molecular mechanisms of nematode propagation and plant resistance are discussed. Another observation concerns the general approaches of studying the accessions of Andean native potato varieties. It was found that the reference genome annotation is not sufficient for analysis of transcriptomes of these cultivated diploid potato accessions from VIR collection and de novo transcriptome assembling may be used to fill this gap (at least, partially). One of the aims of this study was to compile a set of new candidate R genes against GPCN for further investigation and introgression through either conventional breeding or other biotechnological approaches (e.g., [24,25,26,27,28]).
Results
Comparison of transcriptomes of GPCN-resistant and susceptible S. phureja genotypes
The samples of roots of S. phureja accessions i-0144786 and i-0144787 were taken before inoculation (0), 24 and 72 h post inoculation (hpi) with either GPCN juveniles or water (3 plants per time point / type of treatment). Thirty libraries of paired reads consisting of 1,265,033,228 paired reads were obtained as raw sequencing data. After filtering, 967,259,304 paired reads remained as clean sequencing data. Average library size was about 42 million read pairs before and 32 million read pairs after filtering (Additional file 1).
On average, 65% of read pairs were mapped concordantly to the reference genome [29] with the aid of STAR tool. Read counts were computed for all the annotated 39,021 genes. Filtering of low-expression genes prior to differential expression evaluation resulted in a sample of 21,113 genes for further analysis.
The difference between the transcriptomes of two compared S. phureja genotypes was evaluated with principal component analysis (PCA, Fig. 1). The first principal component (axis X) corresponds to changes in gene expression patterns at different time points (0, 24, 72 hpi) for both resistant and susceptible genotypes. The second component (Y axis) characterizes the differences in gene expression patterns between the two analyzed genotypes.
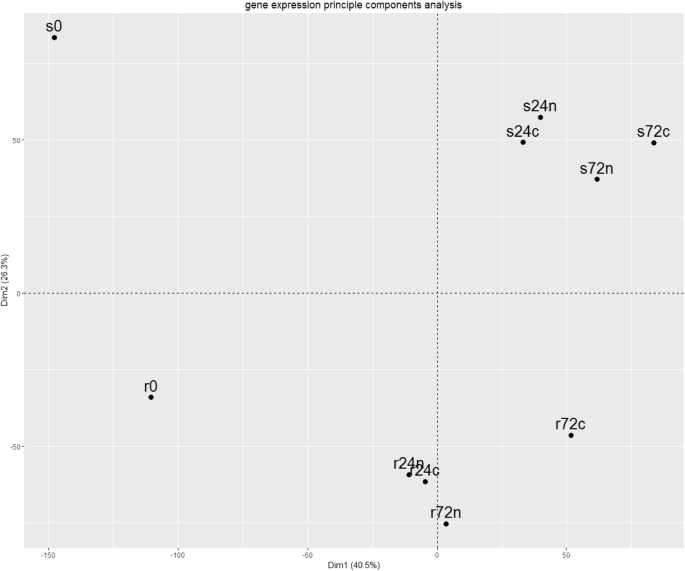
PCA plot of samples analyzed for two largest components. The first component, X axis (40.5% of total variance), the second component, Y axis (26.3% of total variance). Designations: r, S. phureja genotype resistant to GPCN; s, S. phureja genotype susceptible to GPCN; 24, 72 – hours after plant roots inoculation (hpi) with either water (c, control) or nematode (n); 0, samples of resistant and susceptible plants roots without any inoculation. For example, r24n, transcriptome of S. phureja resistant genotype taken at 24 hpi point
One may see that (i) the S. phureja GPCN-resistant and susceptible genotypes have different transcriptomes that may refer to different origins of these accessions; (ii) the largest changes in gene expression patterns occur at 24 hpi, the subsequent changes at 72 hpi are relatively smaller; (iii) changes in transcriptomes were more pronounced in susceptible plants than in resistant genotype. Numbers of DEGs were calculated for the following pairwise comparisons: (I) to reveal the genes up- or down-regulated in susceptible genotype with respect to the resistant sample under the same experimental conditions (s0:r0, s24n:r24n, s24c:r24c, s72n:r72n, s72c:r72c); (ii) to reveal the transcriptome differences in the plants of one genotype at different hpi points (r0:r24c, r24c:r72c, r0:r24n, r24n:r72n, s0:s24c, s24c:s72c, s0:s24n, s24n:s72n); (iii) to reveal the transcriptome differences in plants of the same genotype but inoculated with either water (c, control) or nematode (n) (r24c:r24n, r72c:r72n, s24c:s24n, s72c:s72n). Overall, it resulted in 17 pairwise comparisons (Fig. 2).

The numbers of DEGs in S. phureja roots sampled under various experimental conditions. The arrow shows the compared transcriptomes, the numbers of up regulated genes are shown in red, the numbers of down-regulated genes are shown in purple. Designations: control, water inoculation; experiment, nematode inoculation; r, resistant genotype; s, susceptible genotype; 24, or 72 – hours after plant roots inoculation with either water (c, control) or nematode (n); 0, samples of roots of resistant and susceptible genotypes collected without inoculation. For example, s24c:r24c means comparison of transcriptomes from susceptible (s) and resistant (r) S. phureja genotypes collected 24 h (24) after inoculation with water (c)
The diagram (Fig. 2) reflects the numbers of identified DEGs. The arrows show the direction of comparison. For example, comparison s0:r0 between susceptible genotype at the 0 h (s0) and resistant accession at the same time (r0) yields 1298 genes which expression levels are higher and 896 genes which expression levels are lower than in resistant genotype. Full lists of differentially expressed genes are available as Additional file 2.
These data coincided with PCA plot (Fig. 1). First, the number of DEGs is greater between the root transcriptomes at 0 and 24 hpi, than between 24 and 72 hpi for both genotypes. The numbers of DEGs between the roots of resistant genotype after inoculation with water at 0 and 24 hpi were 1373 (up) and 2993(down), whereas for 24 hpi and 72 hpi the numbers of DEGs were 346 (up) and 291 (down). A similar situation was observed for resistant S. phureja accession after nematode inoculation: r0:r24n (1505 (up), 3116 (down)) versus r24n:r72n (535 (up), 487(down)). Second, the number of DEGs was generally larger in the roots of susceptible cultivar. Finally, the roots of susceptible plants were characterized by a relatively small difference in DEGs after inoculation with either water or nematode juveniles. For example, s24c:s24n comparison revealed 11 up- and 140 down-regulated genes, whereas comparison of root transcriptomes of S. phureja resistant plants after inoculation with either GPCN or water (r24c:r24n) revealed 246 up- and 534 down-regulated genes.
Gene ontology
The results of gene sets enrichment analyses for different plant sample pairs were obtained with the aid of AgriGO (Additional file 3 contains the full lists of GO terms for all the comparisons). Summary of observed trends is presented in Table 1.
De novo transcriptomes assembly
S. phureja genotypes under investigation were collected in South America and their genomes may differ from the reference genome [29]. Thus, annotation of transcriptome based only on the alignment with the reference genome is not complete and some important genes can be missed from consideration. To fill this gap at least partially, we additionally studied the S. phureja transcriptomes constructed de novo without usage of the reference genome. For this purpose, two master-transcriptomes were assembled. Raw transcriptome assemblies consisted of 538,200 (resistant accession i-0144787) and 643,926 contigs (susceptible accession i-0144786). After reducing redundancy of assemblies with Evidential Gene software, 168,254 and 172,210 contigs remained in non-redundant assemblies of resistant and susceptible S. phureja transcriptomes, respectively. BUSCO analysis revealed 89.9% of complete and 6.9% of fragmented BUSCOs for resistant and 74.4% of complete and 13.3% of fragmented BUSCOs for susceptible genotype.
On average, 78% of clean read pairs were aligned to the non-redundant sets of contigs of resistant variety and 72% of susceptible variety. Furthermore, non-redundant sets of contigs were aligned against reference genome, CDS and protein sequences. The results of TPM filtering and alignments of contigs to the reference genome and CDS sequences are summarized in Table 2.
One may see that there is a pool of novel transcripts with no significant homology to the reference genome (e-value defined by standalone blastn software e < 10− 30). Indeed, functions of these novel transcripts cannot be predicted through alignment with the reference genome and their functional analysis is in need of other approaches. Thus, we made a prediction of domains in proteins potentially encoded by de novo assembled contigs with the aid of HMM package (the results of contigs alignment to CDS and genome as well as pfam domains predictions are available in Additional file 4). It was found that a considerable part of the novel transcriptome encodes polypeptides with homology to Pfam-annotated functional domains, i.e. these mRNAs potentially encode functional proteins (Table 2).
Indeed, transcriptome analysis needs additional support to verify the expression of potential functional transcript at the level of translatome and proteome (e.g., [30,31,32]). However, the data presented provides a background for further experimental investigation of particular genes of interest, e.g., those encoding NBS-LRR receptors. It is well known that R-genes providing resistance to GPCN commonly belong to NBS-LRR receptor family. It has been reported earlier that the resistance of i-0144787 S. phureja accession did not result from the presence of already known R genes [4]. Since some de novo assembled transcripts have no counterparts in the reference genome annotation, the search for novel R-genes should be expanded on these contigs. To reveal the potential NBS-LRR genes responsible for GPCN resistance, we characterize de novo assembled transcripts with the aid of NLR-Parser software [33]. It was found that a number of cDNAs encode proteins with NBS-LRR domains, and some of these contigs were either not annotated or even have no homology with the reference genome. For susceptible S. phureja variety, 30 contigs were predicted as NBS-LRR gene candidates and all of them can be aligned onto the reference genome, but only 26 were aligned to genomic loci with annotated protein coding genes (i.e., four cDNA are likely to be encoded by genes missed from annotation). For GPCN-resistant S. phureja genotype, 33 cDNAs encoding NBS-LRR proteins were predicted. Thirty-two contigs can be aligned onto the reference genomic sequence, and 28 of them were mapped to known protein-coding loci. Thus, the transcriptomes of both S. phureja accessions contain additional transcripts of novel NBS-LRR encoding genes (Additional file 4). Interestingly, one contig predicted as NBS-LRR encoding cDNA by NLR-Parser, has no homology to the reference genome or CDS sequences at nucleotide sequence level. It has a size of 3112 nucleotides, and its predicted translated product is 865 amino acids long. The contig has an NB-ARC domain predicted with significance value E = 1.1∙10− 39 and LRR-8 domain predicted with E = 4.5∙10− 6. Alignment of the contig to NCBI non-redundant gene sequences set showed homology to five entries listed in Table 3.
In addition, this cDNA contig has homology to the nucleotide sequences in chromosomes 3 of S. lycopersicum and S. penellii. At the same time, amino acid sequence of the contig’s predicted translated product showed homology to a number of protein sequences presented in NCBI Protein database. Interestingly, among 100 sequences with best hits there were no sequences from S. tuberosum or S. phureja. Ten best hits include sequences of S. pennellii, S. lycopersicum, N. tabacum, N. tomentosiformis, and N. sylvestris.
List of candidate major gene(s) providing S. phureja cultivar i-0144787 with resistance to GPCN
One of the tasks of this research concerned the identification of R-genes in the genome of S. phureja i-0144787 accession providing high resistance against GPCN. According to the results obtained, the resistance is mediated through HR-response and programmed cell death (Fig. 3) commonly connected to NBS-LRR type receptors.

GPCN juvenile penetration into the root tissues of the susceptible S. phureja accession i-0144786 (a, 72 hpi) and resistant S. phureja accession i-0144787 (b, 24 hpi; c, 48 hpi; d, 72 hpi). a, no signs of necrosis near the nematode juvenile; b, zone of necrosis close to the GPCN juvenile head; c, large necrosis zone near the GPCN juvenile head; d, GPCN juveniles are surrounded by necrosis zones. Arrows mark the GPCN juveniles
Thus, we compiled a list of potential R-genes based on the following assumptions: (i) candidate genes should belong to NBS-LRR group; (ii) the level of expression of candidate genes should be much higher in the roots of the resistant S. phureja genotype (preferably, with no expression in the susceptible genotype); (iii) the level of expression of candidate genes should be detected in the roots of the resistant S. phureja genotype before inoculation with water or GPCN juveniles.
The list of 419 potential R genes described earlier in (Jupe et al., 2013) [34] was taken for this analysis. The search for homology with S. phureja transcripts revealed 17 genes with generally up-regulated and 13 genes with down-regulated expression in the roots of the resistant genotype (Additional file 5). Some of these transcripts were used for qRT-PCR to verify the RNA-seq results (Table 4).
In most cases, the qRT-PCR results supported RNA-seq data and all these genes can be considered as primary candidates for further R-gene search (detailed information on qRT-PCR is available as Additional files 6 and 7).
Discussion
In this research, two diploid potato specimens from different regions of South America were compared. It has been shown earlier that the accession i-0144786 was susceptible to GPCN, whereas the accession i-0144787 was highly resistant [4]. Interestingly, the resistance observed was not associated with the presence of known R genes widely distributed in S. tuberosum commercial varieties (Gro1–4, H1). Comparative analysis of i-0144786 and i-0144787 accessions revealed considerable differences in general composition of their transcriptomes as well as in the expressed sets of NBS-LRR-encoding genes [35]. Since these S. phureja genotypes from different regions of South America evolved differently, we conducted the detailed comparative study of their root transcriptomes to evaluate both the potential mechanisms of resistance to GPCN and genetic divergence at the root transcriptome level.
The results obtained supported the earlier observations on the considerable difference of these S. phureja genotypes (Figs. 2, 3). The molecular mechanisms associated with resistance to G. rostochiensis juveniles were further analyzed with the aid of AgriGO (Table 1). The experiments includes inoculation of potato plant roots with either water or GPCN juveniles and analysis of samples at 0 hpi (i.e., before inoculation), 24 hpi, and 72 hpi. Indeed, the process of root inoculation results in tissue mechanical wounding per se. Comparison of root transcriptomes of both resistant and susceptible genotypes before inoculation with water (0 hpi) and at 24 hpi revealed upregulation of cell cycle related terms whereas a wide variety of regulatory and metabolic processes were suppressed. This trend was even more pronounced at 72 hpi time point. It is likely that the transcriptome dynamics reflected potato root response on moderate wounding stress resulted from the experiment design and mostly associated with tissue regeneration after damage. Interestingly, the resistant genotype was characterized by considerably stronger response on water-inoculation induced wounding at 24 hpi point whereas such a difference with the susceptible genotype was not observed at 72 hpi (Table 1).
Inoculation of potato roots with GPCN results in a considerably stronger tissue damage because of juveniles penetration and movement in the root cylinder and vascular system. The changes in the transcriptome of the root cells of the susceptible genotype after GPCN inoculation was rather similar to water control: the AgriGO terms for up-regulated DEGs were mostly associated with cell cycle, mitosis (24 hpi, 72 hpi) and a variety of metabolic processes (72 hpi). Since the successful nematodes infestation results in the development of syncytia (feeding sites), the cell cycle and tissue regeneration related AgriGO terms may also reflect this process. The resistant S. phureja reacted to GPCN inoculation quite differently: at 24 hpi point, a variety of stress response related genes was up regulated. This list included terms, associated with oxidative stress, peroxidase activities, peptidase inhibitors, glycosylases. At 72 hpi, the root transcriptome of the resistant genotype reflected a strong response towards biotic stress and related processes (oxidation reduction, peroxidase activity, glycosylases, endopeptidases, proteases, ribonucleases, etc.). Activation of genes associated with tissue regeneration was also detected (cell wall biogenesis, cell division, etc., Table 1). It is likely that these terms may reflect regeneration of root tissues wounded by migrating GPCN juveniles as well as some other processes, e.g. initiation of syncytia, and regeneration after local programmed cell death because of a hypersensitive response. Thus, there is a strong difference in transcriptome dynamics in the roots of resistant and in the roots of susceptible S. phureja genotypes at 0, 24, and 72 hpi. Interestingly, the comparison of transcriptomes between resistant and susceptible genotypes appeared less informative, probably because of the genetic divergence between these accessions. Another observation pointed out the DEGs related to plastid-located metabolic chains. It is likely that processes in plastids may be of importance in establishing resistance and should be taken for further analysis.
In general, the resistant S. phureja genotype is characterized with a more pronounced response to wounding stress as well as a strong induction of biotic stress response genes at 24 hpi point. The resistance mechanism integrates the local hypersensitive response (Fig. 3) together with a systemic induction of defense-related genes (Table 1). GPCN infestation is accompanied with high expression of cell division related genes in both resistant and susceptible genotypes that may reflect tissue regeneration after juveniles’ movement and cell reprogramming by nematode secreted regulatory factors.
It was found that root transcriptomes of S. phureja accessions contained considerable parts of transcripts not annotated in the reference genome and potentially encoding proteins with functional Pfam-annotated domains (Table 2). Natural varieties of potato and other cultivated species are widely used as a source of new breeding traits. Here we demonstrate that de novo transcriptome assembly provides additional data for revealing R genes either improperly annotated or even absent in the reference genome (Table 3). Several NBS-LRR encoding transcripts characteristic for S. phureja resistant genotype were selected for further mapping of major GPCN resistance trait(s) (Table 4).
In this research two natural S. phureja specimens were selected because of their contrasting resistance to GPCN. It is likely that these specimens collected in distant regions of South America evolved under pressure of different pathogens varieties and they bear specific subsets of R genes. Transcriptome analysis provides valuable data on genetic mechanisms of pathogen resistance establishment and novel, potentially useful R genes for their introgression into the breeding program.
Conclusion
The inoculation of diploid potato S. phureja with GPCN juveniles is accompanied with root wounding stress followed by activation of regeneration processes. In the roots of GPCN-resistant S. phureja genotype, the chain of molecular events initiates the hypersensitive response at the juveniles’ invasion sites and provides high-level resistance. It was also demonstrated that comparative transcriptomic analysis is a useful tool to reveal the resistance mechanisms and candidate R-genes. In particular, de novo transcriptome assembling highlights new functional gene variants and considerably extends the reference genome annotation.
Methods
Plant material
Two accessions of diploid cultivated species S. phureja k-11,291 (collected in Peru) and k-9836 (from Bolivia) were obtained from the VIR potato collection (each accession was represented by one clone (genotype) with the VIR INs i-0144787 and i-0144786, respectively). According to plastid SSRs data, these accessions have different haplotypes, indicating their different maternal origins [36, 37]. It was also found that genotype i-0144786 was susceptible to GPCN (Ro1), whereas i-0144787 was highly resistant to GPCN (Ro1) but contains no DNA markers of Gro1–4 and H1 (TG689, 239E4 left/Alu I, and Gro1–4) [4, 35].
Nematode inoculation
A population of G. rostochiensis (pathotype Ro1) originated from Leningrad Region, Russia (Belogorka) was characterized previously [4]. The nematode population was propagated on the susceptible cultivar ‘Nevsky’. Cysts were extracted from soil by the flotation technique and stored at 4 °C. S. phureja plant preparation and their inoculation with GPCN were conducted as described earlier [35]. Infected roots, stained with acid fuchsin were scanned for the presence of nematodes under an AxioScope A1 light microscope (Carl Zeiss, Germany).
RNA extraction
For RNA-seq, S. phureja roots were collected before inoculation (0 h), 24 and 72 h after inoculation with G. rostochiensis (pathotype Ro1). For each genotype, three infected and three control (water-inoculated) plants were taken. It should be noted that the nematode inoculation technique results in some root wounding, thus water-inoculated roots provide an important control for transcriptomes comparison. The roots of these plants were thoroughly rinsed with sterile distilled water, fixed in liquid nitrogen and used for RNA extraction. Total RNA was extracted with an RNeasy Plant Mini Kit (Qiagen).
RNA-seq
The quality of the RNA samples was evaluated using a Bioanalyzer 2100 (Agilent), all samples had RIN 8.2 or higher. Small RNA and total RNA fraction was extracted using mirVana™ miRNA Isolation Kit (Ambion). RNA-seq library preparations were carried out with 1.5 mkg of total RNA fraction using TruSeq® Stranded mRNA LT Sample Prep Kit (Illumina) according to the manufacturer’s instructions for barcoded libraries with small modifications (4 min RNA fragmentation time and 12 PCR cycles were used). Final libraries quantification was performed with a Bioanalyzer 2100 and a DNA High Sensitivity Kit (Agilent). After normalization, barcoded libraries were pooled and sequenced on a NextSeq550 sequencer 2 × 150 bp using a High Density Cassette and NextSeq® 500 High Output v2 Kit 300 cycles (Illumina).
qRT-PCR
RNA samples were treated with DNAse (QIAGEN RNase-Free DNase Set). To prepare single-stranded cDNA by reverse transcription, 1 μg aliquots of total RNA samples were used with a RevertAidTM kit (Thermo Fisher Scientific Inc., Waltham, MA, USA). Primers for qRT-PCR were designed with the aid if OLIGO software. β-tubulin gene was used as a reference (GenBank: Z33382; forward primer 5`-AGCTTCTGGTGGACGTTATG-3`, reverse primer 5`-ACCAAGTTATCAGGACGGAAGA-3`). The qRT-PCR was conducted using a SYNTOL SYBR Green I kit (Syntol, Moscow, Russia). For each reaction, three technical replicates were run.
Bioinformatic analysis of RNA-seq data
Libraries pre-processing
Thirty libraries of paired-end short reads obtained with Illumina NextSeq550 sequencing platform were analyzed. Sequencing quality and length distributions were assessed using FastQC software (https://www.bioinformatics.babraham.ac.uk/projects/fastqc/) version 0.11.5. Cutadapt software version 1.9.1 [38] was used to remove sequencing adapters, and Prinseq-lite software version 0.20.4 [39] was implemented for filtering with the following criteria: length not less than 100 bases, mean Phred quality score not less than 30. In case if one read in a pair did not meet the above criteria, the whole pair was discarded from analysis. Additionally, Prinseq option ‘-derep 1’ was employed in order to remove possible optical replicates.
Libraries of short reads were aligned to the reference genome version SolTub_3.0 taken from Ensembl plants database [29] using STAR aligner version 2.5.3a [40].
Gene expression analysis
EdgeR package for R [41] was implemented to identify the differentially expressed genes (DEGs). First, tables of read counts were filtered to remove genes with expression levels below the threshold (not less than 3 counts per million for not less than 2 of 30 libraries). PlotMDS function of R was used to visualize multi-dimension clustering of the libraries based on the gene expression levels. Second, read counts were normalized using EdgeR function calcNormFactors. The dispersion was evaluated using estimateDisp function of EdgeR. The resulting matrix of pseudo-counts and dispersion values were subjected to glmQLFit function of EdgeR. Finally, glmQLFTest function was used to identify DEGs in the roots transcriptomes collected under different experimental conditions. In addition, read counts were normalized using TPM procedure, and mean TPM values were computed. Genes were classified as differentially expressing if a sum of mean TPM values for the experiments compared was not less than 10, changes in expression levels between experiments as computed by EdgeR were not less than two-fold (|log2(FC)| ≥ 1), and false discovery rate value was less than or equal to 0.05 (FDR ≤ 0.05).
Further, Gene Ontology terms enrichment analysis was performed using online tool ‘Singular Enrichment Analysis’ of AgriGO v2 [42] with default parameters (Fisher test with Yekutieli correction was applied, terms with p < 0.05 were considered significantly enriched). Analysis was conducted separately for groups of up-regulated and down-regulated DEGs.
De novo transcriptomes assembly
De novo assembly of S. phureja transcriptomes was performed using Trinity software version 2.6.5. Transcriptomes of two genotypes were assembled separately from 15 libraries corresponding to resistant or susceptible genotypes. Thus, two ‘master transcriptomes’ were assembled, each corresponding to one of the S. phureja genotypes. Further analysis of assembled transcriptomes included the following steps: redundancy reduction, transcript quantities analysis, genome representation search and Pfam-annotated domains prediction, including NBS and LRR domains prediction.
In order to reduce redundancy of assembled transcriptomes, tr2aacds.pl utility from Evidential Gene pipeline version ‘18may07’ was implemented. This utility identifies open reading frames (ORFs) in assembled contigs, and discards contigs lacking at least one ORF. Then it merges contigs together based on their predicted ORFs – if a sequence of one ORF of one contig is a subsequence of a longer ORF of another contig, the contig with shorter ORF is removed. Resulting sets of contigs were classified as non-redundant. Additionally, this utility identifies amino acid sequences of the proteins corresponding to the predicted ORFs.
BUSCO (Benchmarking Universal Single-Copy Orthologs) software version 3.0.2 [43, 44] was utilized to evaluate the quality of the assemblies. Non-redundant sets of contigs were subjected to BUSCO search against the embryophyta_odb9 database. BUSCO was designed specifically to assess genomes or transcriptomes quality.
To assess contig coverage by short reads of RNA-seq libraries, non-redundant sets of contigs were indexed using bowtie2-build utility (version 2.2.9) [45]. Then, several utilities of Trinity software package were applied to analyze the transcription levels of contigs. First, ‘abundance_estimate_to_matrix’ utility was used. Alignment-based abundance estimation approach was chosen and abundance values for each contig among all libraries were estimated with the aid of eXpress software version 1.5.1. The ‘filter_low_expr_transcripts’ utility was used to remove contigs with expression values below the chosen thresholds based on ‘Transcript Per Million’ (TPM) values. Three Trinity utilities were used to investigate the differential expression of the assembled contigs: ‘run_DE_analysis’, ‘DE_results_to_pairwise_summary’, ‘pairwise_DE_summary_to_DE_classification’. The ‘run_DE_analysis’ utility was run with previously obtained expression values matrix.
To compare the transcriptomes of S. phureja with the reference genome, Blat software version 34 [46] was used. In addition, with the aid of blastn utility of ncbi-blast standalone package version 2.7.1+ [47], non-redundant contigs were aligned to S. tuberosum CDS sequences version 3.0 obtained from Ensembl plants database. Corresponding predicted amino acid sequences of non-redundant contigs were aligned to S. tuberosum peptide sequences version 3.0 obtained from Ensembl plants database with the aid of blastp utility. For functional analysis and domain structure prediction, hmmscan utility of HMMER package (hmmer.org) version 3.1b2 was implemented. Pfam-A.hmm database of Pfam release 31.0 [48] was used as a reference database.
Prediction of de novo assembled transcripts potentially encoding NBS-LRR proteins
NLR-parser software, MEME suite version 4.9.1 [49] and MAST utilities were used for this purpose. Meme.xml file provided by Jupe and co-authors [34] was downloaded from GitHub repository and used as the motif definition file. The search for NBS-LRR motifs in predicted non-redundant amino acid sequences encoded by S. phureja transcriptomes was conducted using MAST. The resulting output file in .xml format was used as an input for NLR-parser software [33].
Particular cDNAs coding for NBS-LRR-like proteins with no homology to the reference genome were additionally analyzed. Nucleotide sequence of contigs were aligned to NCBI nr database using Nucleotide blast tool, and corresponding amino acid sequences were aligned to NCBI non-redundant protein sequences database. Ten best hits among protein sequences were used to create a multiple alignment file with ClustAl Omega web.
Availability of data and materials
Raw sequencing data is deposited in NCBI Sequence Read Archive as BioProject under accession number PRJNA515801 (https://www.ncbi.nlm.nih.gov/bioproject/PRJNA515801).
Change history
15 January 2021
An amendment to this paper has been published and can be accessed via the original article.
Abbreviations
- GPCN:
-
Golden Potato Cyst Nematode
- R gene:
-
Resistance gene
- VIR:
-
Vavilov Institute of Plant Genetic Resources
- DEGs:
-
Differentially expressed genes
- GO:
-
Gene ontology
- ORF:
-
Open reading frame
- BUSCO:
-
Benchmarking Universal Single-Copy Orthologs
- TPM:
-
Transcripts per million
- CDS:
-
Coding DNA sequence
References
Hockland S, Niere B, Grenier E, Blok V, Phillips M, den Nijs L, Anthoine G, Pickup J, Viaene N. An evaluation of the implications of virulence in non-European populations of Globodera pallida and G. rostochiensis for potato cultivation in Europe. Nematology. 2012;14:1–13 https://doi.org/10.1163/138855411X587112.
Evans K, Trudgill DL. Pest aspects of potato production. Part 1. The nematode pests of potatoes. In: Harris P, editor. The potato crop. London: Chapman & Hall; 1992.
Dandurand LM, Zasada IA, Wang X, Mimee B, De Jong W, Novy R, Whitworth J, Kuhl JC. Current status of potato cyst nematodes in North America. Annu Rev Phytopathol. 2019;57:117–33. https://doi.org/10.1146/annurev-phyto-082718-100254.
Limantseva L, Mironenko N, Shuvalov O, Antonova O, Khiutti A, Novikova L, Afanasenko O, Spooner D, Gavrilenko T. Characterization of resistance to Globodera rostochiensis pathotype Ro1 in cultivated and wild potato species accessions from the Vavilov Institute of Plant Industry. Plant Breed. 2014;133:660–5 https://doi.org/10.1111/pbr.12195.
Khiutti AV, Antonova OY, Mironenko NV, Gavrilenko TA, Afanasenko OS. Potato resistance to quarantine diseases. Russ J Genet Applied Res. 2017;7(8):833–44 https://doi.org/10.1134/S2079059717050094.
Friedman W. Pests not known to occur in the United States or of limited distribution, No. 68: Golden Nematode: United States Department of Agriculture, Animal and Plant Health Inspection Service, Plant Protection and Quarantine; 1985. p. 10. https://archive.org/details/CAT31375597/mode/2up.
Winslow RD, Willis RJ. Nematode diseases of potatoes. II. Potato cyst nematode, Heterodera rostochiensis. In: Webster J, editor. Economic Nematology. New York: Academic; 1972. p. 18–34.
Jones LM, Koehler AK, Trnka M, Balek J, Challinor AJ, Atkinson HJ, Urwin PE. Climate change is predicted to alter the current pest status of Globodera pallida and G. rostochiensis in the United Kingdom. Glob Chang Biol. 2017;23(11):4497–507. https://doi.org/10.1111/gcb.13676.
Kearn J, Lilley C, Urwin P, O'Connor V, Holden-Dye L. Progressive metabolic impairment underlies the novel nematicidal action of fluensulfone on the potato cyst nematode Globodera pallida. Pestic Biochem Physiol. 2017;142:83–90. https://doi.org/10.1016/j.pestbp.2017.01.009.
Dandurand LM, Zasada IA, LaMondia JA. Effect of the trap crop, Solanum sisymbriifolium, on Globodera pallida, Globodera tabacum, and Globodera ellingtonae. J Nematol. 2019;51:1–11. https://doi.org/10.21307/jofnem-2019-030.
Trudgill DL, Elliot MJ, Evans K, Phillips MS. The white potato cyst nematode (Globodera pallida) – a critical analysis of the threat in Britain. Ann Appl Biol. 2003;143:73–80 https://doi.org/10.1111/j.1744-7348.2003.tb00271.x.
Catalogue of pesticides and agro-chemicals, used in the territory of the Russian Federation. 2017. https://www.agroxxi.ru/upload/pia/handbook64.zip.
Whitworth JL, Novy RG, Zasada IA, Wang X, Dandurand LM, Kuhl JC. Resistance of potato breeding clones and cultivars to three species of potato cyst nematode. Plant Dis. 2018;102(11):2120–8 https://doi.org/10.1094/PDIS-12-17-1978-RE.
Bakker E, Achenbach U, Bakker J, van Vliet J, Peleman J, Segers B, van der Heijden S, van der Linde P, Graveland R, Hutten R, van Eck H, Coppoolse E, An der Vossen E, Bakker J, Goverse A. A high-resolution map of the H1 locus harboring resistance to the potato cyst nematode Globodera rostochiensis. Theor Appl Genet. 2004;109:146–52. https://doi.org/10.1007/s00122-004-1606-z.
Barone A, Ritter E, Schachtschabel U, Debener T, Salamini F, Gebhardt C. Localization by restriction fragment length polymorphism mapping in potato of a major dominant gene conferring resistance to the potato cyst nematode Globodera rostochiensis. Mol Gen Genet. 1990;224:177–82 https://doi.org/10.1007/BF00271550.
Ballvora A, Hesselbach J, Niewöhner J, Leiste D, Salamini F, Gebhardt C. Marker enrichment and high-resolution map of the segment of potato chromosome VII harbouring the nematode resistance gene Gro1. Mol Gen Genet. 1995;249:82–90 https://doi.org/10.1007/BF00290239.
Strachan SM, Armstrong MR, Kaur A, Wright KM, Lim TY, Baker K, Jones J, Bryan G, Blok V, Hein I. Mapping the H2 resistance effective against Globodera pallida pathotype Pa1 in tetraploid potato. Theor Appl Genet. 2019;132(4):1283–94 https://doi.org/10.1007/s00122-019-03278-4.
Mejias J, Truong NM, Abad P, Favery B, Quentin M. Plant proteins and processes targeted by parasitic nematode effectors. Front Plant Sci. 2019;10:970. https://doi.org/10.3389/fpls.2019.00970.
Kaloshian I, Desmond OJ, Atamian HS. Disease resistance-genes and defense responses during incompatible interactions. In: Jones J, Gheysen G, Fenoll C, editors. Genomics and molecular genetics of plant–nematode interactions. New York: Springer; 2011. p. 309–24.
Bayless AM, Zapotocny RW, Grunwald DJ, Amundson KK, Diers BW, Bent AF. An atypical N-ethylmaleimide sensitive factor enables the viability of nematode-resistant Rhg1 soybeans. Proc Natl Acad Sci U S A. 2018;115(19):E4512–21. https://doi.org/10.1073/pnas.1717070115.
Butler KJ, Chen S, Smith JM, Wang X, Bent A. Soybean resistance locus Rhg1 confers resistance to multiple cyst nematodes in diverse plant species. Phytopathology. 2019;109(12):2107–15. https://doi.org/10.1094/PHYTO-07-19-0225-R.
Kud J, Wang W, Gross R, Fan Y, Huang L, Yuan Y, Gray A, Duarte A, Kuhl JC, Caplan A, Goverse A, Liu Y, Dandurand LM, Xiao F. The potato cyst nematode effector RHA1B is a ubiquitin ligase and uses two distinct mechanisms to suppress plant immune signaling. PLoS Pathog. 2019;15(4):e1007720. https://doi.org/10.1371/journal.ppat.1007720.
Holbein J, Grundler FM, Siddique S. Plant basal resistance to nematodes: an update. J Exp Bot. 2016;67:2049–61. https://doi.org/10.1093/jxb/erw005.
Zhang C, Chen H, Cai T, Deng Y, Zhuang R, Zhang N, Zeng Y, Zheng Y, Tang R, Pan R, Zhuang W. Overexpression of a novel peanut NBS-LRR gene AhRRS5 enhances disease resistance to Ralstonia solanacearum in tobacco. Plant Biotechnol J. 2017;15(1):39–55. https://doi.org/10.1111/pbi.12589.
Kochetov AV, Titov SE, Kolodyazhnaya YS, Komarova ML, Koval VS, Makarova NN, Ilyinskyi YY, Trifonova EA, Shumny VK. Tobacco transformants bearing antisense suppressor of proline dehydrogenase gene are characterized by higher proline content and cytoplasm osmotic pressure. Russ J Genet. 2004;40:216–8 https://doi.org/10.1023/B:RUGE.0000016999.53466.e1.
Trifonova EA, Sapotsky MV, Komarova ML, Scherban AB, Shumny VK, Polyakova AM, Lapshina LA, Kochetov AV, Malinovsky VI. Protection of transgenic tobacco plants expressing bovine pancreatic ribonuclease against tobacco mosaic virus. Plant Cell Rep. 2007;26:1121–6. https://doi.org/10.1007/s00299-006-0298-z.
Sugawara T, Trifonova EA, Kochetov AV, Kanayama Y. Expression of extracellular ribonuclease gene increases resistance to cucumber mosaic virus in tobacco. BMC Plant Biol. 2016;16(Suppl 3):246. https://doi.org/10.1186/s12870-016-0928-8.
Li X, Zhang Y, Yin L, Lu J. Overexpression of pathogen-induced grapevine TIR-NB-LRR gene VaRGA1 enhances disease resistance and drought and salt tolerance in Nicotiana benthamiana. Protoplasma. 2017;254:957–69. https://doi.org/10.1007/s00709-016-1005-8.
Kersey PJ, Allen JE, Allot A, Barba M, Boddu S, Bolt BJ, Carvalho-Silva D, Christensen M, Davis P, Grabmueller C, Kumar N, Liu Z, Maurel T, Moore B, MD MD, Maheswari U, Naamati G, Newman V, Ong CK, Paulini M, Pedro H, Perry E, Russell M, Sparrow H, Tapanari E, Taylor K, Vullo A, Williams G, Zadissia A, Olson A, Stein J, Wei S, Tello-Ruiz M, Ware D, Luciani A, Potter S, Finn RD, Urban M, Hammond-Kosack KE, Bolser DM, De Silva N, Howe KL, Langridge N, Maslen G, Staines DM, Yates A. Ensembl Genomes 2018: an integrated omics infrastructure for non-vertebrate species. Nucleic Acids Res. 2018;46(D1):D802–8. https://doi.org/10.1093/nar/gkx1011.
Kochetov AV, Sirnik OA, Rogozin IB, Glazko GV, Komarova ML, Shumny VK. Contextual features of higher plant mRNA 5′-untranslated regions. Mol Biol. 2002;36(4):649–56 https://doi.org/10.1023/A:1019852427093.
Kochetov AV, Sarai A. Translational polymorphism as a potential source of plant proteins variety in Arabidopsis thaliana. Bioinformatics. 2004;20:445–7. https://doi.org/10.1093/bioinformatics/btg443.
Ventoso I, Kochetov A, Montaner D, Dopazo J, Santoyo J. Extensive translatome remodeling during ER stress response in mammalian cells. PLoS One. 2012;7(5):e35915. https://doi.org/10.1371/journal.pone.0035915.
Steuernagel B, Jupe F, Witek K, Jones JD, Wulff BB. NLR-parser: rapid annotation of plant NLR complements. Bioinformatics. 2015;31(10):1665–7. https://doi.org/10.1093/bioinformatics/btv005.
Jupe F, Witek K, Verweij W, Śliwka J, Pritchard L, Etherington GJ, Maclean D, Cock PJ, Leggett TM, Bryan GJ, Cardle L, Hein I, Jones JD. Resistance gene enrichment sequencing (RenSeq) enables reannotation of the NB-LRR gene family from sequenced plant genomes and rapid mapping of resistance loci in segregating populations. Plant J. 2013;76:530–44. https://doi.org/10.1111/tpj.12307.
Kochetov AV, Glagoleva AY, Strygina KV, Khlestkina EK, Gerasimova SV, Ibragimova SM, Shatskaya NV, Vasilyev GV, Afonnikov DA, Shmakov NA, Antonova OY, Gavrilenko TA, Alpatyeva NV, Khiutti A, Afanasenko OS. Differential expression of NBS-LRR-encoding genes in the root transcriptomes of two Solanum phureja genotypes with contrasting resistance to Globodera rostochiensis. BMC Plant Biol. 2017;17(Suppl 2):251. https://doi.org/10.1186/s12870-017-1193-1.
Gavrilenko T, Antonova O, Ovchinnikova A, Novikova L, Krylova E, Mironenko N, Pendinen G, Islamshina A, Shvachko N, Kiru S, Kostina L, Afanasenko O, Spooner DA. Microsatellite and morphological assessment of the Russian National Potato Collection. Genet Res Crop Evol. 2010;57:1151–64. https://doi.org/10.1007/s10722-010-9554-8.
Gavrilenko T, Antonova O, Shuvalova A, Krylova E, Alpatyeva N, Spooner D, Novikova L. Genetic diversity and origin of cultivated potatoes based on plastid microsatellite polymorphism. Genet Res Crop Evol. 2013;60:1997–2015. https://doi.org/10.1007/s10722-013-9968-1.
Martin M. Cutadapt removes adapter sequences from high-throughput sequencing reads. EMBnet.Journal. 2011; https://doi.org/10.14806/ej.17.1.200.
Schmieder R, Edwards R. Quality control and preprocessing of metagenomic datasets. Bioinformatics. 2011;27(6):863–4. https://doi.org/10.1093/bioinformatics/btr026.
Dobin A, Davis CA, Schlesinger F, Drenkow J, Zaleski C, Jha S, Batut P, Chaisson M, Gingeras TR. STAR: Ultrafast universal RNA-seq aligner. Bioinformatics. 2013;29(1):15–21. https://doi.org/10.1093/bioinformatics/bts635.
Robinson MD, McCarthy DJ, Smyth GK. edgeR: a bioconductor package for differential expression analysis of digital gene expression data. Bioinformatics. 2010;26(1):139–40. https://doi.org/10.1093/bioinformatics/btp616.
Du Z, Zhou X, Ling Y, Zhang Z, Su Z. agriGO: a GO analysis toolkit for the agricultural community. Nucleic Acids Res. 2010;38:W64–70. https://doi.org/10.1093/nar/gkq310.
Simão FA, Waterhouse RM, Ioannidis P, Kriventseva EV, Zdobnov EM. BUSCO: assessing genome assembly and annotation completeness with single-copy orthologs. Bioinformatics. 2015;31(19):3210–2. https://doi.org/10.1093/bioinformatics/btv351.
Waterhouse RM, Seppey M, Simão FA, Manni M, Ioannidis P, Klioutchnikov G, Kriventseva EV, Zdobnov EM. BUSCO applications from quality assessments to gene prediction and phylogenomics. Mol Biol Evol. 2018;35(3):543–8. https://doi.org/10.1093/molbev/msx319.
Langmead B, Salzberg S. Fast gapped-read alignment with bowtie 2. Nat Methods. 2012;9:357–9. https://doi.org/10.1038/nmeth.1923.
Kent WJ. BLAT - the BLAST-like alignment tool. Genome Res. 2002;12(4):656–64. https://doi.org/10.1101/gr.229202.
Camacho C, Coulouris G, Avagyan V, Ma N, Papadopoulos J, Bealer K, Madden TL. BLAST+: architecture and applications. BMC Bioinf. 2009;10:1–9. https://doi.org/10.1186/1471-2105-10-421.
Finn RD, Coggill P, Eberhardt RY, Eddy SR, Mistry J, Mitchell AL, Potter SC, Punta M, Qureshi M, Sangrador-Vegas A, Salazar GA, Tate J, Bateman A. The Pfam protein families database: towards a more sustainable future. Nucleic Acids Res. 2016;44(D1):D279–85. https://doi.org/10.1093/nar/gkv1344.
Bailey TL, Boden M, Buske FA, Frith M, Grant CE, Clementi L, Ren J, Li WW, Noble WS. MEME suite: tools for motif discovery and searching. Nucleic Acids Res. 2009;37:W202–8. https://doi.org/10.1093/nar/gkp335.
Acknowledgements
The authors are grateful to Daria Kochetova for English editing.
About this supplement
This article has been published as part of BMC Plant Biology Volume 20 Supplement 1, 2020: Selected articles from the 5th International Scientific Conference “Plant genetics, genomics, bioinformatics, and biotechnology” (PlantGen2019). The full contents of the supplement are available online at https://bmcplantbiol.biomedcentral.com/articles/supplements/volume-20-supplement-1.
Funding
This investigation was supported by a grant from the Russian Science Foundation (RSF) No. 16–16-04073 (including the publication costs, design of the study, experiments with plants, transcriptomes sequencing, writing the manuscript). In addition, the bioinformatic software pipelines for plant genome and transcriptome analyses were supported by grant from Kurchatov Genomics Center of IC&G (075–15–2019-1662; for S.V.G., D.A., N.A.S. and G.V.V.). Plants for experiments were cultivated and prepared for experiments in the IC&G greenhouse facility (supported in the frame of ICG budget project 0324–2019-0039). NGS sequencing was performed in the Center for Genome Studies of ICG.
Author information
Authors and Affiliations
Contributions
AVK designed this research and wrote the manuscript. OSA and AK performed the experimental portions of GPCN inoculation and resistance evaluation. GVV prepared libraries, carried out the sequencing of the libraries on the NextSeq550 platform and participated in data interpretation. NVS participated in the preparation and sequencing of the libraries. KVS, AYG, and SVG participated in the extraction of RNA, preparation of cDNA, design of qRT-PCR reference gene primers, performance of qRT-PCRs and drafting of the manuscript. NAS, AAE and DAA performed in silico analysis of the sequencing data and participated in the drafting of the manuscript. EKK and SMI contributed to the design and coordination of the study and to revising the manuscript critically. OYA and NVA prepared the S. phureja plant materials for GPCN inoculation, carried out the extraction of RNA from S. phureja roots and participated in data interpretation. TAG proposed to use the selected S. phureja genotypes in this study, provided this material and participated in the coordination of the study. All authors read and approved the final manuscript.
Corresponding author
Ethics declarations
Ethics approval and consent to participate
Not applicable.
Consent for publication
Not applicable.
Competing interests
The authors declare that they have no competing interests.
Additional information
Publisher’s Note
Springer Nature remains neutral with regard to jurisdictional claims in published maps and institutional affiliations.
This article has been updated. The original publication contained an incorrect history date.
Supplementary information
Additional file 1.
File contains statistics of transcriptome libraries.
Additional file 2.
File contains full lists of differentially expressed genes for all the experimental conditions.
Additional file 3.
File contains full lists of GO terms for all the comparisons / experimental conditions.
Additional file 4.
File contains the characteristics of de novo assembled transcripts.
Additional file 5.
File contains the description of transcripts potentially encoding the NBS-LRR-related proteins.
Additional file 6.
The description of gene-specific primers used for cDNA (qRT-PCR) amplifications.
Additional file 7.
File contains the results of qRT-PCR validation of DEGs.
Rights and permissions
Open Access This article is licensed under a Creative Commons Attribution 4.0 International License, which permits use, sharing, adaptation, distribution and reproduction in any medium or format, as long as you give appropriate credit to the original author(s) and the source, provide a link to the Creative Commons licence, and indicate if changes were made. The images or other third party material in this article are included in the article's Creative Commons licence, unless indicated otherwise in a credit line to the material. If material is not included in the article's Creative Commons licence and your intended use is not permitted by statutory regulation or exceeds the permitted use, you will need to obtain permission directly from the copyright holder. To view a copy of this licence, visit http://creativecommons.org/licenses/by/4.0/. The Creative Commons Public Domain Dedication waiver (http://creativecommons.org/publicdomain/zero/1.0/) applies to the data made available in this article, unless otherwise stated in a credit line to the data.
About this article

Cite this article
Kochetov, A.V., Egorova, A.A., Glagoleva, A.Y. et al. The mechanism of potato resistance to Globodera rostochiensis: comparison of root transcriptomes of resistant and susceptible Solanum phureja genotypes. BMC Plant Biol 20 (Suppl 1), 350 (2020). https://doi.org/10.1186/s12870-020-02334-2
Received:
Accepted:
Published:
DOI: https://doi.org/10.1186/s12870-020-02334-2