
Abstract
TV series have gained both economic and cultural relevance. Their development over time can hardly be traced back to the simple programmatic action of creative intentionality. Instead, TV series might be studied as narrative ecosystems with emergent trends and patterns. This paper aims to boost quantitative research in the field of media studies, first considering a comparative and data-driven study of the narrative features in the US medical TV series, one of the most popular and longest-running genres on global television. Based on a corpus of more than 400 h of video, we investigate the storytelling evolution of eight audiovisual serial products by identifying three main narrative features (i.e., isotopies). The implemented schematization allows to grasp the basic components of the social interactions showing the strength of the medical genre and its ability to rebuild, in its microcosm, the essential traits of the human macrocosm where random everyday life elements (seen in the medical cases plot) mix and overlap with working and social relationships (professional plot) and personal relationships (sentimental plot). This study relies on data-driven research that combines content analysis and clustering analysis. It significantly differs from traditional studies regarding the narrative features of medical dramas and broadly the field of television studies. We proved that the three isotopies are good descriptors for the medical drama genre and identified four narrative profiles which emphasize the strong stability of these serial products. Contrary to what is often taken for granted in many interpretative studies, creative decisions rarely significantly change the general narrative aspects of the wider series.
Introduction
This paper aims to boost studies on the systemic aspects of television series, first considering a comparative and data-driven study of the narrative features. The goal is to enrich the understanding of the narrative dynamics of these products and their evolution over time. This work is part of a broader research project that sees television series as fully-fledged narrative ecosystemsFootnote 1 (Innocenti and Pescatore, 2012, 2018; Pescatore et al., 2014; Rocchi and Pescatore, 2019): complex systems enduring in time and extended in media space, whose evolution is driven by multiple factors, both internal (narrative trends and constraints) and external (production, distribution, consumption, regulatory and more generally social context trends and constraints). The main purpose is to combine the theory represented by the paradigm of narrative ecosystems with a methodology useful to identify, quantify and analyse the narrative structure of serial fictional products from a data-driven perspective.
Serial products differ from other cultural objects—which are usually closely tied to the author’s intent—in that they develop, at least partially, independently from a single predefined project, and evolve in relation to a range of contingent factors (i.e., internal to the text and/or in response to production and reception). Within this context, the development of serial products over time can hardly be traced back to the simple programmatic action of creative intentionality. For this reason, limiting ourselves for the moment to narrative features, we have set aside categories such as authorship and textuality, in favour of a data-oriented vision that considers the objects of investigation in their entirety as datasets. Through an exploratory study, we aim to analyse the evolutionary dynamics and identify specific patterns that mainly concern the narrative aspects of serial audiovisual products (i.e., narrative profiles). The investigation is conducted on a sample related to serial products that belong to the medical drama genre, which is one of the most popular and longest-running genres on global television. The medical genre has taken on significant weight and relevance in light of the broad interest of the academic community (Chung, 2014; Harris and Willoughby, 2009; Albuquerque and Meimaridis, 2016; Hoffman et al., 2018; Rocchi, 2019; Warner, 2015) and the recent public health emergency. Moreover, medical drama has the advantage of being a genre almost completely ascribed to broadcast television. This has allowed it to constitute a rather homogeneous corpus that avoids analytical results attributable to different production and/or distribution models rather than to the analysed phenomena.
We restricted our corpus to the US medical drama over the last 20 years, considering the extremely wide international diffusion of American productions. In particular, our exploratory data analysis is based on eight medical TV series: Grey’s Anatomy (ABC, 2005–), Miami Medical (CBS, 2010), The Night Shift (NBC, 2014–2017), Chicago Med (NBC, 2015–), Code Black (CBS, 2015–2018), The Good Doctor (ABC, 2017–), The Resident (Fox, 2018–), and New Amsterdam (NBC, 2018–).Footnote 2 For these products, we have built a dataset related to their narrative structure that employs content analysis. This methodology is widely used for the study of media products (Barker et al., 2020; Blanco-Herrero and Rodríguez-Contreras, 2019; Chapoton et al., 2020; Fernandez‐Collado et al., 1978; González-de-Garay et al., 2020; Himes and Thompson, 2007; Lo and Huang, 2021; Signorielli and Bacue, 1999) and consists of qualitative and quantitative tools. The essay relies on previous work based on interpretative hypotheses and methodological aspects related to the study of medical dramas, and in particular, to the assumption of the presence of isotopiesFootnote 3 outlined by the characters’ interactions (Rocchi and Pescatore, 2019). According to these hypotheses, in this paper, we investigate for the first time from a quantitative point of view the narrative structure of the selected products through three isotopies that distinguish the medical genre: the medical cases plot, the professional plot, and the sentimental plot.Footnote 4 If the medical cases plot is related to patients and diseases that normally change within each episode (anthology plot), the professional and the sentimental plots define the inter-episodic narration that extends through the whole series and refers to the relationships between the main characters (running plot).Footnote 5
Within this context we are guided by three main research questions:
RQ1: Are isotopies (i.e., the medical cases plot, the professional plot, and the sentimental plot) good descriptors for the medical drama genre?
RQ2: Are there any differences within the formulaic aspectsFootnote 6 of these series? Are there any significant differences considering the relationship between the three isotopies within different series? Does the sentimental plot, professional plot, or medical cases plot articulate themself differently from a quantitative point of view considering different series?
RQ3: How do the narrative plots of a medical drama change over time?
Thanks to this exploratory data analysis we aim to think critically about how ‘answerable’ the above research questions are if they match our expectations, and what insights we can gain. To our knowledge, this study is the first exploratory data analysis based on a corpus of more than 400 h of video and it significantly differs from traditional studies regarding the narrative structure of medical dramas (Rocchi and Pescatore, 2019). To answer the research questions, the paper is organized into four main sections: (i) presentation of the content analysis protocol developed for the analysis of audiovisual products; (ii) clustering analysis method; (iii) exploratory data analysis of the dataset; and (iv) conclusions.
Building a dataset: audiovisual content analysis
Coding is a key aspect of the analysis process and represents how a researcher breaks down data to offer “the opportunity for reflexivity, a critical self-evaluation of the research process” (Cope, 2010, p. 285). The objectives of coding are data reduction, organization, and initial exploration and analysis (Elliott, 2018).
To determine whether and how the three isotopies of medical products change over time and thus assess their evolution patterns, we developed an ad hoc experimental protocol to measure the “narrative space” occupied by each one.Footnote 7 The methodology implemented included a mix of qualitative and quantitative methods based on the coding process (Saldaña, 2016; Elliott, 2018) and data collection. In particular, the coding process relied on a priori approach (deductive coding)Footnote 8 in which a pre-set of codes was identified (i.e., the three isotopies characterizing medical serial products).
The coding process consists of several steps and involves a body of analysis consisting of eight different medical dramas for a total of 32 seasons and 608 coded episodes (Table 1).
STEP 1. Definition and characterization of serial product isotopies
The following part provides a brief description of the interpretive hypothesis about the three isotopies identified: the medical cases plot, the professional plot, and the sentimental plot (Rocchi and Pescatore, 2019). As previously underlined, the medical cases plot is related to those storylines that usually change within each episode allowing the introduction of new narrative elements into the hospital environment. The medical cases plot provides the opportunity to include a particularly large number of new characters in the story, through which the main characters interface and are challenged both professionally (through the resolution of cases) and emotionally (through the self-reflections that are triggered). In addition to the specific clinical treatments, the medical cases plot includes also all the storylines connected to the characters introduced. The clinical cases thus guarantee the continuous introduction of elements of novelty and help shape the vertical narrative that makes up the anthology plot.Footnote 9 In addition to the medical cases plot, we considered the other two isotopies (i.e., the professional plot and the sentimental plot) that tie together the episodes of the entire series maintaining the continuity of the story and offering the viewer a complete narrative, consisting of small clinical cases grafted into a larger and more complex story. Therefore, they allow the development and the narrative evolution of the running plot. In particular, the professional plot detects those relationships related to the professional sphere between doctors, residents, nurses, and head physicians within the hospital. It refers to coded relationships in the medical genre such as professional and power hierarchical relationships, career competition, and ethical choices. Instead, the sentimental plot considers the wide sphere of emotional and intimate relationships (e.g., friendship, love, empathy, conflict) between the main characters that persist throughout the series.
STEP 2. Definition of the units of analysis of the audiovisual product
To evaluate the time devoted to each plot, it was necessary to adopt a breakdown process of the narrative flow, considering a unit of analysis (which we call a segment) a specific portion of the audiovisual product that is characterized both by space–time–action continuity and invariance in the thematic-narrative elements (i.e., isotopies). Since there were no automated methods available for the segment selection, considering our dual definition, we proceeded with data collection for each episode by implementing a manual division through the identification of start times and end times.Footnote 10 The boundary between one segment and another is established when a content unit (i.e., segment) characterized by space–time–action continuity ends and another begins and/or when there is a change in isotopy.
STEP 3. Assignment of isotopies to the analysis units
This is the actual coding phase in which the appropriate isotopy is assigned, where possible, to each previously identified segment. The isotopies must be considered in their syntagmatic development and not as a sequence of independent segments. For this reason, coders are required to have prior knowledge of the series they are dealing with. The categorization refers to the thematic-narrative elements that underlie the three isotopies (professional plot, sentimental plot, and medical cases plot) and that are articulated in various types of relationshipsFootnote 11 such as power/hierarchy relationships, competition and training relationships, conflict relationships for the professional plot that refer to the work environment and therefore only to the relationships between colleagues; couple and sexual relationships, friendship and family relationships, conflict relationships for friendship/love issues for a sentimental plot that is related to the emotional sphere of the main protagonist; detection relationships, empathic relationships and/or moral support for the medical cases plot that refers to the doctor–patient relationship or the history of the individual patient. To each segment deemed categorizable, plot assignment was accompanied by the attribution of weight from 1 to 6. When a segment was attributable to a single plot, a weight of 6 was assigned to the corresponding plot. However, there were cases in which a segment could not be attributed to a single plot because there were overlaps between narrative lines. In these cases, the attribution of weights was based on both the main frame of reference and the amount of time devoted to the overlapping plots within the single segment (Rocchi and Pescatore, 2019, p. 114). In other cases, segments were not attributable to one of the three isotopies and were therefore classified as uncoded (e.g., landscape contextualization scenes, initial titles).
STEP 4. From weight to time
After decomposing the audiovisual products into segments and assigning them one or more isotopies, we calculated for each segment the time devoted to the professional plot, the sentimental plot, and the medical case plot on the basis of code and weight assignment. For example, if a 66-s segment was assigned to the sentimental plot with a weight of 4 and to the professional plot with a weight of 2, we would assign 44 s to the sentimental plot and 22 s to the professional plot. In this way, we obtained for each analysed series a time series describing the narrative evolution of the isotopies derived from the segmentation and coding process.
The application of this protocol to audiovisual products allowed for the measuring of “narrative biomass” through the time used by each isotopy (a priori coding). However, there were some critical aspects. The first concerned the reliability of the coding process, which was strongly influenced by the analyst’s skills. Errors can be accidental or systemic. The former, due to the lack of accuracy of the coder (e.g., mistiming or randomly reversing isotopy attribution), can be contained by duplicating or multiplying the coding process. The second, due to a misunderstanding of the coding methods (e.g., the coder attributes a kiss between two patients to the sentimental plot), is easily replicated from one coder to another and can be contained by training the coders. In our case the first type of error is less significant because it is not directional and on aggregate data and mean values such as ours it tends to compensate. On the contrary, the second one exhibits a directionality always acting in the same direction (e.g., decreasing the medical cases plot and increasing the sentimental plot), and therefore in our case, it is much more dangerous because it alters the relationships between isotopies. To minimize this problem, the coders were properly trained with a detailed description of the plots to help them in the decision-making process related to the assignment of isotopies to segments. Also, all coding activity was reviewed by the same supervisor. Finally, we assessed the consistency of the coding process through the intra-coder reliability (i.e., the consistency over time with the same researcher) which together with the inter-coder reliability (i.e., the consistency between researchers) is a type of reliability suggested in the literature (Elliott, 2018, p. 2858).Footnote 12 Reliability in the main sample was measured by having 15% of the episodesFootnote 13 recoded by the supervisor after 2 years and by computing the Intraclass Correlation Coefficient (Krippendorf, 1980) since the content-coding involved variables in the form of continuous scales and frequency sums of each isotopy at the episode level. All the measured Intraclass Correlation Coefficients for the episode-level variables were above the accepted level of 0.80 (Kassarjian, 1977) [sentimental plot (0.97), professional plot (0.81), medical cases plot (0.92)]. The second critical aspect concerned the time required for coding. This was a time-consuming analysis and, unfortunately, we could not mitigate the impact of this factor.
The clustering analysis method
In order to answer the identified research questions, we made use of cluster analysis, a relevant and popular data mining method for discovering knowledge in multidimensional data in many fields (e.g., cancer research, marketing, and city planning). The goal of clustering is to identify patterns or groups of similar units within a dataset of interest (i.e., clusters). A cluster refers to a collection of data aggregated together because of certain similarities. Each group contains observations with a similar profile according to specific criteria. Cluster analysis is one type of unsupervised machine learning—“unsupervised” because we are not guided by a priori ideas of which variables belong in which clusters (Kassambara, 2017, p. 3). According to the literature, “unsupervised clustering algorithms identify inherent groupings within the unlabelled data and subsequently assign a label to each data value” (cf. Alloghani et al., 2020).
To answer RQ1 we aggregated our dataset into single seasons.Footnote 14 In particular, we considered for each of the 32 seasons a vector of four values defined by the median values of the three isotopiesFootnote 15 and the median value of the uncoded content (i.e., referring to those aspects that could not be traced back to the three main isotopies). Before applying any clustering method, it is important to evaluate whether the dataset contains meaningful clusters (i.e., non-random structures). To assess clustering tendency, we used a statistical method called the Hopkins statistic (Lawson and Jurs, 1990), which tests the spatial randomness of the data by measuring the probability that a given dataset is generated by uniform data distribution. The null and the alternative hypotheses are defined as follows: (i) null hypothesis: the dataset D is uniformly distributed (i.e., no meaningful clusters H < 0.5); (ii) alternative hypothesis: the dataset D is not uniformly distributed (i.e., contains meaningful clusters H > 0.5). After this check, is possible to apply different types of clustering methodsFootnote 16 and before their implementation, it was considered important to determine the optimal number of clustersFootnote 17, the best clustering method for a given datasetFootnote 18 and evaluate how stable a given cluster is (i.e., we assess if the identified cluster structure holds up under plausible variations in the dataset).
Results: exploratory data analysis
We divided the presentation of results according to the identified research questions.
RQ1: Are isotopies good descriptors for the medical drama genre?
The first research question aimed at first determining whether the interpretive hypotheses (i.e., the three isotopies in the medical drama genre) used in the coding process are indeed good descriptors of the medical genre and therefore validate the method. We measured the goodness of descriptors in two main steps by using the Hopkins statistic test and by the analysis of the results of the clustering method. First of all, we conducted the Hopkins statistic test and rejected the null hypothesis (H = 0.634). We conclude that the medical dramas dataset is a considerable clusterizeable one and contains meaningful clusters. After this check, we continued with the application of the methods. From our investigation, it was not possible to define an optimal number of clusters in the dataset. Indeed, each method (Elbow, silhouette, and gap statistic methods) showed a different optimal number of clusters when applied to the medical drama dataset (respectively, four clusters with Elbow method, three clusters with silhouette, and two with gap statistic). Therefore we decided to implement hierarchical clustering because it does not require pre-specifying the number of clusters to be generated and because it is the method that performs best according to internal measuresFootnote 19 and stability measures.Footnote 20
The result of hierarchical clusteringFootnote 21 is a tree-based representation of the objects, also known as a dendrogram where observations can be subdivided into groups (Fig. 1).

Cluster dendrogram (a) and cluster plot (b).
The data showed that the three isotopies identified for the analysis of medical dramas are effectively good descriptors of these products. Indeed, individual seasons, considered according to these parameters, group together in four clusters that tend to reconstruct the series they belong to. We could have also obtained another result: if we had a random distribution of the seasons belonging to the various series in the clusters this would have invalidated the ability of the descriptors considered to discriminate different products. Through the clusterboot algorithm (Hennig, 2007, 2008) we evaluate how stable are the four identified clusters using 100 bootstrap iterations and all four values are close to 1 indicating stable clusters. The chosen variables (the narrative isotopies) are able to discriminate between the single series and/or groups of series with similar characteristics. The cluster distinguished by triangles in the cluster plot (Fig. 1b), for example, groups most of the seasons of Grey’s Anatomy (GA) (cluster stability = 0.978) except the first two, which cluster with The Resident (TR) (cluster stability = 0.925), in the cluster identified by round dots (Fig. 1b). In the cluster marked by crosses (Fig. 1b), we find a heterogeneous cluster made up of seasons of Chicago Med (CM), The Night Shift (TNS), The Good Doctor (TGD), and New Amsterdam (NA) (cluster stability = 0.992). The one characterized by squares (Fig. 1b) is the cluster identified by Code Black (CB) and Miami Medical (MM) (cluster stability = 0.955).
Having validated the coding system and the legitimacy of the interpretative hypotheses, we move on to the second research question.
RQ2: Are there any differences within the formulaic aspects of this series?
The second research question is aimed at providing an overall static vision of what we can define as the serial formula of the medical drama genre. We started out wondering if there might be differences to identify and analyse. Considering the value of individual isotopies in each episode, there are significant differences between the series (i.e., each series shows differences from the others comparing the same isotopy),Footnote 22 thus it makes sense to proceed with further analysis.
To answer RQ2 we calculated the typical episode of each series. The typical episode represents a fictitious episode in which each series is defined by four percentage values, one for each isotopy and one for the not coded content (i.e., referring to those aspects that could not be traced back to the three isotopies). The typical episode represents the ratio between the narrative biomasses and in particular how much the three isotopies are quantitatively present. These values are calculated by considering the median of the isotopy values for the entire series (i.e., throughout the episodes and seasons).
A 3D scatter plot is useful to display the data on three axes (x, y, and z; often called an XYZ plot) to show an overview and the relationship between the three isotopies.Footnote 23 For this diversification the preliminary investigations highlight how Grey’s Anatomy differs from all the other products considered so far, thus proving to be the series with the largest soap component (the sentimental plot actually occupies 48% of the narrative space—Fig. 2 and Table 2).

The dots identify in space the characteristics of the eight medical series under preliminary investigation considering the average percentage for the three isotopies identified within the genre (sentimental plot, professional plot, medical cases).
To understand how similar or different the typical episodes of the series are from each other, we applied the procedure of cluster analysis previously described. While we formerly used a dataset consisting of median values for individual seasons (32 seasons defined by a vector of four values), we now consider values for individual series (eight series defined by a vector of four values). The resultFootnote 24 of hierarchical clustering is the dendrogram in Fig. 3. From the analysis of the clusters of typical episodes of each series, the differentiation of Grey’s Anatomy from the rest of the medical productions is evident. In Grey’s Anatomy, the sentimental plot is the most represented, while the other products show a prevalence of a plot dedicated to medical cases (anthology plot). In particular, Miami Medical and Code Black present a higher incidence of the anthology plot compared to the other series analysed. The medical cases plot in the typical episode of Miami Medical represents 70% of the narrative time, while in Code Black the figure is 67%. The remaining five series (Chicago Med, The Night Shift, The Good Doctor, New Amsterdam, The Resident) all belong to the same branch of the dendrogram but are split into two clusters. Specifically, the cluster of Chicago Med, The Night Shift, and The Good Doctor differs from that of New Amsterdam and The Resident primarily in the professional plot. In Chicago Med, The Night Shift, and The Good Doctor the professional plot accounts for 8%, 6%, and 9%, respectively, while in New Amsterdam and The Resident its presence in the typical episode is much higher (16% and 19%, respectively).

Clustering dendrogram.
Based on the formulaic aspects taken into consideration we can identify four possible profiles within medical dramas:
-
1.
The soap formula: Grey’s Anatomy. As we have seen, Grey’s Anatomy differs from all the other medical series examined for the strong prevalence of sentimental isotopy. A comparative analysis extended to other serial genres (such as teen drama) might highlight a similarity with series that particularly stress the sentimental dimension. It is easy to think that the particular narrative formula could be connected with the long duration of the series, however, it must be said that procedurals series are usually among the longest-running (e.g., Law & Order, CSI, NCIS), even though they privilege the anthology dimension. We are in the process of coding ER (NBC, 1994–2009) and House (Fox, 2004–2012), two long-running medical dramas that, compared with Grey’s Anatomy, may offer additional insight. It should be noted that Grey’s Anatomy debuted with a narrative formula that was quite similar to that of the other medical dramas (see Fig. 4). The change occurred, as shown in the graph, from the third season, probably due to a different arrangement of the series that coincided with the change of position in the ABC network schedule from Sunday to Thursday.
Fig. 4: Evolution of the TV series over time. 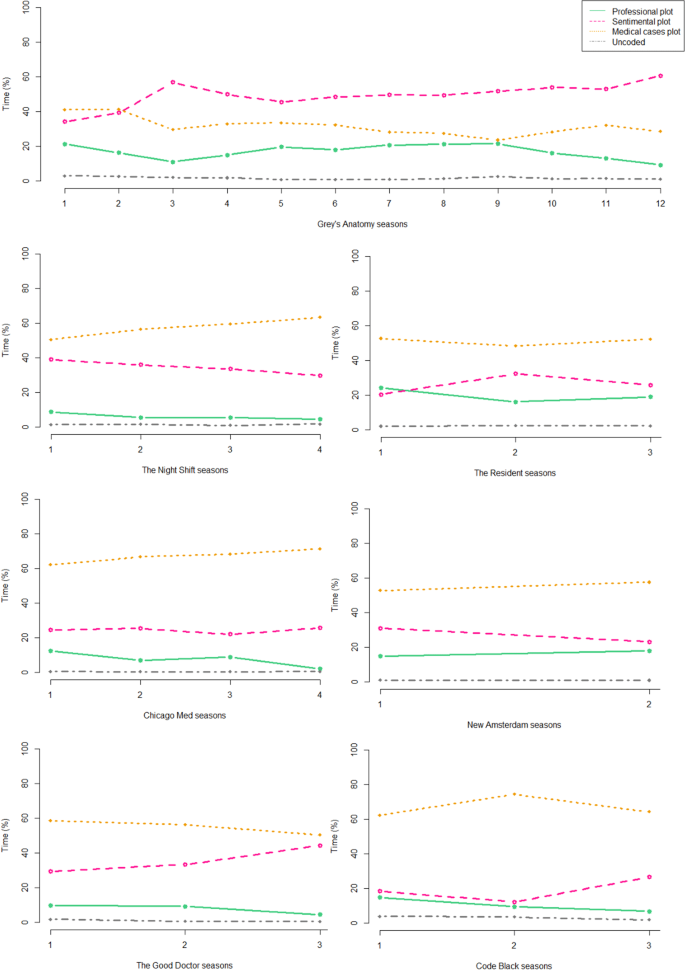
The figure shows the time series of seven series of the corpus (Miami Medical is not present because it has only one season). The legend at the top right applies to all series.
-
2.
The anthology formula: Miami Medical and Code Black. In addition to having a preponderance of medical case plots and the smaller presence of the sentimental plot, these series also present the largest number of uncoded segments (3% against an average of 1%). The two CBS series, though visually different (Code Black was designed to capture the spirit of Ryan McGarry’s documentary of the same title, Miami Medical was much glossier), both focus on early intervention following a medical emergency. Both series showcase the fight against time to save the lives of the medical cases that arise in each episode and tend to favour real-time action.
-
3.
The doctors and patients formula: Chicago Med, The Night Shift, The Good Doctor. These three series belong to quite different product categories. The NBC Chicago Med series is part of the One Chicago franchise, dedicated to public services in the US city. The Night Shift, also from NBC, is a summer series, with a smaller budget and fewer episodes. The ABC series The Good Doctor is based on a Korean product with the same title and has achieved high ratings, presenting some innovative elements, such as the main character, who is a young autistic surgeon. However, the three series adopt the same traditional narrative formula, with a balanced mix of patient and doctor stories, which are intertwined with references and similarities, while aspects related to the medical profession remain in the background. Moreover, The Good Doctor—if we look at the development of the series (Fig. 4)—presents a possible inversion between sentimental plot and medical cases plot starting from the third season; we do not know if it will be confirmed, and if it could be similar to that of Grey’s Anatomy.Footnote 25
-
4.
The social formula: New Amsterdam, The Resident. These two series show a substantial prominence of the professional plot (16% New Amsterdam and 19% The Resident) compared to the average of all other series (9%), which is justified by the focus on the ethical aspects of the medical profession (The Resident) and the social and public aspects of medicine (New Amsterdam). In the Fox series The Resident, one of the main themes is the hospital industry and the fight against bad health care, while in the NBC series New Amsterdam, the medical director of the public hospital New Amsterdam faces the distortions of the health care system. In both cases, these aspects are flanked by the stories of doctors and patients, as for profile 3, in fact, the two profiles belong to the same branch of the dendrogram in Fig. 3.

RQ3: How do the narrative plots of a medical drama change over time?
After identifying the different narrative profiles within the medical genre, we consider the last research question aimed at providing a dynamic view of our dataset. We prefer to present the graphs organized by season, as we did above, to make the overall trends of each series more visible.
Figure 4 confirms earlier observations: Grey’s Anatomy differs from other shows in that, during its evolution, the prevalent plot has become the sentimental one. In all the other cases, the prevailing plot is that related to medical cases followed by the sentimental plot, and finally by the professional one that always remains in the background in all the series analysed. Also visible are some shifts already mentioned above: the change of formula in Grey’s Anatomy in the third season and the trend of possible reversal between sentimental plot and professional plot in The Resident and New Amsterdam. The development of a soap trend in The Good Doctor is also significant, due to the time devoted to the sentimental vicissitudes of the protagonist, which tends to bring The Good Doctor closer to Grey’s Anatomy. It should also be noted that the particularity of the first season of The Resident confirms the importance of the themes related to the medical profession in the series. However, if we consider the dataset as a whole, it is evident that the formulaic aspects relating to the quantitative relationships between isotopies are very stable: we recorded only two cases of inversion between isotopies out of 32 seasons considered. This shows that—at least in the case of sufficiently codified serial products such as medical drama—self-regulating mechanisms are at work that tend to keep the product adherent to a defined narrative target. This is in some ways surprising if we consider that a serial product, to maintain the attention of its audience, needs a “narrative engine” that constantly produces new characters and new plots. The continuous alternation of new narrative elements occurs without much change in the narrative formula and without explicit control of these parameters in creative decisions. The mechanisms of self-regulation thus seem to be linked to a systemic response that legitimizes the ecosystemic approach within which this work moves.Footnote 26
Conclusions
In this article, we proposed an exploratory data-driven study useful for triggering a process of transforming data into useful information. We applied this knowledge process in the context of media studies with a focus on the US medical serial audiovisual products. This research line can have implications both for consumers and producers. While producers may have a better understanding of the type of product and its evolution, consumers may have more efficient recommendation systems at their disposal. Indeed, if the outputs of this work were generalized over a larger corpus of series in the future they could be used in the development of content-based recommendation systems.
In particular, we validated the interpretative hypotheses related to the isotopies characterizing medical drama in contemporary seriality: the sentimental plot, the professional plot, and the medical cases plot. Using this schematization, it was possible to grasp the basic components of the social interactions showing the strength of the medical genre and its ability to rebuild, in its microcosm, the essential traits of the human macrocosm where random everyday life elements (seen in the medical cases plot) mix and overlap with working and social relationships (professional plot) and personal relationships (sentimental plot). The identification and quantification of these aspects in the corpus of investigation allowed us to reconstruct four possible narrative profiles: the soap formula, the anthology formula, the doctor and patients formula, and the social formula.
In this work, we started from the idea of the medical genre and we deconstructed the concept, showing how the analysis of serial discourse, more than the genre, could be crucial in identifying the balance between codified aspects, called isotopies or plots, which constitute the formula of the product.Footnote 27 Since these isotopies refer to fundamental aspects in the construction of a fictional world (Boni, 2017; Jenkins, 2006), one can hypothesize using them for the analysis of other serial genres that involve the construction of communities or microcosms organized according to individual and social relationships. Therefore, it is possible to generalize the three isotopies into a form that eliminates references to medical drama. In the first investigations we are carrying out on legal drama, teen drama, and superhero series, we have called soap plot the isotopy related to sentimental aspects and individual relationships, genre plot that one related to aspects characterizing the genre and/or the context and anthology plot is related to self-contained narrative arcs. By comparing different genres, we believe we can show that, beyond surface differences, the series share strongly codified formulaic elements that allow us to connect distant products with similar narrative profiles. Therefore, we suggest that the process of clustering and the construction of related profiles can be extended across multiple genres and products outside the medical drama.
The dynamic analysis of our dataset showed us that the evolution of the narrative variables over time—at least for the series considered—presents a character of strong stability. This demonstrates a significant confirmation of how, in serial products with characteristics of the narrative ecosystem, contrary to what is often taken for granted in many interpretative studies, creative decisions certainly do have great importance at the local level (for one or a few episodes), but rarely significantly change the general narrative aspects of the wider series. This is because the narrative variables considered are strongly self-regulated: they tend to self-correct, realigning themselves to values that change little and slowly. In the ecosystem context, to say that a variable is self-regulated is equivalent to saying that external factors act on that variable to limit its variation. For example, it is evident that the high stability of the duration of each episode of the series examined (about 43 min), limits the maximum value that the variables can assume. Similarly, it is possible to hypothesize that other economic, production, distribution, and audience factors affect narrative variables. For this reason, several scenarios emerge from the perspective of future developments in the research. Although the dynamic analysis confirms the stability of the narrative variables, more detailed analysis could be done to comparatively examine the narrative trajectories in detail such as sequence analysis (Abbott, 1995; Abbott and Tsay, 2000). Furthermore, if on the one hand it is appropriate to expand the dataset and the cases considered, trying to generalize the analytical model proposed to genres other than medical drama, on the other hand, it is essential to make explicit the external factors that act on the narrative variables and integrate them into the dataset, building a model that reconnects in a systemic vision the narrative features with those of production and consumption, as well as with regulatory and contextual aspects.
Data availability
The dataset generated and analysed during the current study are available on Open Science Framework https://doi.org/10.17605/OSF.IO/24TUS.
Notes
The ecosystem approach aims to adopt both traditional and innovative research tools, in particular through methodologies that seek to construct dynamic models that systematize narrative, economic and production components of serial products. Through this kind of approach, it will be possible to identify emergent trends and patterns, both within the single instances that are analysed and in the broader context of the contemporary media industry.
The seasons analysed for each series are shown in Table 1.
Greimas and Courtés (1979 (1982), pp. 163–165) define the term isotopy as the continuous presence of different words with semantical traits in common within the syntagmatic units (sentences and/or texts). Eco (1979, p. 93) underlines how the term isotopy is “an umbrella term that covers various semiotic phenomena that could generally be defined as the coherence of a reading path to the various textual levels” (our translation). In this paper, we refer to the term isotopy as defined by Eco, which is more inclusive and implies the definition of plot. The term plot emphasizes the narrative aspect and is often used in the scientific literature about seriality. Here, we use the terms isotopy and plot interchangeably: with the term plot, we do not refer to a coherent and concise story, but to a recurrence of narrative elements.
By considering these isotopies we follow the methodological framework expressed in Rocchi and Pescatore (2019) and a schematic approach that captures the essential components of the serial object even if they do not exhaust its complexity.
See below for further discussion.
Schatz (1981) has underlined the relevance of formulaic aspects for film genres, and recently Jovanović (2021) investigate formulaic aspects and aesthetic pleasure in generic television series. Within the medical genre, Albuquerque and Meimaridis (2016) have dissected narrative formula considering the imbalance between a common world and an extraordinary world. In this paper we address as formulaic aspects those related to the narrative domain and consider the narrative formula as the relationship between different isotopies.
We intended to measure the amount of narrative biomass independently of the hypothesizable relationship between time and narrative prominence, which is beyond the scope of this study (i.e., the amount of time devoted by a narrative to a thematic-narrative element does not necessarily correspond to the prominence of that same element in the narrative structure). We assume that in vast narratives the time devoted to a given thematic-narrative element is a reliable proxy for the narrative prominence of that element.
The coding process can also be emergent if we do not consider a set of pre-set codes and thus allow them to emerge directly from the data (inductive coding).
The majority of the medical cases appear only in the show for a short time (a single episode); however, some cases occupy more than one episode and sometimes the characters become recurring within the narration, playing a role within the sentimental and/or professional plot.
We used ELAN, an annotation tool that allowed us to create, edit, visualize and search annotations for video and audio data (Estrada et al., 2017).
These relationships in many cases involve the same characters who may play different social roles.
Intra-coder reliability is less common than inter-coder reliability (O’Connor and Joffe, 2020), but often inter-coder reliability is used on large projects with multiple coders and considering our research group we adopt the intra-coder reliability, one of the two possibilities offered by the literature. In addition, different studies compare the two types of reliability without any conclusive result in favour of one way or the other (Hu et al., 2011; Painczyk et al., 2018).
The percentage of episodes was decided on the basis of the literature (Himes and Thompson, 2007; Manganello et al., 2008; Fernández-Villanueva et al., 2009; Greenberg et al., 2009; Russell and Russell, 2009; Dillman Carpentier et al., 2017; Sink and Mastro, 2017; Timmermans and Van den Bulck, 2018; Blanco-Herrero and Rodríguez-Contreras, 2019; Nitsch et al., 2019; Ramos et al., 2019; Barker et al., 2020; Chapoton et al., 2020; Krongard and Tsay-Vogel, 2020; González-de-Garay et al., 2020; Lo and Huang, 2021). We selected the episodes through stratified random sampling (Sharma, 2017, p. 750). In particular, we randomly choose 15% of episodes from each of the eight TV series (Table 1).
We decided to look at individual seasons and not individual episodes because there is high variability between individual episodes of all series, and this leads to distorted and meaningless effects in the aggregation of clusters (e.g., the outlier episodes of the various series aggregate together).
The median value of each isotopy per season was calculated by considering the isotopy values of the episodes belonging to that season.
The principal clustering methods are partitioning methods (k-means, PAM, CLARA) that subdivide the datasets into a set of k groups, where k is the number of groups pre-specified by the analyst; hierarchical clustering, that identifies groups in the data without subdividing it; fuzzy clustering; density-based clustering; and model-based clustering (for more details see Jain et al., 1999; Rokach and Maimon, 2005; Berkhin, 2006).
The optimal number of clusters is a central issue in partitioning clustering such as k-means clustering. Indeed, it necessitates the user to specify the number of clusters k to be produced. There are different methods for determining the optimal number of clusters; we considered direct methods (elbow and silhouette methods) and statistical testing methods (gap statistics). In order to decide the best number of clusters the literature suggests following the “majority rule” (Charrad et al., 2014, p. 29).
The clValid package in R compares clustering algorithms using two cluster validation measures: (I) Internal measures, which uses intrinsic information in the data to assess the quality of the clustering. Internal measures include the connectivity, the silhouette coefficient and the Dunn index; and (II) Stability measures which evaluate the consistency of a clustering result by comparing it with the clusters obtained after each column is removed, one at a time (Brock et al., 2008).
In our case hierarchical clustering performs best in two cases (for Dunn and Silhouette measures), and regardless of the clustering algorithm adopted, the optimal number of clusters is four.
In our case for the AD and FOM measures, hierarchical clustering with five clusters gives the best score; considering other measures, k-means with four clusters have the best score.
We implement two types of hierarchical clustering: (I) agglomerative clustering (AGNES) which works in a “bottom-up” perspective in which each observation is initially considered as a cluster of its own. Then, the most similar clusters are successively merged until there is just one single big cluster; (II) divisive clustering (DIANA) that works in a “top-down” perspective, beginning with the root, in which all objects are included in one cluster. Then the most heterogeneous clusters are successively divided until all observations are in their own cluster. Since there are no major differences between the two methods, we decided to use hierarchical divisive clustering (DIANA) for the scope of this paper.
We used a Kruskal–Wallis test, a non-parametric alternative to the one-way ANOVA test. It extends the two-sample Wilcoxon test in the situation where there are more than two groups to compare. It is recommended when the assumptions of one-way ANOVA test are not met, as in our case. Our dataset showed that there is a statistically significant difference in the professional plot (χ2(7) = 132.95, p < 0.0001, n = 608), sentimental plot (χ2(7) = 272.56, p < 0.0001, n = 608) and medical cases plot (χ2(7) = 348.87, p < 0.0001, n = 608) scores between different series. From these outputs, we know that there is a significant difference between groups, but we do not know which pairs of groups are different. This in-depth examination is beyond the scope of this article, but we believe it to be an interesting aspect of future study.
For the display requirements of the 3D scatter plot, we did not consider the values of uncoded segments.
We conducted the Hopkins statistic test and rejected the null hypothesis (H = 0.535), and as noted previously from our investigation, it was not possible to define an optimal number of clusters in the dataset.
It’s unclear at this early stage whether The Good Doctor will develop in the same way as Grey’s Anatomy because it is a ‘younger’ show.
In the writing process, producers and scriptwriters often follow conventions formulated in different manuals (e.g., Campbell, 1949; Snyder, 2005; Vogler, 2007). However, we can consider these rules as part of the self-regulatory systems since the ecosystem approach aims to consider all mechanisms within the narrative ecosystem.
There is a wide-ranging debate regarding the television genre (for details see Mittel, 2001; Creeber, 2015).
References
Abbott A (1995) Sequence analysis: new methods for old ideas. Annu Rev Sociol 21(1):93–113. https://doi.org/10.1146/annurev.so.21.080195.000521
Abbott A, Tsay A (2000) Sequence analysis and optimal matching methods in sociology: review and prospect. Sociol Methods Res 29(1):3–33. https://doi.org/10.1177/0049124100029001001
Albuquerque A, Meimaridis M (2016) Dissecando fórmulas narrativas: drama profissional e melodrama nas séries médicas. Front-estud midiáticos 18(2):158–169
Alloghani M, Al-Jumeily D, Mustafina J, Hussain A, Aljaaf AJ (2020) A systematic review on supervised and unsupervised machine learning algorithms for data science. In: Berry MW, Mohamed A, Yap BW (eds.) Supervised and unsupervised learning for data science. Springer Nature, Cham, pp. 3–21
Barker AB, Britton J, Thomson E, Hunter A, Opazo Breton M, Murray RL (2020) A content analysis of tobacco and alcohol audio-visual content in a sample of UK reality TV programmes. J Public Health 42(3):561–569. https://doi.org/10.1093/pubmed/fdz043
Berkhin P (2006) A survey of clustering data mining techniques. In: Kogan J, Nicholas C, Teboulle M (eds.) Grouping multidimensional data. Springer, Berlin, pp. 25–71
Blanco-Herrero D, Rodríguez-Contreras L (2019) The risks of new technologies in black mirror: a content analysis of the depiction of our current socio-technological reality in a TV series. Paper presented at the seventh international conference on technological ecosystems for enhancing multiculturality, León, Spain, October
Boni M (ed.) (2017) World building: transmedia, fans, industries. Amsterdam University Press, Amsterdam
Brock G, Pihur V, Datta S, Datta S (2008) ClValid: an R package for cluster validation. J Stat Softw 25(4):1–22. https://doi.org/10.18637/jss.v025.i04
Chapoton B, Werlen AL, Denois V (2020) Alcohol in TV series popular with teens: a content analysis of TV series in France 22 years after a Restrictive Law. Eur J Public Health 30(2):363–368. https://doi.org/10.1093/eurpub/ckz163
Charrad M, Ghazzali N, Boiteau V, Niknafs A (2014) NbClust: an R package for determining the relevant number of clusters in a data set. J Stat Softw 61:1–36
Chung JE (2014) Medical dramas and viewer perception of health: testing cultivation effects. Hum Commun Res 40(3):333–349. https://doi.org/10.1111/hcre.12026
Campbell J (1949) The hero with a thousand faces. Princeton University Press, Princeton
Cope M (2010) Interpreting and communicating qualitative research: coding qualitative data. In: Hay I (ed.) Qualitative research methods in human geography, Oxford University Press, New York, pp. 281–294
Creeber G (2015) The television genre book. Bloomsbury Publishing, London
Dillman Carpentier FR, Stevens EM, Wu L, Seely N (2017) Sex, love, and risk-n-responsibility: a content analysis of entertainment television. Mass Commun Soc 20(5):686–709. https://doi.org/10.1080/15205436.2017.1298807
Eco U (1979) Lector in fabula: la cooperazione interpretativa nei testi narrativi. Bompiani, Milano
Elliott V (2018) Thinking about the coding process in qualitative data analysis. Qual Rep 23(11):2850–2861
Estrada LM, Hielscher E, Koolen M, Olesen CG, Noordegraaf J, Blom J (2017) Film analysis as annotation: Exploring current tools. Mov Image 17(2):40–70. https://doi.org/10.5749/movingimage.17.2.0040
Fernandez‐Collado CF, Greenberg BS, Korzenny F, Atkin CK (1978) Sexual intimacy and drug use in TV series. J Commun 28(3):30–37
Fernández-Villanueva C, Revilla-Castro JC, Domínguez-Bilbao R, Gimeno-Jiménez L, Almagro A (2009) Gender differences in the representation of violence on Spanish television: should women be more violent. Sex Roles 61(1-2):85–100. https://doi.org/10.1007/s11199-009-9613-9
González-de-Garay B, Marcos-Ramos M, Portillo-Delgado C (2020) Gender representation in Spanish Prime-Time TV series. Fem Media Stud 20(3):414–433. https://doi.org/10.1080/14680777.2019.1593875
Greenberg BS, Rosaen SF, Worrell TR, Salmon CT, Volkman JE (2009) A portrait of food and drink in commercial TV series. Health Commun 24(4):295–303. https://doi.org/10.1080/10410230902889233
Greimas AJ, Courtés J (1979) Dictionnaire raisonné de la théorie du langage. Hachette, Paris. English edition: Greimas AJ, Courtés J (1982) Semiotics and language: an analytical dictionary (trans: Crist L, Patte D, et al.). Indiana University Press, Bloomington
Harris D, Willoughby H (2009) Resuscitation on television: realistic or ridiculous? A quantitative observational analysis of the portrayal of cardiopulmonary resuscitation in television medical drama. Resuscitation 80(11):1275–1279. https://doi.org/10.1016/j.resuscitation.2009.07.008
Hennig C (2007) Cluster-wise assessment of cluster stability. Comput Stat Data Anal 52(1):258–271. https://doi.org/10.1016/j.csda.2006.11.025
Hennig C (2008) Dissolution point and isolation robustness: robustness criteria for general cluster analysis methods. J Multivar Anal 99(6):1154–1176. https://doi.org/10.1016/j.jmva.2007.07.002
Himes SM, Thompson JK (2007) Fat stigmatization in television shows and movies: a content analysis. Obesity 15(3):712–718. https://doi.org/10.1038/oby.2007.635
Hoffman BL, Rosenthal EL, Colditz JB, Mcgarry R, Primack BA (2018) Use of Twitter to assess viewer reactions to the medical drama, code black. J Health Commun 23(3):244–253. https://doi.org/10.1080/10810730.2018.1426660
Hu ZJ, He J, Zhao FD, Fang XQ, Zhou LN, Fan SW (2011) An assessment of the intra-and inter-reliability of the lumbar paraspinal muscle parameters using CT scan and magnetic resonance imaging. Spine 36(13):E868–E874. https://doi.org/10.1097/BRS.0b013e3181ef6b51
Innocenti V, Pescatore G (2012) Information architecture in contemporary television series. J Archit 4(1-2):57–72
Innocenti V, Pescatore G (2018) The evolution of characters in TV series: morphology, selection, and remarkable cases in narrative ecosystems. In: Brembilla P, De Pascalis IA (eds.) Reading contemporary serial television universes. Routledge, New York, pp. 93–110
Jain AK, Murty MN, Flynn PJ (1999) Data clustering: a review. ACM Comput Surv 31(3):264–323. https://doi.org/10.1145/331499.331504
Jenkins H (2006) Convergence culture: where old and new media collide. New York University Press, New York
Jovanović IV (2021) Repetition, familiarity, and aesthetic pleasure: formulaic generic television series. In: Nannicelli T, Pérez HJ (eds.) Cognition, emotion, and aesthetics in contemporary serial television. Routledge, New York, pp. 256–272
Kassambara A (2017) Practical guide to cluster analysis in R: unsupervised machine learning, vol 1. Sthda
Kassarjian HH (1977) Content analysis in consumer research. J Consum Res 4:8–18
Krippendorf K (1980) Content analysis: an introduction to its methodology. Beverly Hills, Sage
Krongard S, Tsay-Vogel M (2020) Online original TV series: examining portrayals of violence in popular binge-watched programs and social reality perceptions. Psychol Popul Media 9(2):155. https://doi.org/10.1037/ppm0000224
Lawson RG, Jurs PC (1990) New Index for clustering tendency and its application to chemical problems. J Chem Inform Comput Sci 30(1):36–41
Lo YY, Huang CJ (2021) Differences in knowledge, uncertainty, and social context in four medical TV series from Taiwan, Japan, South Korea and the United States. J Sci Commun 20(1). https://doi.org/10.22323/2.20010201
Manganello J, Franzini A, Jordan A (2008) Sampling television programs for content analysis of sex on TV: how many episodes are enough. J Sex Res45(1):9–16. https://doi.org/10.1080/00224490701629514
Nitsch C, Jandura O, Bienhaus P (2019) The democratic quality of political depictions in fictional TV entertainment. A comparative content analysis of the political drama Borgen and the journalistic magazine Berlin Direkt. Communications. https://doi.org/10.1515/commun-2019-2076
O’Connor C, Joffe H (2020) Intercoder reliability in qualitative research: debates and practical guidelines. Int J Qual Methods 19. https://doi.org/10.1177/1609406919899220
Painczyk H, Hendricks S, Kraak W (2018) Intra and inter-reliability testing of a south african developed computerised notational system among western province club rugby coaches. Int J Sports Sci Coach 13(6):1163–1170. https://doi.org/10.1177/1747954118796368
Pescatore G, Innocenti V, Brembilla P (2014) Selection and evolution in narrative ecosystems: a theoretical framework for narrative prediction. Paper presented at the IEEE International Conference on Multimedia and Expo Workshops (ICMEW), Chengdu, China, July 14–18, 2014
Ramos MM, González de Garay B, Portillo Delgado C (2019) The representation of immigration in contemporary Spanish prime time TV series. Rev Latina Comun Soc 74:285–307. https://doi.org/10.4185/RLCS-2019-1331en
Rocchi M, Pescatore G (2019) Narration in medical dramas I. Interpretative hypotheses and research perspectives. La Valle dell’Eden 1:107–1115
Rocchi M (2019) History, analysis and anthropology of medical dramas: a literature review. Cinergie 15:69–184. https://doi.org/10.6092/issn.2280-9481/8982
Rokach L, Maimon O (2005) Clustering methods. In: Rokach L, Maimon O (eds) Data mining and knowledge discovery handbook. Springer, Boston, pp. 321–352
Russell CA, Russell DW (2009) Alcohol messages in prime‐time television series. J Consum Aff 43(1):108–128. https://doi.org/10.1111/j.1745-6606.2008.01129.x
Saldaña J (2016) The coding manual for qualitative researchers. SAGE, London
Schatz T (1981) Hollywood genres: formulas, filmmaking, and the studio system. Random House, New York
Sharma G (2017) Pros and cons of different sampling techniques. Int J Appl Res 3(7):749–752
Signorielli N, Bacue A (1999) Recognition and respect: a content analysis of prime-time television characters across three decades. Sex Roles 40(7):527–544
Sink A, Mastro D (2017) Depictions of gender on primetime television: a quantitative content analysis. Mass Commun Soc 20(1):3–22. https://doi.org/10.1080/15205436.2016.1212243
Snyder B (2005) Save the cat. Michael Wiese Productions, Chelsea
Timmermans E, Van den Bulck J (2018) Casual sexual scripts on the screen: a quantitative content analysis. Arch Sex Behav 47(5):1481–1496. https://doi.org/10.1007/s10508-018-1147-1
Vogler C (2007) The writer’s journey. Michael Wiese Productions, Studio City
Warner KJ (2015) The racial logic of Grey’s Anatomy: Shonda Rhimes and her ‘post-civil rights, post-feminist’ series. Telev New Media 16(7):631–647. https://doi.org/10.1177/1527476414550529
Author information
Authors and Affiliations
Corresponding author
Ethics declarations
Competing interests
The authors declare no competing interests.
Ethical approval
This article does not contain any studies with human participants performed by any of the authors.
Informed consent
This article does not contain any studies with human participants performed by any of the authors.
Additional information
Publisher’s note Springer Nature remains neutral with regard to jurisdictional claims in published maps and institutional affiliations.
Rights and permissions
Open Access This article is licensed under a Creative Commons Attribution 4.0 International License, which permits use, sharing, adaptation, distribution and reproduction in any medium or format, as long as you give appropriate credit to the original author(s) and the source, provide a link to the Creative Commons license, and indicate if changes were made. The images or other third party material in this article are included in the article’s Creative Commons license, unless indicated otherwise in a credit line to the material. If material is not included in the article’s Creative Commons license and your intended use is not permitted by statutory regulation or exceeds the permitted use, you will need to obtain permission directly from the copyright holder. To view a copy of this license, visit http://creativecommons.org/licenses/by/4.0/.
About this article

Cite this article
Rocchi, M., Pescatore, G. Modeling narrative features in TV series: coding and clustering analysis. Humanit Soc Sci Commun 9, 333 (2022). https://doi.org/10.1057/s41599-022-01352-9
Received:
Accepted:
Published:
DOI: https://doi.org/10.1057/s41599-022-01352-9
- Springer Nature Limited