
Abstract
Population structure can facilitate evolution of cooperation. In a structured population, cooperators can form clusters which resist exploitation by defectors. Recently, it was observed that a shift update rule is an extremely strong amplifier of cooperation in a one dimensional spatial model. For the shift update rule, an individual is chosen for reproduction proportional to fecundity; the offspring is placed next to the parent; a random individual dies. Subsequently, the population is rearranged (shifted) until all individual cells are again evenly spaced out. For large population size and a one dimensional population structure, the shift update rule favors cooperation for any benefit-to-cost ratio greater than one. But every attempt to generalize shift updating to higher dimensions while maintaining its strong effect has failed. The reason is that in two dimensions the clusters are fragmented by the movements caused by rearranging the cells. Here we introduce the natural phenomenon of a repulsive force between cells of different types. After a birth and death event, the cells are being rearranged minimizing the overall energy expenditure. If the repulsive force is sufficiently high, shift becomes a strong promoter of cooperation in two dimensions.
Introduction
Cooperation is a hallmark of living systems. Although the primary principle of biological evolution is natural selection, cooperation is ubiquitous in nature and is instrumental in generating higher levels of biological organization1,2. Cooperation can occur between replicating molecules, viruses, cells, multicellular organisms and people. Cooperation is usually opposed by natural selection unless a mechanism for evolution of cooperation is at work3. One such mechanism is spatial selection operating in structured populations4,5,6,7. Certain population structures enable cooperators to form clusters which can prevail in competition with defectors8,9,10. Here we study a mechanism facilitating cooperation among cells in a two-dimensional spatial model.
It is well known that population structure can change the outcome of evolutionary and ecological processes8,11,12,13,14,15,16,17,18,19,20. For example, deterministic evolutionary dynamics can lead to spatial chaos and emergence of cooperation on regular grids8. Evolutionary graph theory is a generalization of this approach to stochastic dynamics and any population structure21,22,23,24. The individuals of a population occupy the vertices of a graph. The links determine interaction and competition. There can either be two different graphs for interaction and competition25 or a single graph for both processes. The graph can be constant or changing under evolutionary updating26,27,28,29. Certain graphs enhance30 or suppress31 natural selection. Even the molecular clock of neutral evolution can depend on the graph structure32. Space can be defined via physical distance, social distance or phenotypic distance20,22,31,33,34,35,36,37,38,39.
Although population structure can affect the outcome of any evolutionary game18,20,40,41,42,43,44,45,46,47, many studies focus on evolution of cooperation18,19,37,48,49,50,51,52,53,54,55,56. A typical, crucial question is: what is the minimum benefit-to-cost ratio needed for spatial selection to favor cooperation over defection10,39,55,57,58,59,60,61?
Recently, it was reported that “shift” updating is a strong promoter of cooperation in a one dimensional setting61. An individual is chosen for reproduction at random but proportional to payoff. The offspring is placed next to it. A random individual dies. The individuals rearrange (shift) on the cycle until each position is again occupied by a single individual. For large population size, cooperation is favored over defection if the benefit-to-cost ratio exceeds one. This is the minimum possible critical benefit-to-cost ratio. This condition always holds if cooperation is beneficial.
Attempts to generalize the “shift” updating rule to higher dimensions, while maintaining its strong effect, have failed, because the rearrangement of individuals in higher dimensions destroys the clusters of cooperators61. Here we introduce a repulsive force between cells of different types. Then the actual path of rearrangement in two dimensions is calculated taking into account the repulsive force and minimizing energy. This very natural, physical process leads to a strong effect of promoting evolution of cooperation.
Evolutionary process: The Generic Shift Rule Model
We consider a heterogeneous population of cells that is structured in a two-dimensional grid as the most well-studied case of regular graphs in two dimensions7,8,9,22,49,50,51,55. Individual cells reproduce and die: a cell death leaves a vacant position of low pressure in the grid, whereas a cell reproduction generates a duplicate cell in that position and induces higher pressure. This pressure difference in the grid is resolved by shifting the cells from the high to the low pressure position, along some path. The path to be chosen is determined by forces acting between the cells. Afterwards, the population is again spread out evenly on the grid, with one cell in each position.
Evolutionary process on a grid
We consider a discrete-time evolutionary process on a population of N = n2 individuals, each occupying one position in a n × n grid. Each individual at position (i, j), for 0 ≤ i, j ≤ n − 1, is of one type, either A or B and has four neighbors at positions (i′, j′) such that |i − i′| (mod n − 2) + |j − j′| (mod n − 2) = 1. (i.e., the grid wraps around and forms a torus).
The types of an individual and its neighbors determine its fecundity (reproductive rate). At every time point, one individual is chosen uniformly at random to die and one individual is chosen to reproduce randomly and proportionally to its fecundity. These two events are independent and might result in the same individual. Let (i1, j1) and (i2, j2) be the positions on the grid of the death and the reproduction events, respectively. The population is updated by the following generic shift rule:
-
1
Choose a path
 .
. -
2
Shift the individuals that appear in the intermediate positions of P one step forward in the direction of P. Now the position (i1, j1) is occupied by a neighbor of the dead individual and no individual occupies the neighboring position of (i2, j2) in P. Finally, place a copy of the reproducing individual in the vacant position (i.e., the neighbor of (i2, j2) in P).
 .
.Figure 1 illustrates one step of this process. We will later discuss two different ways of choosing the path P, i.e., give two instances of the generic shift rule. We now consider the notion of games to assign fecundities to individuals.

Illustration of the generic shift rule on a two-dimensional grid.
A death event at position (4, 3) (counting from zero, with (0, 0) being the lower left corner) creates a vacancy in the population structure. A birth event at position (0, 3) creates a new cell. Finally, all cells are shifted along a path  , so that afterwards, the population size remains unchanged and all cells are evenly spaced out.
Discrete games
At each step of the evolutionary process, each individual is chosen for reproduction with probability that is proportional to its fecundity. This fecundity is not static, but determined by the individual’s interactions with each of its neighbors, via a matrix game4,8. In particular, each such interaction contributes the payoff at a position according to the matrix (1), where the row is the type of the individual and the column is the type of the neighbor.

Our work focuses on the additive Prisoner’s Dilemma, where the payoffs are given by matrix (2). Here we consider a fixed cost c = 1 for offering cooperation and a varying benefit b for receiving cooperation.

The average payoff π received by the individual from interactions with neighbors is mapped to fecundity as  where δ > 0 is a real number that quantifies the intensity of selection and F is a positive, differentiable, increasing function. There exist various choices for the function F in the literature61,62. In this work, we focus on the frequently used linear map, with
  39,60,63. We will consider both strong selection where δ = 1 and the limit of weak selection where δ ≪ 1 (or δ → 0). In the strong selection regime, this is equivalent to the more commonly used map
  , in which the average utility π′ comes from the modified Prisoner’s Dilemma of matrix (3), where every entry has been increased by c = 1 to ensure that all individuals always have non-zero fecundity.

Fixation probability
We quantify the evolutionary success of each type of individuals by means of their ability to invade populations of the opposite type. In particular, we are interested in the probability ρC that a single cooperator mutant arising in a population of defectors will eventually take over the population. Similarly, the fixation probability of a single defector mutant in a population of cooperators is denoted by ρD. As both fixation probabilities decrease with the population size N, we are interested in the relative fixation probability  and particularly in cases where cooperation is favored, i.e., ρ ≥ 0.539,56,61.
Fixation probability in other models
The current work lies in the line of research for natural evolutionary processes that lead to rise of cooperation when the benefit of receiving cooperation is not too large as compared to the cost of offering it (i.e., b/c is small)10,39,55,57,58,59,60,61. For the special case where individual payoffs are derived from the Prisoner’s Dilemma game3, has used the term critical benefit-to-cost ratio (b/c)* to refer to the least value of the b/c ratio which favors cooperation. Some of the most well-studied processes (or, so called, “update rules”) on graphs are the death-birth rule and the birth-death rule of39 and the shift rule on a cycle of61. For an illustration, see Fig. 2.

Three well-studied update rules on graphs.
Left: In the death-birth rule, one individual is chosen uniformly at random to die and leaves a vacant position. Then, a neighbor is chosen to reproduce with probability proportional to its fecundity. The reproducing individual places a copy of itself in the vacant position. Center: In the birth-death rule, one individual is chosen to reproduce with probability proportional to its fecundity. Then, a neighbor is chosen uniformly at random to die and leaves a vacant position, which is filled with a copy of the reproducing individual. Right: In the shift rule on a cycle, the population is arranged on a cycle, such that each individual has two neighbors. This forms a 1-dimensional grid. One individual is chosen uniformly at random to die and one to reproduce with probability proportional to its fecundity. The reproducing individual places a copy of itself in a neighboring position and the rest of the population shifts in one direction to fill the vacant position.
As shown by39, the birth-death rule does not promote cooperation (i.e., ρ < 0.5) regardless of the benefit-to-cost ratio. To explain this intuitively, we first observe that the only relevant birth-death events occur along an edge connecting individuals of different types. As stated by39, on average, the number of cooperator neighbors is the same for the two individuals. Thus the benefit received from the neighbors is, on average, the same for each individual. However, as long as c > 0, the cooperating individual suffers a cost for offering cooperation and thus has less fecundity than the defector. Therefore, when the birth-death event occurs in the edge, the defector has higher chance of reproducing than the cooperator.
In contrast, in the death-birth rule cooperation is favored in the limit of weak selection (δ ≪ 1), as long as (b/c) > κ, where κ is the average number of neighbors of each individual. Hence here the critical ratio is (b/c)* = κ and κ = 4 for two-dimensional grids. The intuitive description behind this threshold is as follows. Consider a vacant position created by a death event and a pair of individuals of different types that compete for placing a copy. The pair approximation of39 shows that for the death-birth rule, the cooperating individual has on average one more cooperating neighbor, among its κ − 1 neighbors, than the defector. Hence, the fecundity of the cooperator is larger than that of the defector as long as the additional benefit from the extra cooperation balances the total cost from offering cooperation to κ neighbors, i.e., b > κc.
Given the result for the death-birth rule, an important question is whether there exist other update rules which favor cooperation for b/c < κ. A positive answer was provided for one-dimensional population structure in61. A cycle is a special case of the torus (i.e., it is one-dimensional torus) and the shift rule on a cycle is an instance of choosing the path P in the generic shift rule. The shift rule on a cycle of61 favors cooperation as long as b > c. Note that in a cycle κ = 2 and thus the result of61 is a witness of an update rule with critical ratio (b/c)* = 1 < κ. In contrast to the local64 birth-death and death-birth rules, the shift rule on a cycle is a global update rule, which means that all the death and reproduce events depend on the relative fecundity of each individual. When an individual dies, the whole population of cooperators competes with the population of defectors for filling the vacancy. On a cycle, we always have one cluster of each type and except for the two cooperators and defectors at the boundary we have the following: the payoff of the defectors is 0, whereas as long as b > c, the cooperators have positive payoff. The defectors at the boundary have payoff b each and hence the total payoff of all defectors is 2b (i.e., constant and irrespective of the population size), whereas each cooperator other than the two at boundary has positive payoff. Thus for sufficiently large populations, the total fecundity of the cooperators is larger than that of the defectors and reproduction is biased towards cooperators.
Results
The fundamental question for the two-dimensional population structure is again whether there can be instances of the generic shift rule where the critical ratio is less than κ, as compared to the death-birth process. For two-dimensional population structure such as a grid we have κ = 4. Given the fundamental question and its affirmative answer in the one-dimensional grid, a natural question is whether the shift rule on a cycle can be extended to two dimensions. This question has been explored, but without success in61. In particular, the shift rule on a cycle was lifted to the two-dimensional case, by choosing the path P from the reproduction to the death position randomly among the shortest paths wrt the number of hops (i.e., the number of steps). However, this rule does not favor cooperation even with b/c = 4. The authors in61 identified that the key difference between one and two dimensions is that in the former case, the two types of individuals always form one cluster each, whereas in the latter case, shifting paths between distant events would regularly disrupt clusters. This lead to longer boundaries between cooperators and defectors, which defectors would exploit to increase their payoff and thus fecundity.
The failure of the natural generalization of the shift rule on a cycle brings us to the following questions: does there exist any natural instance of the generic-shift rule in the torus that (i) has critical ratio (b/c)* < 4 under weak selection (thus favoring cooperation more strongly than the death-birth rule) and (ii) has critical ratio (b/c)* smaller than the generalization of the shift rule on a cycle in two dimensions. We will present affirmative answers to these questions. First, we introduce two instances of the generic shift rule for choosing the path P.
Two instances of the generic shift rule
We consider that between every individual and neighbor there exists a repulsion force measured as a real value. This force is a measure of the resistance when a copy of the individual tries to occupy the position of the neighbor. Note that this repulsion force is specific to the pair under consideration and can generally differ among different pairs.
In this work we consider two natural ways for obtaining the paths  , which lead to two instantiations of the generic shift rule. First, we fix a symmetric repulsion force between neighbors that has value (i) α ≥ 1 between different-type individuals and (ii) fixed to 1 between same-type individuals (Fig. 3). This captures affinity between neighbors. Neighbors of the same type are linked with a large affinity and the repulsion force along their edge is small, i.e., 1. In contrast, neighbors of different types share a smaller affinity and the repulsion force is generally larger, i.e., α ≥ 1.

The repulsion force between neighbors has value normalized to 1 for a pair of same-type individuals and some real value α ≥ 1 for a pair of different-type individuals.
Given a path P, we denote by α(P) the sum of repulsion forces along the edges of P. Once the death event has taken place, a vacancy is left in (i1, j1). Every individual in position (i, j) is associated with a resistance value  which is the smallest sum of the resistance forces that the individual in position (i, j) feels along a path to the vacancy in (i1, j1). We consider the following two rules for choosing the path
  from reproduction to death.
-
1
Least-resistance rule (LR). In the LR rule, informally, the path P is chosen uniformly at random among the least-resistance paths. Formally, let d = d(i2, j2) denote the resistance value of (i2, j2). Let
 be the set of paths P′ from (i2, j2) to (i1, j1) that achieve the resistance value. In other words LRP represents the set of all least-resistance paths from (i2, j2) to (i1, j1). The path P is then chosen uniformly at random from the set LRP. Intuitively, this captures a least-effort principle, where the reproducing individual will fill the hole while spending as little energy as possible. Figure 4 provides an illustration of how the shift dynamics are affected by choosing different values α for the repulsion force between heterogeneous pairs in the LR rule.
Figure 4 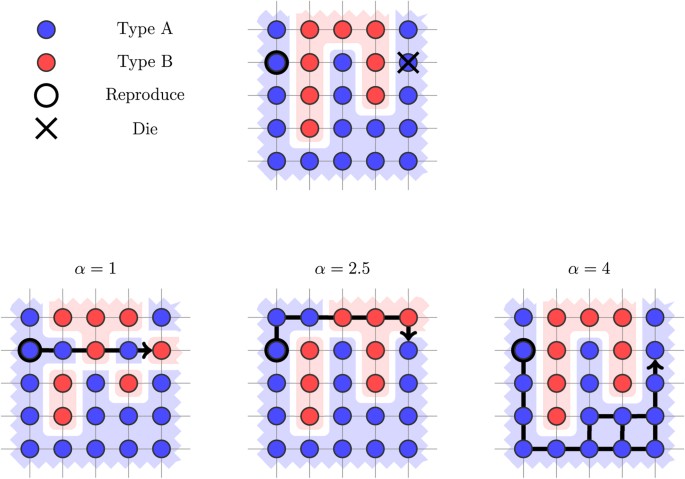
Illustration of the LR shift rule.
The least-resistance path from the reproducing to the dying cell differs as the repulsion force α increases. Initially, we have one cluster of Type B individuals. When we update for α = 1, the result is four clusters of Type B individuals. When we update for α = 2.5, the result is two clusters of Type B individuals. When we update for α = 4, the grid remains unchanged and we have only one cluster.
-
2
Least neighbor-resistance rule (LNR). In the LNR rule, informally, the path P is chosen by decreasing proportionally to the resistance to (i1, j1) in each step. Formally, for each position v = (i, j) in the grid, let Nh(v) be the set of its neighbors and NhR(v) = {v′ ∈ Nh(v):d(v′) < d(v)} denote the neighbors with strictly smaller resistance value. Informally, every such neighbor is a candidate for being chosen as the next position in the path and the probability to be chosen is inversely proportional to the resistance values. Formally, for a position v and a neighbor v′ in NhR(v), let
 , denote the probability to choose v′ as the next position from v. In other words, at position v the next vertex is chosen inversely proportional to the resistance values to decrease the resistance (i.e., the lower the resistance of a neighbor, the higher is the probability to be chosen). The path P is chosen using the following stochastic process: the starting position is (i2, j2) and at each step if the current position is v, then the next position v′ ∈ NhR(v) is chosen with probability p(v, v′), until (i1, j1) is reached. This rule also follows a least-effort principle, but the choice is now made locally at each step rather than choosing among the least-resistance paths. Figure 5 illustrates the above process.
Figure 5 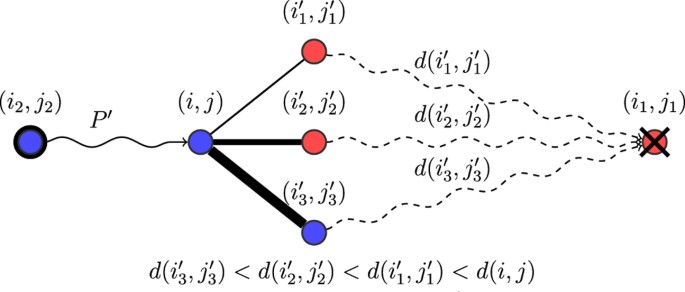
Illustration of the LNR shift rule.
The path
 from reproduction to death is formed dynamically. Given a current prefix
  , a neighbor (i′, j′) of (i, j) is likely to extend P′ with probability proportional to 1/d(i′, j′), as long as d(i′, j′) < d(i, j). The process repeats until (i1, j1) is reached.
 be the set of paths P′ from (i2, j2) to (i1, j1) that achieve the resistance value. In other words LRP represents the set of all least-resistance paths from (i2, j2) to (i1, j1). The path P is then chosen uniformly at random from the set LRP. Intuitively, this captures a least-effort principle, where the reproducing individual will fill the hole while spending as little energy as possible.
 , denote the probability to choose v′ as the next position from v. In other words, at position v the next vertex is chosen inversely proportional to the resistance values to decrease the resistance (i.e., the lower the resistance of a neighbor, the higher is the probability to be chosen). The path P is chosen using the following stochastic process: the starting position is (i2, j2) and at each step if the current position is v, then the next position v′ ∈ NhR(v) is chosen with probability p(v, v′), until (i1, j1) is reached. This rule also follows a least-effort principle, but the choice is now made locally at each step rather than choosing among the least-resistance paths.
 from reproduction to death is formed dynamically. Given a current prefix
  , a neighbor (i′, j′) of (i, j) is likely to extend P′ with probability proportional to 1/d(i′, j′), as long as d(i′, j′) < d(i, j). The process repeats until (i1, j1) is reached.
Important features
We discuss three important aspects of the introduced instances of the shift rule. First, the least-resistance principle is a natural one, which captures affinity between neighbors. The LR rule chooses uniformly among the global least-resistance choices; whereas the LNR rule follows a stepwise reduction in the resistance. Second, these shift rules are very simple, as they are based on just one parameter α. Finally, many rules can be obtained as special case of the LR and LNR rules, e.g., for α = 1, we have that both LR and LNR coincide with the natural generalization of the shift rule on a cycle.
Strong selection
In this section we present results for strong selection, where we compare the LR and the LNR rule for various values α against the death-birth rule and the same rules for the specific value of α = 1, which is the generalization of the shift rule on a cycle.
We have used simulations to evaluate the success of cooperation under the two instantiations of the shift rule on 2-dimensional grids. The simulations cover various grid sizes, benefit-to-cost ratios (with fixed c = 1) and values of the repulsion force α. The results for the LR rule are shown in Fig. 6. We find that for larger values of α, cooperation is favored (ρC > ρD) even for (b/c) < 4, which is the required threshold for the death-birth rule in case of 2-dimensional grids. In contrast, in such a strong selection setting (δ = 1) and for small/moderate population sizes N, the death-birth rule or α = 1 favors defection (see Fig. 6). The results for the LNR rule are shown in Fig. 7. Here cooperation is favored for much smaller b/c ratios and values α of the repulsion force.

LR rule.
Relative fixation probability  of cooperators in n × n grids, for different values of n and benefit-to-cost ratios b/c. The fixation probabilities ρC (resp. ρD) correspond to a single cooperator (resp. defector) mutant in a population of defectors (resp. cooperators). The db denotes the death-birth process run for the same parameters. As b/c and α increase, ρ also increases and exceeds 0.5 and cooperation is favored. The fixation probabilities are averages over 104 replicates.

LNR rule.
Relative fixation probability  of cooperators in n × n grids, for different values of n and benefit-to-cost ratios b/c. The fixation probabilities ρC (resp. ρD) correspond to a single cooperator (resp. defector) mutant in a population of defectors (resp. cooperators). db denotes the death-birth process run for the same parameters. As b/c and α increase, ρ also increases and exceeds 0.5 and cooperation is favored. The fixation probabilities are averages over 104 replicates.
To explain the evolutionary advantage of cooperators for larger values of the repulsion force, we have peeked into the structure of the population throughout the evolutionary process and in particular, in the number of cooperator clusters and on the average number of cooperating neighbors that a cooperator has. We find that as α increases, the population of cooperators is clustered in a small number of large clusters. On average, this leads to each cooperator having more cooperating neighbors (see Figs 8 and 9) and thus increases the fecundity of the population of cooperators. These results also explain the significant advantage of the LNR over the LR rule, as under the LNR rule, the cooperators are grouped in fewer, larger clusters and thus on average a cooperator has many more cooperating neighbors.

Statistics on a 25 × 25 grid of cooperators with an initial cluster 9 × 9 of defector mutants, for b = 4 and different values of the repulsion force α.
Data points are averages over 200 replicates. Left: The increase in the number of cooperators in the grid leads to the formation of cooperator clusters. Higher values of the repulsion force lead to fewer, larger clusters. Right: The average number of cooperators around a cooperator as the number of cooperators increases. Higher values of the repulsion force lead, on average, to more cooperators per cooperator. The difference is more pronounced when the cooperators are the minority in the population (i.e., left part of the figures).

Statistics on a 25 × 25 grid of cooperators with an initial cluster 2 × 2 of cooperator mutants, for b = 3 and different values of the repulsion force α.
Data points are averages over 200 replicates. Left: The increase in the number of cooperators in the grid leads to the formation of cooperator clusters. Higher values of the repulsion force lead to fewer, larger clusters. Right: The average number of cooperators around a cooperator as the number of cooperators increases. Higher values of the repulsion force lead, on average, to more cooperators per cooperator. The difference is more pronounced when the cooperators are the minority in the population (i.e., left part of the figures).
As discussed earlier, the shift rule on a grid reduces to the shift rule on a cycle if we consider 1-dimensional grids. This is because in the case of a cycle, the path from the reproducing to the dying individual does not affect the state of the population. However, in the opposite direction, there are several update rules that generalize the shift rule from a cycle to a 2-dimensional grid. The early efforts of61 for shift updates on a grid lead to rules that fail to promote cooperation, as in higher dimensions clusters of cooperators were easily disrupted by invading defectors. Indeed, same-type individuals are not clustered together and the state of the population is not described by a single parameter (e.g., the number of cooperators), as in the case of the cycle. Here we find that by introducing repulsion force between different-type individuals, cooperation is favored, for small benefit-to-cost ratios.
Computational bottlenecks
Determining the relative fixation probability  via computer simulations is a computationally expensive process. Observe that the fixation probabilities ρC and ρD are small, even for small grid sizes, as they represent the probability of fixation of a single individual in a population of different-type individuals. As ρ is a fraction of small numbers, it is unstable in small perturbations of ρC and ρD. Thus a robust approximation of ρ requires estimating ρC and ρD to a significant precision, via many replicates (different runs) of the simulated process. In our simulation we ran 104 replicates. For example, in grid 16 × 16, the population size is 256 and the time to fixation is around 103 steps. Each step requires a shortest-path computation, which for graphs of size N requires N⋅logN time, (i.e., in our case around 1.4 × 10³ operations) (for further details see SI). Hence for each initial condition we require 1.4 × 10¹⁰ operations and since we have two initial conditions (a single cooperator and a single defector to start with), the total number of computational steps is 2.8 × 10¹⁰. Since we have many different α values and many different grid sizes, the total computational steps required were around 5 × 10¹¹. Hence computer simulations to obtain results for larger grid sizes is infeasible in reasonable time.
Weak selection
We now consider the weak selection regime, where δ ≪ 1. For weak selection, estimating the fixation probabilities directly from simulated runs is not possible, as the payoffs of individuals impact the evolution of the population only in the long run. Hence to understand the weak selection scenarios we need to consider mathematical results, which we discuss next.
The critical benefit-to-cost ratio for favoring cooperation in structured populations in the weak selection regime is characterized by the structure coefficient σ43,64. In particular, we consider a mutation rate μ ≤ 1, such that every reproducing individual has probability μ to produce an offspring of the different type. Moreover, to keep the effect of mutation minimal, we consider the low-mutation case, where given a population of size N we have Nμ ≪ 1. Now neither cooperators nor defectors get fixed, but instead they coexist in different proportions in the population and the evolutionary success of either type is quantified by its abundance in the steady state. It has been shown in43 that there exists a parameter σ (structure coefficient) such that the critical benefit-to-cost ratio for which cooperators are more abundant than defectors is

when payoffs are received from individual interactions according to matrix (2). The structure coefficient σ can depend on the structure of the population, the update rule, the mutation rate and other parameters, but not on the payoffs b and c. Hence Eq. (4) allows to characterize the relative abundance of cooperators wrt two orthogonal parts; the benefit-to-cost ratio captures the contribution of the parameters of the game and σ captures the contribution of the evolutionary process. As shown in64, there is a simple formula to calculate σ for the large class of evolutionary processes that satisfy the following conditions:
-
1
global updating, i.e., all individuals compete uniformly for reproduction and
-
2
constant birth or death rate, i.e., the individual payoffs do not affect both births and deaths.
In this case, we can write

where IXY denotes the number of interactions between type X and type Y individuals in a state, NX denotes the number of type X individuals and 〈⋅〉0 denotes averaging over all possible states of the stochastic process under neutral drift (δ = 0). The evolutionary process introduced in this paper (i.e., the LR and LNR rule) satisfies (i) and (ii) and thus Eq. (5) is applicable.
Even though Eq. (5) is applicable, it is hard to compute analytically. However, the equation suggests a way to approximate σ, by simulating the evolutionary process under neutral drift sufficiently long. In our results, we simulated the evolutionary processes under neutral drift, from various initial conditions, for sufficiently long until they all reasonably converged to produce the same result. Here we report on approximations of σ and the critical benefit-to-cost ratio obtained from them for the following three update rules.
-
1
LNR with repulsion force α = ∞,
-
2
LR with repulsion force α = ∞,
-
3
LNR, LR with repulsion force α = 1 (in this case the two rules coincide).
Our results are shown in Table 1. For each entry in the table we ran the computation for various initial conditions, for 109 steps, in parallel, which took around 4 weeks. We report these results, which at best is an approximation of the critical benefit-to-cost ratio and the original benefit-to-cost ratio might differ by a small amount. While for the LNR rule with α = ∞ the critical benefit-to-cost ratio is well below 4, for the LR rule with α = ∞ it is around 4, whereas with α = 1, it is well above 4. Also note that for the death-birth rule the critical benefit-to-cost ratio of 4 for grids is only in limit the large populations, whereas our results are for population size up to 400.
Discussion
We now discuss some important aspects of our results. First, we report success on designing natural rules to favor cooperation in a two-dimensional grid. Second, our result also shows some robustness in the following sense. Our key principle is introducing a single parameter α for the repulsion force that captures assortment between individuals of the same type. We show that two different simple rules (LR and LNR) based on this principle lead to critical benefit-to-cost ratio (b/c)* < 4, which is the the critical ratio for the death-birth rule. Note that the critical benefit-to-cost ratio of 4 for the death-birth rule in two-dimensional grid is only for population of large sizes, whereas for our rules even for moderate population size (such as 400) both LR and LNR have critical benefit-to-cost ratio strictly below 4 (and for LNR rule this holds for even population size of 100). Intuitively, the repulsion force favors update paths that cross fewer clusters and thus leading to fewer disruptions of the cooperator clusters, which is a crucial ingredient for the rise of cooperation2,3,10. While the LNR rule works better than the LR rule, the fact two different rules can be developed based on a single principle, shows that the principle we propose is a robust one.
Animated illustrations of the various evolutionary processes discussed (namely, death-birth, LR and LNR) and different values of selection intensity and repulsion force can be found in http://pub.ist.ac.at/~pavlogiannis/grid/.
Conclusion
We have studied evolutionary game dynamics on a two-dimensional grid. While the shift-update rule61 is a strong promoter of cooperation in one dimension, all previous generalizations of the rule to higher dimensions have failed to promote cooperation. Here we introduce two natural variants of shift updating, LR and LNR, based on a repulsion force of cells of different type and an energy-minimization principle. We show that those rules promote cooperation on the two-dimensional grid for strong and for weak selection. An interesting direction of future work is to consider those rules for higher dimensions and other population structures. A natural extension is also to study how rules could generate semi fluid population structures with a tunable level of viscosity.
Additional Information
How to cite this article: Pavlogiannis, A. et al. Cellular cooperation with shift updating and repulsion. Sci. Rep. 5, 17147; doi: 10.1038/srep17147 (2015).
References
Smith, J. M. & Szathmáry, E. The major transitions in evolution (Perseus Books, Cambridge, MA, USA, 1995).
Nowak, M. & Highfield, R. SuperCooperators: Altruism, Evolution and Why We Need Each Other to Succeed (Free Press, 2011).
Nowak, M. A. Five rules for the evolution of cooperation. Science 314, 1560–1563 (2006).
Nowak, M. A. & Sigmund, K. Evolutionary dynamics of biological games. Science 303, 793–799 (2004).
Nowak, M. A., Sasaki, A., Taylor, C. & Fudenberg, D. Emergence of cooperation and evolutionary stability in finite populations. Nature 428, 646–650 (2004).
Nowak, M. A., Tarnita, C. E. & Antal, T. Evolutionary dynamics in structured populations. Philos. T. Roy. Soc. B 365, 19–30 (2009).
Tainaka, K. Lattice model for the lotka-volterra system. J. Phys. Soc. Jpn. 57, 2588–2590 (1988).
Nowak, M. A. & May, R. M. Evolutionary games and spatial chaos. Nature 359, 826–829 (1992).
Szabó, G. & Töke, C. Evolutionary prisoner’s dilemma game on a square lattice. Phys. Rev. E 58, 69–73 (1998).
Assenza, S., Gómez-Gardeñes, J. & Latora, V. Enhancement of cooperation in highly clustered scale-free networks. Phys. Rev. E 78, 017101 (2008).
Durrett, R. & Levin, S. The importance of being discrete (and spatial). Theor. Popul. Biol. 46, 363–394 (1994).
Durrett, R. & Levin, S. A. Stochastic spatial models: A user’s guide to ecological applications. Philos. T. Roy. Soc. B 343, 329–350 (1994).
Herz, A. V. Collective phenomena in spatially extended evolutionary games. J. Theor. Biol. 169, 65–87 (1994).
Hassell, M. P., Comins, H. N. & May, R. M. Species coexistence and self-organizing spatial dynamics. Nature 370, 290–292 (1994).
Lindgren, K. & Nordahl, M. G. Evolutionary dynamics of spatial games. Physica D 75, 292–309 (1994).
Kerr, B. & Godfrey-Smith, P. Individualist and multi-level perspectives on selection in structured populations. Biol. Philos. 17, 477–517 (2002).
Hauert, C. & Doebeli, M. Spatial structure often inhibits the evolution of cooperation in the snowdrift game. Nature 428, 643–646 (2004).
Van Veelen, M., García, J., Rand, D. G. & Nowak, M. A. Direct reciprocity in structured populations. Proc. Natl. Acad. Sci. 109, 9929–9934 (2012).
Szabó, G., Antal, T., Szabó, P. & Droz, M. Spatial evolutionary prisoner’s dilemma game with three strategies and external constraints. Phys. Rev. E 62, 1095–1103 (2000).
Broom, M. & Rychtář, J. A general framework for analysing multiplayer games in networks using territorial interactions as a case study. J. Theor. Biol. 302, 70–80 (2012).
Lieberman, E., Hauert, C. & Nowak, M. A. Evolutionary dynamics on graphs. Nature 433, 312–316 (2005).
Szabó, G. & Fáth, G. Evolutionary games on graphs. Phys. Rep. 446, 97–216 (2007).
Débarre, F., Hauert, C. & Doebeli, M. Social evolution in structured populations. Nat. Commun. 5, 3409 (2014).
Perc, M., Gómez-Gardeñes, J., Szolnoki, A., Flora, L. M. & Moreno, Y. Evolutionary dynamics of group interactions on structured populations: a review. J. R. Soc. Interface, 80, 10 (2013).
Ohtsuki, H., Pacheco, J. M. & Nowak, M. A. Evolutionary graph theory: Breaking the symmetry between interaction and replacement. J. Theor. Biol. 246, 681–694 (2007).
Tarnita, C. E., Antal, T., Ohtsuki, H. & Nowak, M. A. Evolutionary dynamics in set structured populations. Proc. Natl. Acad. Sci. 106, 8601–8604 (2009).
Wu, B. et al. Evolution of cooperation on stochastic dynamical networks. PLoS ONE 5, e11187 (2010).
Wardil, L. & Hauert, C. Origin and structure of dynamic cooperative networks. Sci. Rep. 4, 5725 EP–(2014).
Szolnoki, A. & Perc, M. Resolving social dilemmas on evolving random networks. Europhys. Lett. 86, 30007 (2009).
Adlam, B., Chatterjee, K. & Nowak, M. A. Amplifiers of selection. Proc. R. Soc. A 471 (2015).
Nowak, M. A., Michor, F. & Iwasa, Y. The linear process of somatic evolution. Proc. Natl. Acad. Sci. 100, 14966–14969 (2003).
Allen, B. et al. The molecular clock of neutral evolution can be accelerated or slowed by asymmetric spatial structure. PLoS Comput. Biol. 11, e1004108 (2015).
Travers, J., Milgram, S., Travers, J. & Milgram, S. An experimental study of the small world problem. Sociometry 32, 425–443 (1969).
Riolo, R. L., Cohen, M. D. & Axelrod, R. Evolution of cooperation without reciprocity. Nature 414, 441–443 (2001).
Dodds, P. S., Muhamad, R. & Watts, D. J. An experimental study of search in global social networks. Science 301, 827–829 (2003).
Hochberg, M. E., Sinervo, B. & Brown, S. P. Socially mediated speciation. Evolution 57, 154–158 (2003).
Jansen, V. A. A. & van Baalen, M. Altruism through beard chromodynamics. Nature 440, 663–666 (2006).
Perc, M. & Szolnoki, A. Social diversity and promotion of cooperation in the spatial prisoner’s dilemma game. Phys. Rev. E 77, 011904 (2008).
Ohtsuki, H., Hauert, C., Lieberman, E. & Nowak, M. A. A simple rule for the evolution of cooperation on graphs and social networks. Nature 441, 502–505 (2006).
Nowak, M. A. & May, R. M. The spatial delimmas of evolution. Int. J. Bifurcat. Chaos. 03, 35–78 (1993).
Killingback, T. & Doebeli, M. Spatial evolutionary game theory: Hawks and doves revisited. Proc. R. Soc. B 263, 1135–1144 (1996).
Allen, B. & Martin, N. Games on graphs. EMS Surv. Math. Sci. 1, 113–151 (2014).
Tarnita, C. E., Ohtsuki, H., Antal, T., Fu, F. & Nowak, M. A. Strategy selection in structured populations. J. Theor. Biol. 259, 570–581 (2009).
Szolnoki, A., Perc, M. C. V. & Szabó, G. Topology-independent impact of noise on cooperation in spatial public goods games. Phys. Rev. E 80, 056109 (2009).
Helbing, D., Szolnoki, A., Perc, M. & Szabó, G. Punish, but not too hard: how costly punishment spreads in the spatial public goods game. New J. Phys. 12, 083005 (2010).
Helbing, D. & Yu, W. The outbreak of cooperation among success-driven individuals under noisy conditions. Proc. Natl. Acad. Sci. 106, 3680–3685 (2009).
Tarnita, C. E. Fairness and trust in structured populations. Games 6, 214 (2015).
Ferriere, R. & Michod, R. E. The evolution of cooperation in spatially heterogeneous populations. Am. Nat. 147, pp. 692–717 (1996).
Nakamaru, M., Matsuda, H. & Iwasa, Y. The evolution of cooperation in a lattice-structured population. J. Theor. Biol. 184, 65–81 (1997).
Nakamaru, M., Nogami, H. & Iwasa, Y. Score-dependent fertility model for the evolution of cooperation in a lattice. J. Theor. Biol. 194, 101–124 (1998).
Nakamaru, M. & Iwasa, Y. Score-dependent fertility model for the evolution of cooperation in a lattice. J. Theor. Biol. 7, 853–870 (2005).
Shang, L. H., Li, X. & Wang, X. F. Cooperative dynamics of snowdrift game on spatial distance-dependent small-world networks. Eur. Phys. J. B 54, 369–373 (2006).
Heilbing, D. & Yu, W. Migration as a mechanism to promote cooperation. Adv. Complex Syst. 11, 641–652 (2008).
Locey, M. L., Safin, V. & Rachlin, H. Social discounting and the prisoner’s dilemma game. J. Exp. Anal. Behav. 99, 85–97 (2013).
Fu, F., Nowak, M. A. & Hauert, C. Invasion and expansion of cooperators in lattice populations: Prisoner’s dilemma vs. snowdrift games. J. Theor. Biol. 266, 358–366 (2010).
Allen, B. & Tarnita, C. E. Measures of success in a class of evolutionary models with fixed population size and structure. J. Math. Biol. 68, 109–143 (2014).
Taylor, P. D., Day, T. & Wild, G. Evolution of cooperation in a finite homogeneous graph. Nature 447, 469–472 (2007).
Chen, Y.-T. Sharp benefit-to-cost rules for the evolution of cooperation on regular graphs. Ann. Appl. Probab. 23, 637–664 (2013).
Allen, B., Traulsen, A., Tarnita, C. E. & Nowak, M. A. How mutation affects evolutionary games on graphs. J. Theor. Biol. 299, 97–105 (2012).
Ohtsuki, H. & Nowak, M. A. Evolutionary games on cycles. Proc. R. Soc. B 273, 2249–2256 (2006).
Allen, B. & Nowak, M. A. Evolutionary shift dynamics on a cycle. J. Theor. Biol. 311, 28–39 (2012).
Nowak, M. Evolutionary Dynamics (Harvard University Press, 2006).
Nowak, M. A., Sasaki, A., Taylor, C. & Fudenberg, D. Emergence of cooperation and evolutionary stability in finite populations. Nature 428, 646–650 (2004).
Nathanson, C. G., Tarnita, C. E. & Nowak, M. A. Calculating evolutionary dynamics in structured populations. PLoS Comput. Biol. 5, e1000615 (2009).
Acknowledgements
The research was supported by the Austrian Science Fund (FWF) Grant No P23499-N23, FWF NFN Grant No S11407-N23 (RiSE/SHiNE), ERC Start grant (279307: Graph Games) and Microsoft Faculty Fellows award. Support from the John Templeton foundation is gratefully acknowledged.
Author information
Authors and Affiliations
Contributions
A.P., K.C., B.A. and M.A.N. wrote the manuscript and A.P. produced figures 1–9. All authors reviewed the manuscript.
Ethics declarations
Competing interests
The authors declare no competing financial interests.
Rights and permissions
This work is licensed under a Creative Commons Attribution 4.0 International License. The images or other third party material in this article are included in the article’s Creative Commons license, unless indicated otherwise in the credit line; if the material is not included under the Creative Commons license, users will need to obtain permission from the license holder to reproduce the material. To view a copy of this license, visit http://creativecommons.org/licenses/by/4.0/
About this article

Cite this article
Pavlogiannis, A., Chatterjee, K., Adlam, B. et al. Cellular cooperation with shift updating and repulsion. Sci Rep 5, 17147 (2015). https://doi.org/10.1038/srep17147
Received:
Accepted:
Published:
DOI: https://doi.org/10.1038/srep17147
- Springer Nature Limited