
Abstract
Studies about the metabolic alterations during tumorigenesis have increased our knowledge of the underlying mechanisms and consequences, which are important for diagnostic and therapeutic investigations. In this scenario and in the era of systems biology, metabolic networks have become a powerful tool to unravel the complexity of the cancer metabolic machinery and the heterogeneity of this disease. Here, we present TumorMet, a repository of tumor metabolic networks extracted from context-specific Genome-Scale Metabolic Models, as a benchmark for graph machine learning algorithms and network analyses. This repository has an extended scope for use in graph classification, clustering, community detection, and graph embedding studies. Along with the data, we developed and provided Met2Graph, an R package for creating three different types of metabolic graphs, depending on the desired nodes and edges: Metabolites-, Enzymes-, and Reactions-based graphs. This package allows the easy generation of datasets for downstream analysis.
Measurement(s) | gene expression, metabolic relationships |
Technology Type(s) | Genome Scale Metabolic Models; Computational network biology |
Sample Characteristic - Organism | Homo sapiens |
Background & Summary
Cancer is a complex disease caused by a myriad of factors and characterized by an astonishing complexity of phenotypes and traits, which determine its wide heterogeneity, even among cells of a single tissue. Nonetheless, three key processes are shared by all cancer cells: proliferation, invasion, and metastasis. To fulfill these tasks, cancer cells need to reprogram their metabolic activities and cross-talk with their neighborhood1,2. This evidence gives the metabolism and its players a crucial role in cancer progression and, consequently, cancer research.
Among all the biological networks, the metabolic ones are particularly complex and highly interconnected. Still, they probably are the best characterized in terms of connections and those that better represent the genotype-phenotype associations3. According to this, the reconstruction of comprehensive networks through the integration of omics data into metabolic scaffolds is one of the tools preferred by the systems biology approach for investigating biological phenomena from a holistic point of view. The metabolic scaffolds are given by the Genome-Scale Metabolic Models (GSMs), built from multi-omics data integration, and carrying information concerning the genes/proteins with enzymatic activity, how they interact with bioactive compounds in the context of biochemical reactions, and how the metabolic interconnections change in different cells, tissues or specific conditions4. There is a great interest in exploiting these models to generate condition-specific graphs at the service of machine learning approaches. In the era of precision medicine, the main goal is to develop approaches and tools to face the well-known heterogeneity of physiological and pathological manifestations and provide focused solutions for specific conditions. Considering the disease cohort as a single group, including all the diagnosed patients, is a simplistic approach that does not contemplate any inter-samples heterogeneity due to genetic and environmental factors. While modern biology has accepted the intra-sample heterogeneity of single cells, it seems anachronistic to talk about disease- instead of patient-specific conditions. There are several studies that address the problem of heterogeneity by exploiting network-structured approaches5,6,7.
Metabolic networks are complex and can involve different metabolic players (i.e., metabolites, enzymes, reactions). Machine and deep learning frameworks allow extracting knowledge from the metabolic networks while dealing with their structural and relational complexity4. In the context of findability, accessibility, interoperability, and reusability (FAIR) principles8, providing benchmark datasets for comparing novel approaches and for the general advancement of a specific research domain is extremely important. Graph-structured data coupled with machine learning approaches are receiving growing interest9,10,11,12,13, and many benchmark datasets have been proposed in the context of biomedical graphs, especially derived from protein-protein interaction, chemical, imaging data14,15,16,17,18. To the best of our knowledge, metabolic networks based on context- and patient-specific metabolic models have not been provided so far. To fill this gap, here, we provide the TumorMet repository. TumorMet contains two main sets of networks depending on the models from which they derive: Tissue-derived networks generated starting from tissue-specific models and PDGSMMs-derived networks obtained using Patient-Derived Genome-Scale Metabolic Models (PDGSMMs). The interesting implications of using the metabolic networks are twofold, from both a computational and biological perspective. Their complexity in terms of nodes and connections, and the plasticity given by the multiple ways in which they can be generated, make them appealing for the proposal and validation of novel approaches in the context of computational graph-based research. In this work, we presented three alternatives, each focused on a specific set of metabolic players (i.e., metabolites, enzymes, and reactions). As demonstrated by19, reconstruction algorithms used to generate context-specific models present a bug which determines an underestimation of the molecular context. The model’s conversion into a network allows further contextualization by integrating context-specific data. Being aware that the networks we generated for TumorMet are just a portion of the possibilities, we provided the Met2Graph package to give the user the freedom to build the networks depending on specific needs. Met2Graph indeed implements a flexible process flow to build the metabolic graphs, can be easily integrated with user-customized functions, and provides several arguments to personalize the networks. Some of the networks in this dataset were used for assessing graphs classification, clustering, and embedding20,21,22,23, as well as for multimodal data analysis24,25, demonstrating their benefits. An exciting field of biological network usage is also represented by the application of node classification approaches aimed at predicting the essential genes, namely those genes crucial for an organism’s viability. Usually, the Protein-Protein Interaction (PPI) networks are exploited to this extent, based on the assumption that the topological centrality is correlated to a functional centrality. As hypothesized in26, one of the reasons why the PPI are the most used networks for this purpose could be their abundance compared to the other types, such as Metabolic networks, highlighting the importance of providing network datasets. Still, only physical interactions, additionally not contextualized, are insufficient to represent the genetic connections’ complexity27. Modern biology extensively uses networks to integrate and analyze data in a way in which organisms, tissues, or cells are considered systems. This perspective gives a crucial role to the connections among biological components, and the network-based analyses are exploited for making relevant biological inferences. The central role of metabolism in different aspects of pathophysiological mechanisms and their tune regulation make these networks particularly interesting for extracting knowledge and making predictions. For example, the analysis of hub nodes28 and the comparison of topological properties between different context-specific networks29 are valuable resources in diagnostic and prognostic markers investigation for precision medicine. Along with the data, we also provide an R package, Met2Graph, to create metabolic graphs starting from GSMs and gene expression data. The package can generate three types of graphs, depending on the desired nodes and edges: Metabolites-based graphs, where metabolites are nodes connected by reactant-product relationships and the edges can be weighted by expression values of the enzymes catalyzing the corresponding reactions; Enzymes-based graphs, where enzymes are nodes that are connected if they catalyze two reactions, each producing and consuming a specific metabolite; and Reactions-based graphs, with reactions as nodes connected if the metabolite produced by one is consumed by the other. TumorMet is deposited at figshare repository30 and the Met2Graph package used to generate it is available at the Met2Graph Github repository (https://github.com/cds-group/Met2Graph).
Methods
The metabolism involves several players, and focusing on one or another influences the type of analysis and the knowledge that can be extracted. The metabolites and the enzymes represent the main molecular components. A biochemical reaction is a transformation process that uses/consumes some metabolites (reactants) to produce new ones (products). The enzymes can facilitate these transformations as they are particular proteins having catalytic activity and the ability to speed up the rate of a reaction binding the substrate by a lock-key or induced-fit model. Not all the reactions are catalyzed by enzymes, as some of them can occur spontaneously. The enzymes are selective; this means that one binds specifically one or few substrates and, consequently, can catalyze one or more reactions, while the same reaction can be catalyzed by more enzymes acting as complex or as mutually exclusive catalyzers. This information is crucial in defining the rules to design a metabolic network since the connections between the metabolic players can be multiple and of different nature when involving the enzymes. In order to manage this issue, we defined some simplification strategies when enzymes represent edges and give rise to multiple connections (as in the case of Metabolites-based networks) and a different consideration of complex and mutually exclusive relationships when enzymes represent the nodes (as in the case of Enzymes-based networks). Further details are provided below in the network construction sections. The repository we provide contains different types of metabolic networks, depending on the nodes and the rules behind the connections: Metabolites-, Enzymes- and Reactions-based networks. A graphical overview of the metabolic networks construction is provided in Fig. 1.

Overview of the Metabolic networks construction. The context-specific GSMs used in this study derive from the human generic GSM through the integration of tissue-specific multi-omics data (tissue-specific GSMs from Human Metabolic Atlas) or by integration of TCGA transcriptomics data (PDGSMMs from Biomodels). The context-specific GSMs carrying information about biochemical reactions are the input to create the context-specific metabolic networks of the TumorMet repository. Metabolites-based_tissue networks are generated by integrating TCGA gene/enzyme-expression data into the tissue-specific GSMs to weight the edges represented by enzymes connecting two metabolites. Networks of different patients have the same structure with different edge weights depending on patient expression profile. Enzymes-, Reactions and Metabolites-based_PDGSMMs networks are created from PDGSMMs and have enzymes/reactions as nodes connected by metabolites or metabolites as nodes connected by enzymes. Networks of different patients have different structures and no weights.
Metabolic models
Tissue-specific GSMs for 5 of the different origin sites of cancer (lung, kidney, brain, ovary, prostate)31 and breast cancer INIT model32 were downloaded from the Metabolic Atlas repository (http://www.metabolicatlas.org) in the compressed Systems Biology Markup Language (SBML) format33 to create the Metabolites-based graphs. PDGSMMs from the Biomodels repository (https://www.ebi.ac.uk/biomodels/pdgsmm/) have been downloaded to generate Metabolites-, Enzymes- and Reactions-based_PDGSMMs graphs for each patient. The Gene-Protein-Reaction (GPR) relationships were extracted from version 1.4.1 of the human generic GSM (https://github.com/SysBioChalmers/Human-GEM/tree/master/model).
Gene expression data
Gene expression data from 6 different tumor primary sites were used to create context-specific Metabolites-based metabolic networks. FPKM (fragments per kilobase per million reads mapped) normalized and log-transformed read counts from RNA sequencing experiments of the breast (TCGA-BRCA), lung (TCGA-LUAD and TCGA-LUSC), kidney (TCGA-KIRC and TCGA-KIRP), brain (TCGA-GBM and TCGA-LGG), ovary (TCGA-OV), and prostate (TCGA-PRAD) cancers were obtained from the Genomic Data Commons (GDC) data portal (https://portal.gdc.cancer.gov). GDC includes several cancer projects, among which The Cancer Genome Atlas (TCGA), which we selected to download the data. Each of them represents a dataset of the repository. Clinical annotations of the samples were also extracted from the database and included in each dataset as sample-sheets.
Metabolites-based_tissue networks construction
The metabolites are the nodes of the network, labeled by the corresponding ID, connected if they are involved in the same reaction, one as a reactant and one as a product. The connections have been created using the information from the relative context-specific metabolic model. Recurrent metabolites (e.g, ATP, CO2, H2O) have been removed to avoid redundant connections and unrealistic definition of paths34. The small molecules such as H2O, NH3, O2, CO2, phosphate, and cofactors are generally considered recurrent metabolites. The recurrent metabolites list we used is provided as external data of the package Met2Graph; the argument rmMets can be set to FALSE to avoid removal, or the list can obviously be personalized by the user. The GPR associations have been derived from the generic human GSM. Each edge is labeled by the Ensembl stable ID (in the form of ENS[species prefix][feature type prefix][a unique eleven-digit number]) of the enzyme/s catalyzing the reaction, when present, and weighted by the expression value/s of the corresponding gene/s obtained by the GDC Portal. Each resulting graph corresponds to a specific sample of the GDC tumor dataset considered. These rules create graphs where a couple of nodes can have multiple edges since multiple enzymes are involved in the same reaction and/or because the same nodes pair can be present in different reactions. Multiple edges have been simplified by averaging the expression values of enzymes acting in the same reaction and then summing up these averages corresponding to different reactions with the same nodes pair. Thus, all the graphs resulting from the same metabolic model have the same number of nodes and edges but different edge weights. The networks are then personalized for each patient by using the expression values and as a consequence, the gene context mentioned by19 is met. Based on the rules defining the edges, these networks are directed. The properties of these networks are summarized in Table 1.
Metabolites-based_PDGSMMs networks construction
The logic behind the generation of Metabolites-based_PDGSMMs networks is the same as that of the networks derived from tissue models described in the previous paragraph, with the only difference that here each patient-specific network is derived from the corresponding PDGSMM downloaded from the BioModels repository. The edges are weighted using the patient’s gene expression data from the GDC repository. Therefore, each patient-specific network has a different structure and different edge weights. These graphs are directed and weighted. The properties of these networks are summarized in Table 2a.
Enzymes-based_PDGSMMs networks construction
These networks have enzymes as nodes connected if one catalyzes a reaction producing a metabolite consumed in a reaction catalyzed by the other. The recurring metabolites have also here been removed. According to the GPR, the enzymes involved in each reaction are associated by AND or OR logical relationship, indicating an enzymatic complex or an alternative activity, respectively. Based on this, enzymes related by AND have been considered as a single node, while OR relationships have been split into different nodes. To create patient-specific networks, PDGSMMs have been used as starting models for Metabolites-, Enzymes-, and Reactions-based_PDGSMMs datasets and downloaded from the BioModels repository. Each sample graph has then a different structure deriving from a different model. These graphs are directed and not weighted. The properties of these networks are summarized in Table 2b.
Reactions-based_PDGSMMs networks construction
The rules behind these networks are similar to those of Enzymes-based networks, with the difference of having reactions as nodes, connected if one produces a metabolite consumed by the other. Recurring metabolites have been removed as well. To have sample-specific graphs also in this case we used the PDGSMMs from Biomodels. The resulting graphs are unweighted and directed, and each sample has a different structure determined by the different starting models. The properties of these networks are summarized in Table 2c.
Simplified networks construction
Given the complexity and the size of these networks, we also provided a set of Metabolites-based sub-networks of a subset of kidney and lung samples, simplified according to the approach described in21. Briefly, central nodes have been selected by the Eigen centrality score, a measure describing the importance of a node in a graph that depends on that of its neighbors. The classification tests performed to demonstrate the reliability of these sub-networks compared to the whole networks gave comparable accuracy results (see Tables 3 and 4 in21). For each tissue, two sets of networks with a different number (#) of resulting nodes are provided. The properties of these networks, forming the Simpl-Kidney-# and Simpl-Lung-# datasets, are summarized in Tables 3 and 4.
Classification
Metabolites-based_tissue datasets
In previous works, we have demonstrated the utility of the network datasets in classification and clustering tasks using subsets of some of the Metabolites-based graph datasets now included in the TumorMet repository20,21,35,36,37. Here, we extend to the entire repository the usage validation introduced in20, wherein we classify whole graphs sharing the same set of nodes. The basic idea is to 1) represent each graph of a dataset using probability distributions describing the topological properties of each node; 2) extract the distance matrix (Gram matrix), i.e., the symmetric square matrix containing the distances, taken pairwise, between the networks of the dataset; and 3) classify the networks based on the obtained distance vectors.
-
1.
Based on the performance results achieved in20,21,35,36,37, here we selected the Transition Matrix of order one \({{\mathscr{T}}}^{r}\) for representing each graph \({{\mathscr{G}}}^{r}\), whose generic element \({{\mathscr{T}}}_{i,j}^{r}\) is the probability of a node i to be reached in one step by a random walker located in node j. Each row \({{\mathscr{T}}}_{i}^{r}\) of this matrix includes local information on the connectivity of node i.
-
2.
For computing the distance between two networks \({{\mathscr{G}}}^{p}\) and \({{\mathscr{G}}}^{q}\), we selected the network distance:
$${\mathscr{M}}({{\mathscr{G}}}^{p},{{\mathscr{G}}}^{q})=\frac{1}{l}{\sum }_{i=1}^{l}{d}_{JS}({{\mathscr{T}}}_{i}^{p},{{\mathscr{T}}}_{i}^{q}),$$obtained by averaging over all the l graph nodes the Jensen-Shannon distances dJS of the probability distributions of their nodes38.
-
3.
For classification, we considered the primary tumor classes described in Table 6. In particular, for Kidney, Lung, and Brain, the Primary-Tumor diagnoses indicated in the GDC sample metadata file, downloaded along with the gene expression files, have been used to label the samples and fulfill the classification task. For Breast, the 5 subtypes have been derived from the PAM50 classification39. As the Normal-like subtype has only 40 samples and is very similar to the Luminal A subtype, we performed the tests both including (Breast_5cl) and excluding (Breast_4cl) this class. For Prostate, as having only one class of diagnosis, the Gleason pattern score, an indicator of different grades of malignancy, has been used. Among the possible four classes (Pattern from 2 to 5), we excluded the Pattern 2 class (not shown in Table 6), as it is made of only one sample. Moreover, we considered two different classification problems: the Prostate1 case, that aims at discriminating the Pattern 3 samples (199) from the Pattern 4 ones (249); and the Prostate2 case, that consists in discriminating the Pattern 3 samples from the samples being assigned to Pattern either 4 or 5 (289). For Ovary, the subtype assignment of High-Grade Serous Ovarian Cancer (HGSOC) has been taken from40.
Metabolites-, Enzymes-, and Reactions-based_PDGSMMs datasets
The graph2vec framework41 is a neural method for learning graph-level embeddings in an unsupervised manner. It describes nodes through a recursive node relabeling algorithm assigning to each node a label uniquely representing its rooted subgraph (neighborhood). These labels form a vocabulary of words, and graphs are represented in the form of documents. Then, the Distributed Bag of Words doc2vec approach42 is used to learn the graph (document) embeddings. The performance has been evaluated by means of a stratified 10-fold Cross-Validation (CV) in which a SVM classifier, with a linear kernel, was applied to train and make predictions on 64-sized vectorizations of graphs (embeddings) produced by graph2vec with a recursive depth of 3 and a training duration of 200 epochs. The class labels used for the classification task are specified in Table 5.
Data Records
The network files and associated metadata composing the repository TumorMet are available at figshare repository30. The file TumorMet-repository.pdf summarizes the content of the repository. For easy access to the files, the repository is organized into seven datasets, each in a separate folder, representing the six tumor tissues and the simplified networks (i.e., Prostate, Lung, Kidney, Breast, Ovary, Brain, and Simplified networks). In each main tissue dataset folder, the sample-sheet file reporting the sample metadata as downloaded from GDC (i.e. Sample sheet.tsv) and an excel file reporting the correspondences between PDGSMM ids and TCGA ids (Dictionary_ids.xlsx) are provided. Each tissue dataset folder contains subfolders for the different types of networks, namely Metabolites-, Enzymes-, and Reactions-based, compressed in.zip format. The Metabolites-based folder is further subdivided into folders containing the Metabolites-based networks deriving from tissue models (Metabolites-based_tissue) and BioModels PDGSMMs (Metabolites-based_PDGSMMs). Enzymes- and Reactions-based networks are only derived from PDGSMMs. Simplified networks are provided for Kidney and Lung tissues. Each tissue folder contains the sample-sheet file reporting the sample metadata as downloaded from GDC (i.e., Sample sheet.tsv) and two subfolders for the networks files based on the number of nodes retained after the simplification process (for Kidney eigen_simplified_441_nodes and eigen_simplified_1034_nodes; for Lung eigen_simplified_312_nodes and eigen_simplified_1017_nodes). All the network files are provided in GraphML format. GraphML is a flexible and convenient XML format for storing network information. It supports unweighted, weighted, undirected, and directed networks and allows for the definition of node and edge attributes (http://graphml.graphdrawing.org/). A scheme of the repository content is illustrated in Fig. 2, while a summary of the networks features in terms of starting material and number of networks is provided in Table 6.

Scheme of the content of the TumorMet repository.
Technical Validation
Our validation process consisted of data-type and structural validation, as well as usage validation through downstream applications.
Data-type and structural validation
The quality of the original data used to generate the networks is given by the reliability of the data sources repositories, i.e., GDC, Human Metabolic Atlas, and BioModels. Node IDs were verified to be of the same type. All edges were verified to be between nodes in the node list. All attribute data were verified to correspond to an existing node or edge. The structural integrity of the networks has been assessed by removing self-loops. Any duplicate edges were also removed. We further checked that nodes with no edges were not present in the networks.
Usage validation
The tumor metabolic networks can be exploited in several downstream applications, ranging from pure network analysis to multi-level integration with other biological networks or data, to machine and deep learning approaches for unraveling the complex metabolic machinery and its role in precision medicine. In this section, we show the usage of TumorMet networks in classification of tumor samples, thus giving an idea of one of their potential applications. To furnish a baseline for comparing methods and approaches, we give several details of the two different workflows used for Metabolites-based networks derived from tissue models and Metabolites-, Enzymes-, Reactions-based networks derived from PDGSMMs.
Metabolites-based_tissue datasets
For the evaluation of classification performance, i) each of the Metabolites-based datasets was subdivided into a training and a test set; ii) a statistical validation was obtained on the training sets using a 10-fold CV, to ensure that the results were not biased to a specific training subset; iii) finally, the classification performance on the test datasets was evaluated using the models built on the training datasets.
-
i).
In the case of Kidney, Lung, Breast, and Brain tissue datasets, the choice of the training sets was driven by our previous work36, where subsets of these datasets were already adopted for classification. Therefore, those subsets have been adopted here as training sets, while the newly added samples were assigned to the test sets. For the tissues not used previously (Ovary and Prostate), we obtained the training and test sets by using a 70:30 split ratio. The sample partitioning for each tissue is reported in Supplementary Table 1, while Figs. 3–4 provide the t-distributed Stochastic Neighbor Embedding (t-SNE) plots for the test sets.
Fig. 3 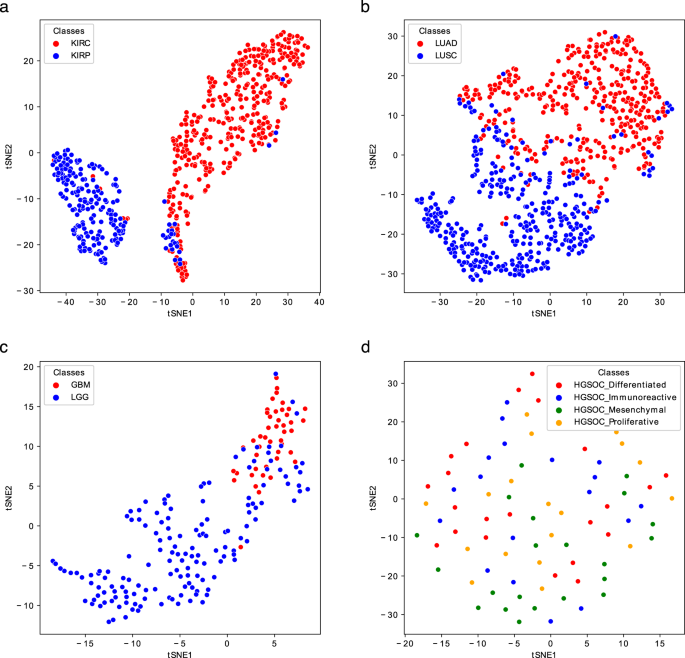
t-SNE representations of the Gram matrices of the test sets of the Kidney (a), Lung (b), Brain (c), and Ovary (d) Metabolites-based_tissue datasets. The TSNE function of the sklearn.manifold library has been used to generate the plots.
Fig. 4 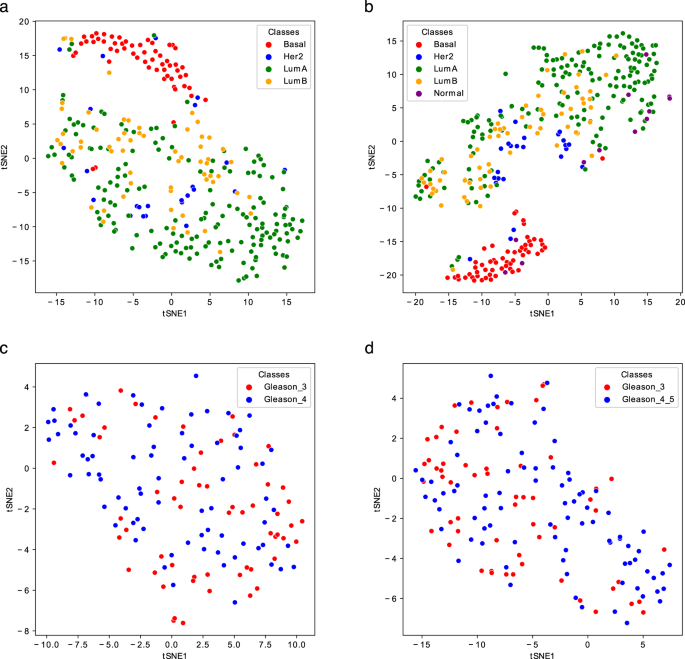
t-SNE representations of the Gram matrices of the test sets of the Breast_4cl (a), Breast_5cl (b), Prostate1 (c), and Prostate2 (d) Metabolites-based_tissue datasets. The TSNE function of the sklearn.manifold library has been used to generate the plots.
-
ii).
For the statistical validation on the training sets, the data were min-max normalized and a Support Vector Machine (SVM) classifier with linear kernel was adopted using the libsvm implementation43 available in scikit-learn44. The one-vs.-rest strategy was used to classify the multi-class datasets. To account for unbalanced datasets, the “balanced” mode in sklearn was used to set the class weights; this parameter penalizes the wrong prediction of the classes having a number of instances lower than the others. The 10-fold CV on the training datasets was repeated 10 times, and the average of the CV scores are reported in Table 9 (top); these scores are also shown in the form of box plots in Fig. 5.
Fig. 5 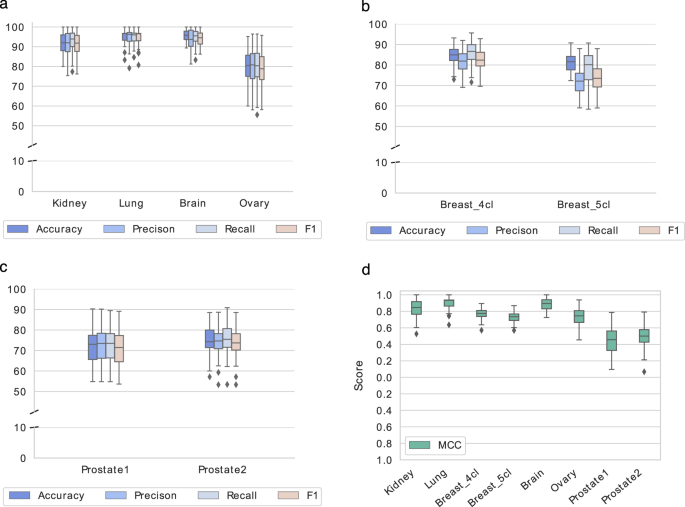
Classification scores on the Metabolites-based_tissue datasets. The box-plots show the classification scores obtained from the 10 iterations of the evaluation procedure on the training sets of the six Metabolites-based_tissue datasets. (a–c) report Accuracy, Precision, Recall, and F1 as percentages; (d) reports MCC values.
-
iii).
The classification performance on the test sets was computed using the same SVM classifier learned on the training sets. The obtained results are reported in Table 9 (bottom). Kidney, Lung and Brain graphs are well classified, as shown by accuracy scores both in CV on training sets and using new samples as testing data (Table 9 and Figs. 3, 5). More challenging tasks are instead given by the classification of Breast, Ovary and Prostate samples.


Regarding Breast, the inclusion of the Normal-like subtype into the classification does not dramatically change the results; however, compared to the tissues mentioned above, the results are worse, having an accuracy of around 80%. Looking at the t-SNE plots (Fig. 4a,b), it is evident how the Basal is the best discriminated and most homogeneous subtype, while some samples of Luminal A, Luminal B, and Her2 are overlapped, especially the latter two. Normal-like samples, as expected, are difficult to separate from Luminal A ones. Ovary samples are completely overlapping (Fig. 3d) and lead to poor accuracy percentage (around 70%, as reported in Table 9). Finally, the CV scores reported in Table 9 (top) and plotted in Fig. 5c, as well as the test samples validation results reported in Table 9 (bottom), indicate that Prostate samples are generally poorly discriminated and the results are slightly better for the Prostate2 classification task (when the Gleason Pattern 5 is assimilated to Pattern 4). Prostate cancer is characterized by a high molecular heterogeneity45 which is evidently not caught considering only the Gleason score, as also highlighted by the t-SNE plots reported in Fig. 4c,d.
Metabolites-, Enzymes-, Reactions-based_PDGSMMs datasets
As detailed in the Section on Metabolic networks construction, these PDGSMMs derived graphs differ from the Metabolites-based graphs in that they do not share a common set of nodes across all patients. Therefore, we decided to accomplish the classification task on these datasets through a whole-graph embedding framework. Classification results based on these embeddings using the class labels specified in Table 5 for the Kidney and Lung PDGSMMs derived network datasets are reported in Table 8.
It is evident that the performance for these types of networks is not as good as the one obtained with Metabolites-based graphs, but it is worth pointing out that the two approaches to the classification task are completely different due to the different nature of the networks. Enzymes- and Reactions-based networks are indeed not weighted and have different structures being generated from different models. The complexity and density of these networks surely require a deeper investigation of the best suitable approach and parameters tuning to discriminate the differences among the samples, which is not the aim of this paper. As mentioned previously, one of the interesting aspects of the metabolic networks is their plasticity since different types of graphs can be generated depending on the desired nodes and connections. In future work, we will consider generating unique tri-partite graph for each patient to investigate the possibility to reduce classification performance differences. As for the networks extracted from tissue-specific models, the Metabolites-based_PDGSMMs networks are weighted by gene expression values. Comparing weighted vs. non-weighted networks in terms of classification performance, it is evident that the weights do not add any crucial information for discriminating the classes (Table 9). These networks derive from PDGSMMs reconstructed through the tINIT algorithm integrating TCGA gene expression data. Adding expression values to edges is therefore redundant and likely the models are already well contextualized. Instead, the weights have a different role in Metabolites-based_tissue networks, where are crucial for personalizing the networks in terms of patients. Furthermore, even if tested with different methods, the patients-specific Metabolites-based networks derived from tissue models seem to well contextualize the tissue models in terms of patients resulting as more representative of the tumor classes and with a higher discriminative power, as highlighted by classification performances (Table 7).
Usage Notes
The networks presented here have been generated using the Met2Graph R package we developed (see the paragraph on “Code availability”). The model in SBML format is imported and read by the Met2Graph package through the function readSBMLmod from the sybilSBML46 package. Several checkpoints are included in the function to validate the model object before importing it, such as check of upper and lower bounds, GPR mapping, reactions’ ids, and presence of list of reactants and products. The code snippets of Listings 1–4 show Met2Graph functions and arguments used to obtain the different networks:
Listing 1 Metabolites-based_tissue networks.
Listing 2 Metabolites-based_PDGSMMs networks.
Listing 3 Enzymes-based_PDGSMMs networks.
Listing 4 Reactions-based_PDGSMMs networks.
There are several open-source network libraries that can be used to analyze and visualize the networks provided in GraphML format. Examples of network analysis and visualization software include NetworkX, igraph, Cytoscape, yEd and Gephi.
Code availability
The R package Met2Graph developed and used to generate the TumorMet datasets is publicly available at the Met2Graph Github repository (https://github.com/cds-group/Met2Graph). The package has a detailed tutorial to generate the networks. Met2Graph implements a flexible process flow to build graphs starting from a GSM and can be easily integrated with user-customized functions. It allows the creation of the three different types of graphs described, based on the selection of nodes, edges, and attributes: Metabolites-, Enzymes- and Reactions-based graphs. It allows integrating gene expression data into Metabolites-based graphs. It provides several options and parameters to customize the resulting graphs. To name a few: to create multiple or simplified edges (simplification is possible using three different methods), to remove recurring metabolites, to consider the double direction in case of reversible reactions, to generate graphs as directed or not, and to plot the networks. All the details and the different arguments are described in the package manual and “help” section of the related functions.
The code to compute the distribution based distance measures and to obtain the simplified networks is also available at the GraphDistances Github repository (https://github.com/cds-group/GraphDistances).
Change history
21 October 2022
A Correction to this paper has been published: https://doi.org/10.1038/s41597-022-01765-w
References
Jang, M., Kim, S. S. & Lee, J. Cancer cell metabolism: implications for therapeutic targets. Exp. & molecular medicine 45, e45–e45 (2013).
Pavlova, N. N. & Thompson, C. B. The emerging hallmarks of cancer metabolism. Cell metabolism 23, 27–47 (2016).
Yizhak, K., Chaneton, B., Gottlieb, E. & Ruppin, E. Modeling cancer metabolism on a genome scale. Mol. systems biology 11, 817 (2015).
Granata, I., Manzo, M., Kusumastuti, A. & Guarracino, M. R. Learning from metabolic networks: Current trends and future directions for precision medicine. Curr. Medicinal Chem. 28, 6619–6653 (2021).
Lam, S. et al. Addressing the heterogeneity in liver diseases using biological networks. Briefings Bioinforma. 22, 1751–1766 (2021).
Buphamalai, P., Kokotovic, T., Nagy, V. & Menche, J. Network analysis reveals rare disease signatures across multiple levels of biological organization. Nat. communications 12, 1–15 (2021).
Wu, H.-Y., Nollenburg, M. & Viola, I. Graph models for biological pathway visualization: State of the art and future challenges https://doi.org/10.48550/ARXIV.2110.04808 (2021).
Wilkinson, M. D. et al. The fair guiding principles for scientific data management and stewardship. Sci. Data 3 (2016).
Gaudelet, T. et al. Utilizing graph machine learning within drug discovery and development. Briefings Bioinforma. 22 (2021).
Camacho, D. M., Collins, K. M., Powers, R. K., Costello, J. C. & Collins, J. J. Next-generation machine learning for biological networks. Cell 173, 1581–1592 (2018).
Liu, C. et al. Computational network biology: Data, models, and applications. Phys. Reports 846, 1–66 (2020).Computational network biology: Data, models, and applications.
Huang, W. et al. A graph signal processing perspective on functional brain imaging. Proc. IEEE 106, 868–885 (2018).
Gu, L. et al. Semi-supervised learning in medical images through graph-embedded random forest. Front. Neuroinformatics 14 (2020).
Manipur, I., Giordano, M., Piccirillo, M., Parashuraman, S. & Maddalena, L. Community detection in protein-protein interaction networks and applications. IEEE/ACM Transactions on Comput. Biol. Bioinforma. 1–1, https://doi.org/10.1109/TCBB.2021.3138142 (2022).
Zitnik, M., Sosič, R., Maheshwari, S. & Leskovec, J. BioSNAP Datasets: Stanford biomedical network dataset collection, http://snap.stanford.edu/biodata (2018).
Hu, W. et al. Open graph benchmark: Datasets for machine learning on graphs. CoRR abs/2005.00687 (2020).
Shen, K. et al. A macaque connectome for large-scale network simulations in thevirtualbrain. Sci. data 6, 1–12 (2019).
Sugis, E. et al. HENA, heterogeneous network-based data set for Alzheimer’s disease. Sci. data 6, 1–18 (2019).
Ponce-de Leon, M., Apaolaza, I., Valencia, A. & Planes, F. J. On the inconsistent treatment of gene-protein-reaction rules in context-specific metabolic models. Bioinforma. 36, 1986 (2020).
Granata, I. et al. Supervised classification of metabolic networks. IEEE Int. Conf. on Bioinformatics and Biomedicine,BIBM 2018, Madrid, Spain, December 3-6 2018, 2688–2693 (2018).
Granata, I. et al. Model simplification for supervised classification of metabolic networks. Annals Math. Artif. Intell. 88, 91–104 (2020).
Manipur, I. et al. Netpro2vec: a graph embedding framework for biomedical applications. IEEE/ACM Transactions on Comput. Biol. Bioinforma. 19, 729–740 (2022).
Manzo, M., Giordano, M., Maddalena, L. & Guarracino, M. R. Performance evaluation of adversarial attacks on wholegraph embedding models. In Simos, D. E., Pardalos, P. M. & Kotsireas, I. S. (eds.) Learning and Intelligent Optimization 15th International Conference, LION 15, Athens, Greece, June 20-25, 2021, Revised Selected Papers, vol. 12931 of Lecture Notes in Computer Science, 219–236 (Springer, 2021).
Maddalena, L., Granata, I., Manipur, I., Manzo, M. & Guarracino, M. R. Glioma grade classification via omics imaging. In BIOIMAGING, 82–92 (2020).
Maddalena, L., Granata, I., Manipur, I., Manzo, M. & Guarracino, M. R. A framework based on metabolic networks and biomedical images data to discriminate glioma grades. In International Joint Conference on Biomedical Engineering Systems and Technologies, 165–189 (Springer, 2020).
Zhang, X., Acencio, M. L. & Lemke, N. Predicting essential genes and proteins based on machine learning and network topological features: a comprehensive review. Front. physiology 7, 75 (2016).
Nagai, J. S., Sousa, H., Aono, A. H., Lorena, A. C. & Kuroshu, R. M. Gene essentiality prediction using topological features from metabolic networks. In 2018 7th Brazilian Conference on Intelligent Systems (BRACIS), 91–96 (2018).
Mi, K. et al. Construction and analysis of human diseases and metabolites network. Front. Bioeng. Biotechnol. 8, 398 (2020).
Granata, I., Troiano, E., Sangiovanni, M. & Guarracino, M. R. Integration of transcriptomic data in a genome-scale metabolic model to investigate the link between obesity and breast cancer. BMC bioinformatics 20, 1–11 (2019).
Granata, I. et al. TumorMet. Figshare https://doi.org/10.6084/m9.figshare.c.5931130.v1 (2022).
Uhlen, M. et al. Tissue-based map of the human proteome. Sci. 347, 1260419 (2015).
Agren, R. et al. Reconstruction of genome-scale active metabolic networks for 69 human cell types and 16 cancer types using INIT. PLoS computational biology 8, e1002518 (2012).
Hucka, M. et al. The systems biology markup language (SBML): a medium for representation and exchange of biochemical network models. Bioinforma. 19, 524–531 (2003).
Ma, H. & Zeng, A.-P. Reconstruction of metabolic networks from genome data and analysis of their global structure for various organisms. Bioinforma. 19, 270–277 (2003).
Granata, I., Guarracino, M., Maddalena, L., Manipur, I. & Pardalos, P. On network similarities and their applications. In International Symposium on Mathematical and Computational Biology, 23–41 (Springer, 2019).
Granata, I., Guarracino, M. R., Maddalena, L. & Manipur, I. Network distances for weighted digraphs. In International Conference on Mathematical Optimization Theory and Operations Research, 389–408 (Springer, 2020).
Manipur, I., Granata, I., Maddalena, L. & Guarracino, M. R. Clustering analysis of tumor metabolic networks. BMC Bioinforma. 21, 1–14 (2020).
Endres, D. M. & Schindelin, J. E. A new metric for probability distributions. IEEE Transactions on Inf. Theory 49, 1858–1860 (2003).
Bastien, R. R. et al. Pam50 breast cancer subtyping by rt-qpcr and concordance with standard clinical molecular markers. BMC medical genomics 5, 1–12 (2012).
Lawrenson, K. et al. A study of high-grade serous ovarian cancer origins implicates the SOX18 transcription factor in tumor development. Cell Reports 29, 3726–3735.e4 (2019).
Narayanan, A. et al. graph2vec: Learning distributed representations of graphs. ArXiv abs/1707.05005 (2017).
Le, Q. & Mikolov, T. Distributed representations of sentences and documents. In International conference on machine learning, 1188–1196 (2014).
Chang, C.-C. & Lin, C.-J. Libsvm: A library for support vector machines. ACM Transactions on Intell. Syst. Technol.(TIST) 2, 1–27 (2011).
Pedregosa, F. et al. Scikit-learn: Machine learning in python. J. Mach. Learn. Res. 12, 2825–2830 (2011).
Ferrari, N. et al. Adaptive phenotype drives resistance to androgen deprivation therapy in prostate cancer. Cell Commun.Signal. 15, 1–14 (2017).
Gelius-Dietrich, G., Fritzemeier, C. J., Desouki, A. A. & Lercher, M. J. sybil – efficient constraint-based modelling in r.BMC Syst. Biol. 7, 125 (2013).
Acknowledgements
This work has been partially funded by the BiBiNet project (H35F21000430002) within POR-Lazio FESR 2014–2020 and co-funded by European Union PON “Ricerca e Innovazione 2014-2020” FSC - Project PON03PE_00060_5 MEDIA. It was carried out also within the activities of the authors as members of the INdAM Research group GNCS and the ICAR-CNR INdAM Research Unit. The work of Mario R. Guarracino was conducted within the framework of the Basic Research Program at the National Research University Higher School of Economics (HSE). The early stage investigator fellowship of Ichcha Manipur was supported by the INCIPIT program cofounded by Horizon 2020 - CO-FUND Marie Sklodowska Curie Actions.
Author information
Authors and Affiliations
Contributions
I.G. - conceptualization, data production, code writing, manuscript writing. I.M. - data analysis, manuscript writing. M.G. - data analysis, manuscript draft review. L.M. - supervision, manuscript draft review. M.R.G. - supervision, manuscript draft review.
Corresponding author
Ethics declarations
Competing interests
The authors declare no competing interests.
Additional information
Publisher’s note Springer Nature remains neutral with regard to jurisdictional claims in published maps and institutional affiliations.
Supplementary information
Rights and permissions
Open Access This article is licensed under a Creative Commons Attribution 4.0 International License, which permits use, sharing, adaptation, distribution and reproduction in any medium or format, as long as you give appropriate credit to the original author(s) and the source, provide a link to the Creative Commons license, and indicate if changes were made. The images or other third party material in this article are included in the article’s Creative Commons license, unless indicated otherwise in a credit line to the material. If material is not included in the article’s Creative Commons license and your intended use is not permitted by statutory regulation or exceeds the permitted use, you will need to obtain permission directly from the copyright holder. To view a copy of this license, visit http://creativecommons.org/licenses/by/4.0/.
About this article

Cite this article
Granata, I., Manipur, I., Giordano, M. et al. TumorMet: A repository of tumor metabolic networks derived from context-specific Genome-Scale Metabolic Models. Sci Data 9, 607 (2022). https://doi.org/10.1038/s41597-022-01702-x
Received:
Accepted:
Published:
DOI: https://doi.org/10.1038/s41597-022-01702-x
- Springer Nature Limited