
Abstract
Wide fluctuations in partial pressure of carbon dioxide (PaCO2) can potentially be associated with neurological and lung injury in neonates. Blood gas measurement is the gold standard for assessing gas exchange but is intermittent, invasive, and contributes to iatrogenic blood loss. Non-invasive carbon dioxide (CO2) monitoring has become ubiquitous in anesthesia and critical care and is being increasingly used in neonates. Two common methods of non-invasive CO2 monitoring are end-tidal and transcutaneous. A colorimetric CO2 detector (a modified end-tidal CO2 detector) is recommended by the International Liaison Committee on Resuscitation (ILCOR) and the American Academy of Pediatrics to confirm endotracheal tube placement. Continuous CO2 monitoring is helpful in trending PaCO2 in critically ill neonates on respiratory support and can potentially lead to early detection and minimization of fluctuations in PaCO2. This review includes a description of the various types of CO2 monitoring and their applications, benefits, and limitations in neonates.
Introduction
Arterial blood gas (ABG) measurement is the gold standard assessment of gas exchange. With the advent of pulse oximetry, continuous, non-invasive assessment of oxygenation is common practice and has been evaluated in multiple randomized controlled trials in preterm neonates [1, 2]. Non-invasive assessment of ventilation can be performed by end-tidal (EtCO2) or transcutaneous (TCOM) monitoring of carbon dioxide (CO2). Fluctuations in CO2 lead to changes in cerebral and pulmonary blood flow and are associated with brain injury [3, 4] and severe intraventricular hemorrhage (IVH) in preterm infants [5] highlighting the importance of continuous monitoring. This article gives a brief overview of the history, methods, benefits, and pitfalls of both types of non-invasive CO2 monitoring.
History of non-invasive carbon dioxide monitoring
The CO2 in exhaled gas is an indicator of changes in CO2 production in the tissues, delivery to the lungs by the circulatory system, and elimination by the lungs. The term “capnography” is used to describe continuous graphic recording (capnogram) of the CO2 concentration in respiratory gases [6] and can be plotted against time (time capnogram) or volume (volumetric capnogram) of gas. The instantaneous measurement and display of the CO2 concentration are referred to as capnometry. Its early use dates back to World War II when it was utilized to monitor CO2 concentrations inside submarines [7].
Capnography was first illustrated by John Scott Haldane in the early 20th century when he built a gas analyzer [8]. A sample of gas at constant temperature and pressure would pass through a series of absorbents, and the concentration of CO2 could be analyzed based on the reduction in the volume of gas. Photoacoustic detection of sound generated by the pressure change resulting from infrared (IR) light passing through a gas sample [9] and the effect of ultraviolet and visible light on the rotational and vibrational energy of molecules that absorb it [10, 11] was also used to determine the concentration of CO2. Many decades after the first described CO2 monitor [12], Holland was the first country to adopt non-invasive CO2 monitoring during anesthesia in the year 1978 [13, 14]. Shortly thereafter, it was introduced in the United States and became the gold standard in anesthesiology by the 1990s despite the lack of randomized controlled trials [15]. Since the advent of non-invasive CO2 monitoring for clinical use, several improvisations have resulted in smaller, simpler, and lower-cost versions of exhaled CO2 detectors/ monitors.
Severinghaus in 1960 reported monitoring of CO2 and O2 during anesthesia using various methods including blood gas sampling, EtCO2 monitoring, and “tissue” monitoring [16, 17]. Subsequently, he described transcutaneous monitoring by heating the skin to “arterialize” the sample [18,19,20]. The latest transcutaneous CO2 monitors are based on the same principles.
Physiology of carbon dioxide monitoring
Blood perfusing the pulmonary capillary bed is briefly exposed to the alveolar gas. During this short transit in healthy individuals, the PCO2 decreases from ~46 mmHg in the pulmonary arteriole to 40 mm Hg in the pulmonary venule by equilibrating with alveolar CO2 (PACO2) [21, 22]. There is a high alveolar-to-atmospheric (atm) PCO2 gradient of approximately 40 mmHg (PatmCO2 is 0.3 mm Hg since CO2 constitutes only 0.04% of the atmospheric air). Hence, PCO2 is recorded as 0–1 mmHg during inspiration in the time capnogram (phase 0, Fig. 1). The exhaled CO2 is measured by infrared spectroscopy (IR spectroscopy) as CO2 absorbs and emits IR light in a distinct wavelength (4.26 µm).

Phase I represents the gas from the anatomical and apparatus dead space and hence is CO2-free. Phase II has a rapid S-shaped upswing (mixing of alveolar gas with the dead space gas). Phase III or the alveolar plateau represents exhaled gas that is rich in CO2 from the alveoli. Variation in the ventilation/ perfusion (V/Q) status of the alveoli can result in phase III being an extension of phase II. Phase IV or beaking is noted with respiratory distress syndrome (RDS) due to collapse and exhalation of alveolar gas. The change in the waveform in RDS, bronchopulmonary dysplasia (BPD), and esophageal intubation are also shown. The capnogram in BPD shows an exaggerated PaCO2–EtCO2 gradient in BPD. PaCO2 arterial partial pressure of carbon dioxide. Copyright Satyan Lakshminrusimha.
The 4 phases noted in the CO2 tracing include the following (Fig. 1):
Phase I: During exhalation, gas from the dead space containing minimal CO2 is expired initially [23].
Phase II: Subsequently, there is a dramatic increase in the exhaled CO2 concentration (phase II), which then reaches a peak.
Phase III: The CO2 concentration ultimately plateaus when all the exhaled gas originates from the alveoli. The initial part of phase III is a plateau due to the constant amount of CO2 being emptied from the alveoli. The alveoli with lower ventilation/perfusion (V/Q) ratios and longer time constant (i.e., more time to blow out CO2) contribute to the latter part of phase III, causing a slight upward slope of the plateau phase (also called phase IV).
Phase IV: A terminal blip or upward slope (phase IV) may be observed at the end of phase III due to delayed emptying of the alveoli with a lesser quantity of exhaled air with higher CO2 concentration. Beaking of phase IV is more common in lungs with poor compliance as in respiratory distress syndrome (RDS) (Fig. 1) [24].
Substantial variation in the V/Q status of the alveoli can result in phase III being an extension of phase II (the slope of the plateau is increased and the α angle between phase II and III is altered from the usual angle of 100°) [24]. The maximum value of PCO2 at the end of the breath is known as EtCO2. The CO2 then quickly drops to zero at the end of phase III/IV, due to low levels of CO2 in the inspired gas. The difference between the PaCO2 and EtCO2 is a marker of physiological dead space, with a difference of 5 mm Hg due to the mixing of alveolar CO2 with the gas in the dead space without any CO2 [25]. This difference is increased in the presence of lung disease such as bronchopulmonary dysplasia (BPD) [26].
Types of non-invasive carbon dioxide monitoring
Physical method (waveform capnography)
Infrared (IR) spectrography evaluates the absorption of IR rays at a specific wavelength (4.26 µm) by CO2 [27]. Hence, the quantity of CO2 in respiratory gases can be measured by comparing the measured absorbance with that of a known standard and expressed as PCO2 in mmHg.
-
1.
Endotracheal/End tidal CO2 (EtCO2) monitoring: the capnograph sensor is connected to the endotracheal tube (ETT) and allows measurement and recording of EtCO2. These are further classified based on the location of the sensor (Table 1 and Fig. 2):
Table 1 Summary of the advantages and disadvantages of currently used methods of carbon dioxide monitoring in neonates. Fig. 2: Types of EtCO2 monitoring. 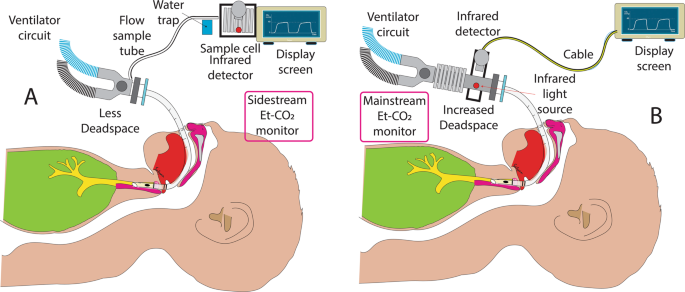
An illustration of sidestream (A) and mainstream (B) non-invasive CO2 monitoring. The difference in dead space and sampling method is shown. EtCO2 end-tidal carbon dioxide. Copyright Satyan Lakshminrusimha.

-
(a)
Main-stream sensor capnometer (Fig. 2): The adaptor housing the sensor is connected as an attachment in between the ETT and the ventilator circuit. Measurement of PCO2 is made rapidly across the airway and may underestimate the alveolar PCO2 since the device adds to dead space in the circuit and competes for tidal volume, resulting in lower values of EtCO2. They can be used in neonates on conventional ventilation, but not on those receiving non-invasive ventilation or high-frequency ventilation. A novel method of distal EtCO2 monitoring by a double-lumen ETT, as reported by Kugelman et al. had a good correlation with PaCO2 that remained agreeable in severe lung disease compared to mainstream CO2 monitoring [28].
-
(b)
Sidestream capnometer: The sensor is located in the main unit with a small pump that aspirates the patient’s gas sample through capillary tubing from the proximal part of the ETT. Respiratory gas is then transported from the sampling tube to the IR measuring device causing a 1–4 s delay in PCO2 measurement and display. Higher flow conventional sidestream capnography (150–200 ml/min) may cause underestimation of PCO2 due to lower tidal volumes and higher respiratory rates in neonates [29]. However, microstream/low flow technique (50 ml/min) with a dead space of less than 0.5 ml improves the accuracy of sidestream capnography [30,31,32]. Sidestream capnography can also be used in infants on non-invasive ventilation and high-frequency ventilation [33].
-
(2)
Transcutaneous CO2 monitor (TCOM, Fig. 3): TCOM uses the principle of arterialization of cutaneous capillaries by application of heat [16]. The sensor consists of a glass pH electrode, a silver chloride reference electrode, a heating element, a temperature element, and an electrolyte reservoir. When the sensor (with a membrane covering the electrodes) is applied to the skin, heat is generated that causes vasodilation of cutaneous capillaries and increases the permeability of the skin to CO2. CO2 that diffuses through the membrane reacts with water to form carbonic acid, which then dissociates into hydrogen and bicarbonate ions. This results in a change in pH that causes a potential difference between the two electrodes. Based on the linear relationship between pH and Log PCO2, the PCO2 measurement (TcPCO2) is obtained and is continuously recorded. The final recording corresponds to the PCO2 in the cutaneous capillaries which has been shown to correlate well with PaCO2 (between 20 and 74 mmHg), under stable hemodynamic conditions [34].
Fig. 3: Trancutaneous CO2 monitoring. 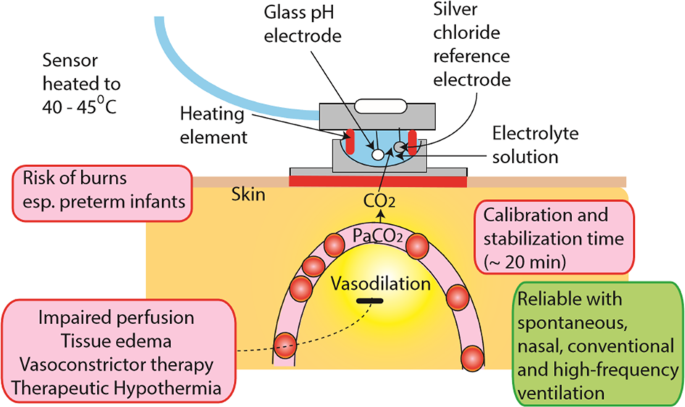
The structure, advantages (green box), and disadvantages (red boxes) of transcutaneous CO2 (TcPCO2) monitoring in neonates. Copyright Satyan Lakshminrusimha.

The immature and thin epidermal layer in premature infants is advantageous for TcPCO2 monitoring. Improved short-term respiratory outcomes were reported with TcPCO2 monitoring during transport and during high-frequency oscillatory ventilation [35, 36]. Neonatal studies have shown that TcPCO2 correlates better with PaCO2 compared to EtCO2 [37,38,39]. TcPCO2 readings have been noted to be higher than PaCO2 at higher temperatures owing to two proposed mechanisms: (a) higher solubility of CO2 at higher temperatures (TcPCO2 4.5% more than PaCO2) [40], and (b) additional CO2 being produced from metabolism by the skin cells, and tissue diffusion. Preliminary studies during therapeutic hypothermia indicate that TcPCO2 correlates well with PaCO2 [41].
Relative heating power (RHP, expressed in milliwatts or mW) is the power required to maintain the TcPCO2 sensor at the set temperature [42]. A well-perfused baby will require a higher RHP than a poorly perfused baby to keep the sensor temperature stable in order to provide an accurate estimate of the PaCO2. In critically ill infants, the trend in RHP may be an indicator of the local blood flow. RHP may have potential application in an infant with ductal dependent systemic circulation (such as coarctation of the aorta or hypoplastic left heart syndrome). Any deviations from the RHP-reference that is stored in the system will be displayed as positive or negative RHP values (considering 0 mW as the stored reference). Hence, interpreting TcPCO2 along with the RHP (or local skin perfusion) is prudent.
Chemical method (colorimetric CO2 detector)
The principle underlying the effectiveness of the colorimetric CO2 detector (CCDD) is the prevalence of low concentration of CO2 in atmospheric air in the esophagus (0.03–0.04%) and high concentration of CO2 in exhaled gas (4–5%) [43, 44]. A pH-sensitive chemical indicator contained in a plastic apparatus is connected to the gas stream in between the ETT and the ventilator or source of positive pressure ventilation (PPV). Commercially available CCDD at present includes the Pedi-Cap® (Nellcor/Medtronic, Minneapolis MN) and Neo-StatCO2® (Mercury Medical, Clearwater FL). These semi-quantitative single-use devices display a purple/blue color when CO2 is low (0.03% to <0.5%) and turn yellow when the concentration approaches 5% [45]. The color changes with inspiration and expiration and from breath to breath, varying based on the CO2 concentration. Although the Pedi-Cap® is not recommended for infants less than 1000 g, it is widely used to confirm ETT placement in neonates and in-vitro testing showed that it is effective at tidal volumes as small as ~1 ml [46,47,48,49]. The NeostatCO2® device is suitable for infants 0.25–6 kg as per the manufacturer.
Detecting exhaled CO2 with a CCDD along with a chest radiograph can confirm ETT placement in the respiratory tree; the CCDD is often instantaneously helpful in confirming placement in the delivery room (Fig. 4) [50]. A recent Cochrane review has shown insufficient evidence on the most effective technique to ascertain ETT placement in the delivery room or in the NICU and concluded that randomized trials are needed [51]. CCDD is a valuable adjunct to confirm ETT placement since an anteroposterior chest radiograph may miss esophageal intubation (Fig. 5).

Of all these markers, colorimetric CO2 detection and chest radiograph (X-ray) are helpful in confirming appropriate ETT placement. SpO2: oxygen saturation. Copyright Satyan Lakshminrusimha.

While chest radiograph is considered confirmatory, an antero-posterior (AP) view can be deceiving (A) and a cross-table view might be more accurate in diagnosing esophageal intubation (B). Combining an AP view with capnography may be more reliable. Copyright Satyan Lakshminrusimha.
Application in clinical practice in adults
After non-invasive CO2 monitoring became a standard of care during anesthesia, lawsuits born out of esophageal intubations and unexpected adverse events decreased and the premium to be paid by the anesthesiologists reduced drastically [24]. Widespread implementation of non-invasive CO2 monitoring resulted in undetected esophageal intubation becoming a “never event” in the United Kingdom [52]. A prospective study from Europe showed a 66-fold higher chance of having an airway catastrophe in ICU when non-invasive CO2 monitoring was not used [53]. Non-invasive CO2 monitoring is currently used during procedural sedation, cardiopulmonary resuscitation, in the intensive care unit, during transportation on ventilators, in post-operative care, and in the emergency room. The American Heart Association (AHA) recommends the use of quantitative waveform capnography as a physiological feedback device to monitor the effectiveness of chest compressions (CC) and to detect the return of spontaneous circulation (ROSC, rapid rise in EtCO2 to 35–45 mmHg) [54]. Sanders et al., have shown that EtCO2 positively correlates with coronary perfusion pressure [55]. A prospective matched cohort study on adult in-hospital cardiac arrest (from AHA’s Get With The Guidelines-Resuscitation registry) reported a higher likelihood of ROSC when EtCO2 and diastolic blood pressure were monitored [56].
Application in neonates
In normal healthy newborns, the PaCO2 is within the range of 35–45 mm Hg. Cerebral blood flow increases with hypercarbia and decreases with hypocarbia [57,58,59]. Both hypercarbia (17–30%) and hypocarbia (2.8–4%) are observed commonly among NICU patients [60, 61]. Continuous CO2 monitoring could potentially decrease adverse outcomes in infants especially vulnerable to fluctuations in cerebral blood flow, such as preterm infants at risk for severe IVH, periventricular leukomalacia (PVL), and BPD, and infants with HIE [59, 62,63,64,65,66]. Managing the ventilator settings and choosing appropriate strategies to ventilate are often gleaned from continuous CO2 monitoring in addition to bedside clinical evaluation. Intermittent assessments with blood gases come with the risk for periods of abnormally high or low PaCO2 remaining unrecognized and corrective action being delayed.
-
(1)
Use in delivery room during resuscitation.
-
(a)
Mask ventilation: the CCDD serves as a simple tool with immediate feedback to qualify airway patency during mask ventilation in neonates [67,68,69]. In a single-center retrospective review of video recordings of face mask ventilation with a CCDD, CO2 detection with CCDD preceded the rise in heart rate [45]. Clinical observational research in the use of CCDD during PPV with a facemask has advocated their use. Leone et al. described the benefits of CCDD when used with a facemask during PPV in the NICU [46]. In this study, during twenty-one instances of lack of color change on the CO2 detector, twenty displayed a color change once the head/ jaw position was adjusted therefore allowing for easier determination of airway patency [46]. Similarly, van Os et al., showed that a CCDD enables a recognition of airway obstruction in very low birth weight infants during PPV [70]. A literature review by O’Reilly et al. elucidated that facemask leak and obstructions are more often than not unrecognized without the use of CCDD or respiratory function monitors (RM) [71]. However, the use of CCDD during PPV with a facemask has not been advocated in the International Liaison Committee on Resuscitation (ILCOR) guidelines [72] as there is limited data to support their use—therefore it is not routinely used in clinical settings. The overall recommendation for use of CCDD during facemask PPV has been labeled as level C (limited data) [73].
-
(b)
ETT placement: the 2020 AHA and 2016 Neonatal resuscitation Program (NRP) guidelines recommend confirming ETT placement by CCDD or waveform capnography in intubated infants with a perfusing cardiac rhythm (Fig. 5) [74, 75]. CCDD is more accurate as well as quicker in confirming correct ETT placement when compared to clinical assessment [76, 77]. A retrospective analysis conducted by Roberts et al. found that time to recognition of esophageal placement using clinical indicators averaged 97.1 s compared to side-stream capnography (1.6 s) [78]. These findings corroborate the prospective study by Repetto et al. [79] comparing median time to CO2 detection (9 s) with clinical assessment alone (30 s). Hawkes et al. reviewed studies that evaluated the use of a CCDD in confirming ETT placement and assessed them according to the AHA levels of evidence and grades of recommendation [73]. One such study investigated the Pedi-Cap®’s accuracy in conjunction with respiratory monitoring (RM) on a sample of 35 intubations and found that in 31% (11/35) intubations the Pedi-Cap® failed to change color despite correct ETT placement [80]. Based on current evidence, the recommendation for the use of a CCDD in confirming ETT placement in neonates is level B (moderate-quality evidence). It is possible that CCDD may miss esophageal intubation (false positive) or have a false negative reading despite the appropriate placement of the ETT (Fig. 6) [81].
Fig. 6: Causes for persistent purple coloration of colorimetric CO2 detector in neonates. 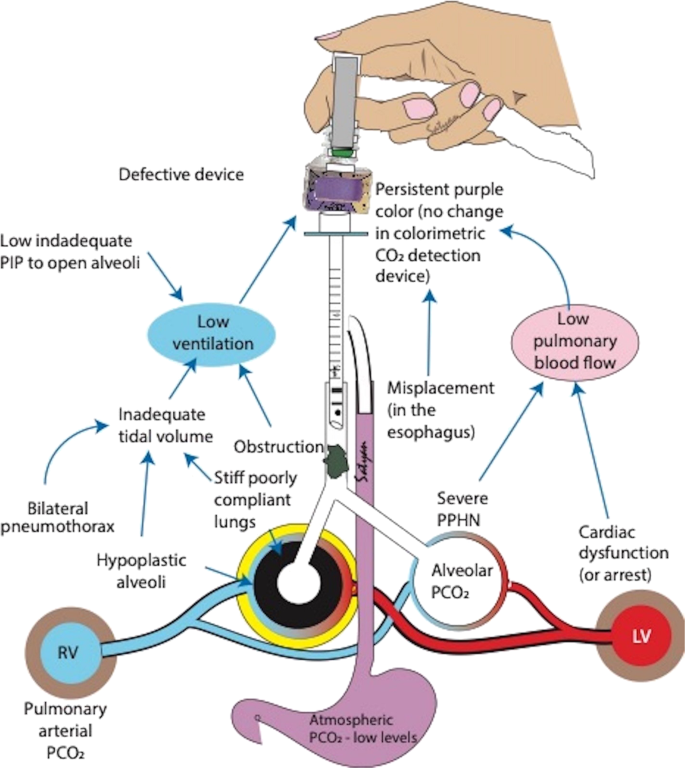
The most common reason is esophageal intubation. The other causes can be classified into inadequate ventilation and poor alveolar perfusion. PIP peak inflation pressure, PCO2 partial pressure of carbon dioxide. LV left ventricle, RV right ventricle. Copyright Satyan Lakshminrusimha.
-
(c)
Chest compressions (CC): Non-invasive CO2 monitoring as part of RM is of importance in adults during extensive resuscitation including CC to monitor the efficacy of the resuscitative interventions [82, 83], and similar use in neonates as a feedback device is promising. In an ovine model of asphyxial arrest, continuous EtCO2 monitoring predicted adequacy of CC and detection of ROSC [84]. Furthermore, in a large mammalian meconium aspiration model, continuous EtCO2 monitoring limited fluctuation in PaCO2 and cerebral blood flow during and after resuscitation [58]. The use of RM improved the effectiveness of newborn facemask ventilation training in a randomized trial with neonatal manikins [85]. Kong et al. performed a prospective randomized controlled trial comparing PPV adjusted based on clinical assessment alone (blinded to EtCO2) vs. PPV adjusted based on EtCO2 values [86]. Quantitative EtCO2 monitoring in the delivery room did not reduce the proportion of PCO2 levels outside of a prespecified range in neonates mostly supported with non-invasive ventilation [86]. Hawkes et al. performed EtCO2 monitoring in the delivery room for 39 infants born at 26 5/7 to 31 weeks gestation and did not find any difference between proportions of PCO2 values within the normocapnia range between infants with and without EtCO2 monitoring [87].

-
(2)
Non-invasive CO2 monitoring in the NICU.
-
(a)
Minimizing CO2 fluctuations: Continuous CO2 monitoring potentially enables us to detect expeditious changes in PaCO2 especially in the first few hours after birth with rapid changes in lung compliance. This allows appropriate and timely adjustments in the ventilator, potentially avoiding prolonged exposure to hypo or hypercapnia, and decrease the duration of invasive ventilation. By avoiding rapid fluctuations in PaCO2 (and hence cerebral blood flow), it may be protective against IVH, and improve long-term outcomes in extremely premature infants and infants with HIE (during and after therapeutic hypothermia) [59, 62,63,64,65,66]. Kugelman et al. performed a randomized multicenter study with EtCO2 visible to the medical team for continuous monitoring in the experimental group and masked in the control group [88]. They observed that IVH and PVL were lower in the monitored group and continuous EtCO2 monitoring improved the control of PaCO2 within a safe range during conventional ventilation in the NICU. A good correlation has been observed between EtCO2 and PaCO2 in ventilated newborns [89]. The discrepancy between EtCO2 and PaCO2 increases with the increasing severity of lung disease and improves after surfactant administration. Nangia et al. observed a significant correlation between EtCO2 and PaCO2 in preterm infants <32 weeks gestation [90]. In another study involving 27 neonates <28 weeks gestation, Aliwalas et al. found only moderate agreement in the first 24 h after birth [91]. A retrospective study in extremely low birth weight (ELBW) infants showed a good correlation between EtCO2 and PaCO2 [92]. To summarize, EtCO2 may be used as an adjunct to clinical assessment and PaCO2 from ABGs, with caution exercised while relying solely on EtCO2 from extremely preterm newborns (and those with severe lung disease) while making ventilatory adjustments. The ILCOR task force has removed the minimum weight of 20 kg for capnography and noted that continuous monitoring has become routine in many settings.
-
(b)
Minimize blood draws: The use of EtCO2 and TCOM can decrease the need for repeated blood gases and iatrogenic blood losses in critically ill or preterm newborns who are prone to anemia. Although not as accurate as blood gases, they are reliable tools in measuring and trending PCO2 in neonates [89, 93, 94]. CO2 monitoring may potentially minimize blood draws in stable infants on non-invasive ventilation as well.
-
(c)
Monitoring during transport: TcPCO2 has been shown to be more accurate when compared to EtCO2 for monitoring ventilated neonates during transport [95]. In infants with a perfusing cardiac rhythm, it may be beneficial to monitor EtCO2 either continuously or by frequent intermittent detection of exhaled CO2 during out-of-hospital, intra-, or inter-hospital transport [74].
-
(d)
Detect accidental extubation: Non-invasive CO2 monitoring allows the trending of CO2 among ill neonates in whom the baseline PaCO2 is well established. A sudden change in the waveform (flattening, Fig. 1) or the PCO2 value may suggest ETT displacement or obstruction, air leak, or an early sign of clinical worsening.
-
(e)
Diagnose hypoventilation: as an aid in the suspicion and diagnosis of central hypoventilation syndrome. Due to reduced respiratory drive (hypoventilation), the infant’s EtCO2 and TcPCO2 would climb abruptly to very high values [96].
-
(f)
Surgery (especially abdominal) and post-operative hypoventilation: during abdominal surgeries (such as emergency exploratory laparotomy for necrotizing enterocolitis, or elective gastroschisis repair), dramatic changes in intraabdominal, and hence intrathoracic pressure may cause a significant effect on ventilation. Prompt recognition by trending EtCO2 or TcPCO2 may allow for expedient ventilatory management. However, on comparing EtCO2 and PaCO2 from 23 prospectively enrolled infants (59 sample sets) during general anesthesia and surgery, mainstream capnography correlated poorly with PaCO2 [97]. Thus, EtCO2 should not be solely relied upon while making ventilatory changes during surgery. Nevertheless, non-invasive CO2 monitoring (especially TcPCO2) may be helpful in post-operative management to assess the recovery of respiratory drive and alveolar ventilation after anesthesia.
Limitations
There are several gaps that currently exist in our knowledge on neonatal non-invasive CO2 monitoring (Table 2). Some of the limitations of non-invasive CO2 monitoring are listed below.
-
(a)
Limitations of EtCO2 monitoring: Despite being a useful adjunct to confirm ETT placement, detection of PaCO2 by waveform capnography has been shown to miss esophageal intubation in 1 in 40 instances [98]. EtCO2 has been used successfully even in ELBW infants. However, wide variation in EtCO2 and poor correlation between EtCO2 and PaCO2 has been noted in critically ill preterm neonates. This is probably secondary to the V/Q mismatch in these newborns with more severe lung disease [31]. EtCO2 measurements are expected to be lower than the PaCO2 due to (i) intrapulmonary shunting with some of the arterial CO2 bypassing the ventilated alveolar units, (ii) CO2 being diluted in the conducting airways (anatomical dead space) that do not contribute to CO2 production and (iii) portions of the lung that are ventilated but not perfused (alveolar dead space, that is increased in worsening lung disease). Inaccurate measurements owing to leakage around uncuffed ETT are not uncommon. The mainstream EtCO2 monitor is bulky and adds to dead space, which may not be insignificant with the lower tidal volume being used to ventilate neonates. In addition, mainstream EtCO2 monitoring cannot be performed in infants on non-invasive ventilation or high-frequency ventilation. Sidestream capnography, on the other hand, may underestimate the PaCO2 due to low tidal volumes and rapid respiratory rates in newborns. High respiratory rates impede the formation of the alveolar plateau phase [99]. Furthermore, phase III of volumetric capnogram was steeper in infants with BPD, likely due to V/Q mismatch, leading to difficulty in differentiating phase II and III [100]. To overcome some of the limitations, sampling from a distal rather than a proximal site, minimizing the length of the tubing, and interpretation with caution for infants breathing at higher respiratory rates (>60 per minute) have been suggested [101]. In addition, distal EtCO2 measured through a double-lumen ETT had a good correlation with PaCO2 even in severe lung disease [28].
-
(b)
Limitations with CCDD (Fig. 6): There are several instances where a CCDD may be falsely negative (purple/blue), including low cardiac output, airway obstruction [48, 76, 77, 80, 102], suboptimal tidal volumes (threshold > 0.72 ml) [48, 49], incomplete exhalation, or an air leak (Fig. 4) [79]. When a fixed pressure is used during PPV, the delivered tidal volume is dependent on the infant’s weight, presence of spontaneous breaths (and whether they are synchronized), compliance of the lungs and chest wall, airway resistance, and leak [48, 103]. Conversely, a CCDD may be falsely positive (yellow) with esophageal intubation when expired CO2 has been forced into the stomach during prior mask ventilation, or during contamination of the colorimetric paper by gastric acid or epinephrine [104]. Bilateral pulmonary hypoplasia (usually due to prolonged oligohydramnios) can potentially limit the volume of exhaled CO2 leading to false-negative CCDD. Therefore, CCDD readings may be misleading and it is crucial that they are interpreted in conjunction with clinical signs.
-
(c)
Limitations with TCOM: There have been reports of poor correlation with variation in TcPCO2 in preterm and ill neonates [91, 105]. The device should be calibrated using known gas mixtures or the neonate’s blood sample and should be corrected for the infant’s temperature. The position of sensors should be changed every 4–12 h, depending on the operating temperature of the electrode and the condition of the infant’s skin, per the manufacturer’s instructions. The TcPCO2 recording may be inaccurate in the setting of improper placement, entrapped air bubbles, error in the equipment, or in calibration. In order to minimize burns secondary to the high electrode temperature in TCOM, lower electrode temperatures (38–39 °C) have been successfully used with good accuracy after applying a bias correction of 12–15% [106, 107]. However, the main advantages of TCOM are (a) it minimizes the need for repeated blood sampling, (b) allows for trending PCO2 over a period of time, (c) can be used with any type of ventilator and also in non-ventilated patients, and (d) can be reliably used during transport of ventilated newborns [95].
Conclusions
In neonates, waveform capnography is widely applied in the NICU for monitoring of ventilated and critically ill term and preterm infants. In addition, both EtCO2 and TcPCO2 provide valuable input in managing infants during the transport of ventilated infants. The use of CCDD has become a standard in the delivery room, as an adjunct to clinical assessment, to ascertain ETT placement prior to confirmation by chest radiograph. Attempts at bridging the existing gaps in our knowledge with regard to neonatal non-invasive CO2 monitoring can pave the way for its optimal utility in the management of critically ill newborn infants. Furthermore, accurate interpretation of these non-invasive measurements along with astute clinical assessments can expedite evaluation and diagnosis, and lead to swift stabilization and improved outcomes in neonates.
Change history
14 September 2021
A Correction to this paper has been published: https://doi.org/10.1038/s41372-021-01177-5
References
Askie LM, Darlow BA, Finer N, Schmidt B, Stenson B, Tarnow-Mordi W, et al. Association between oxygen saturation targeting and death or disability in extremely preterm infants in the neonatal oxygenation prospective meta-analysis collaboration. J Am Med Assoc. 2018;319:2190–201. https://doi.org/10.1001/jama.2018.5725
Manja V, Saugstad OD, Lakshminrusimha S. Oxygen saturation targets in preterm infants and outcomes at 18–24 months: a systematic review. Pediatrics. 2017;139 https://doi.org/10.1542/peds.2016-1609.
Travers CP, Carlo WA. Carbon dioxide and brain injury in preterm infants. J Perinatol. 2021;41:183–4. https://doi.org/10.1038/s41372-020-00842-5
Hoffman SB, Lakhani A, Viscardi RM. The association between carbon dioxide, cerebral blood flow, and autoregulation in the premature infant. J Perinatology. 2021;41:324–9. https://doi.org/10.1038/s41372-020-00835-4
Fabres J, Carlo WA, Phillips V, Howard G, Ambalavanan N. Both extremes of arterial carbon dioxide pressure and the magnitude of fluctuations in arterial carbon dioxide pressure are associated with severe intraventricular hemorrhage in preterm infants. Pediatrics. 2007;119:299–305. https://doi.org/10.1542/peds.2006-2434
Bhavani-Shankar K, Moseley H, Kumar AY, Delph Y. Capnometry and anaesthesia. Can J Anaesth. 1992;39:617–32. https://doi.org/10.1007/bf03008330
Smalhout B. The first years of clinical capnography. 430–56, https://doi.org/10.1017/CBO9780511933837.042 (2011).
Haldane J, Graham JI. Methods of gas analysis. Haldane method of gas analysis. London: Charles Griffin and Company, Ltd.; 1912.
Kreuzer LB. Ultralow gas concentration infrared absorption spectroscopy. J Appl Phys. 1971;42:2934–43. https://doi.org/10.1063/1.1660651
Raman CV, Krishnan KS. A new type of secondary radiation. Nature. 1928;121:501–2. https://doi.org/10.1038/121501c0
Van Wagenen RA, Westenskow DR, Benner RE, Gregonis DE, Coleman DL. Dedicated monitoring of anesthetic and respiratory gases By Raman scattering. J Clin Monit. 1986;2:215–22. https://doi.org/10.1007/BF02851168
Luft K. Über eine neue methode der registrierenden gasanalyse mit hilfe der absorption ultraroter strahlen ohne spektrale zerlegung. Z Tech Phys. 1943;24:97–104.
Kalenda Z. The capnogram as a guide to the efficacy of cardiac massage. Resuscitation. 1978;6:259–63. https://doi.org/10.1016/0300-9572(78)90006-0
Kalenda, Z. Mastering infra-red capnography. Kerckebosch BV; 1989.
J.H, E. ASA adopts basic monitoring standards. APSF Newsletter https://www.apsf.org/article/asa-adopts-basic-monitoring-standards; 1987.
Severinghaus JW. Methods of measurement of blood and gas carbon dioxide during anesthesia. Anesthesiology. 1960;21:717–26. https://doi.org/10.1097/00000542-196011000-00014
Severinghaus J. Carbon dioxide tension and perfusion in the tissue. Der Anaesthesist. 1960;9:50–55.
Hazinski TA, Severinghaus JW. Transcutaneous analysis of arterial PCO2. Med Instrum. 1982;16:150–3.
Severinghaus JW. A combined transcutaneous PO2-PCO2 electrode with electrochemical HCO3- stabilization. J Appl Physiol. 1981;51:1027–32. https://doi.org/10.1152/jappl.1981.51.4.1027
Severinghaus JW, Bradley AF, Stafford MJ. Transcutaneous PCO2 electrode design with internal silver heat path. Birth Defects Orig Artic Ser. 1979;15:265–70.
Powers KA & Dhamoon AS. StatPearls. StatPearls Publishing Copyright © 2020, StatPearls Publishing LLC.; 2020.
Geers C, Gros G. Carbon dioxide transport and carbonic anhydrase in blood and muscle. Physiol Rev. 2000;80:681–715. https://doi.org/10.1152/physrev.2000.80.2.681
Bhavani-Shankar K, Philip JH. Defining segments and phases of a time capnogram. Anesthesia Analgesia. 2000;91:973–7.
Kodali BhavaniS. Capnography outside the operating rooms. Anesthesiology. 2013;118:192–201. https://doi.org/10.1097/ALN.0b013e318278c8b6
Sullivan KJ, Kissoon N, Goodwin SR. End-tidal carbon dioxide monitoring in pediatric emergencies. Pediatr Emerg Care. 2005;21:327–32. https://doi.org/10.1097/01.pec.0000159064.24820.bd
Lopez E, Mathlouthi J, Lescure S, Krauss B, Jarreau PH, Moriette G. Capnography in spontaneously breathing preterm infants with bronchopulmonary dysplasia. Pediatr Pulmonol. 2011;46:896–902. https://doi.org/10.1002/ppul.21445
Kodali, BS, Capnogram, T, Phase, I & Screen, CM. Bhavani Shankar Kodali; Capnography Outside the Operating Rooms. Anesthesiology. 2013;118:192–201. https://doi.org/10.1097/ALN.0b013e318278c8b6
Kugelman A, Zeiger-Aginsky D, Bader D, Shoris I, Riskin A. A novel method of distal end-tidal CO2 capnography in intubated infants: comparison with arterial CO2 and with proximal mainstream end-tidal CO2. Pediatrics. 2008;122:e1219–1224. https://doi.org/10.1542/peds.2008-1300
Proquitté H, Krause S, Rüdiger M, Wauer RR, Schmalisch G. Current limitations of volumetric capnography in surfactant-depleted small lungs. Pediatr Crit Care Med. 2004;5:75–80. https://doi.org/10.1097/01.Pcc.0000102384.60676.E5
Hagerty JJ, Kleinman ME, Zurakowski D, Lyons AC, Krauss B. Accuracy of a new low-flow sidestream capnography technology in newborns: a pilot study. J Perinatol. 2002;22:219–25. https://doi.org/10.1038/sj.jp.7210672
Williams E, Dassios T, Greenough A. Assessment of sidestream end-tidal capnography in ventilated infants on the neonatal unit. Pediatr Pulmonol. 2020;55:1468–73. https://doi.org/10.1002/ppul.24738
Duyu M, Bektas AD, Karakaya Z, Bahar M, Gunalp A, Caglar YM, et al. Comparing the novel microstream and the traditional mainstream method of end-tidal CO2 monitoring with respect to PaCO2 as gold standard in intubated critically ill children. Sci Rep. 2020;10:22042 https://doi.org/10.1038/s41598-020-79054-y
Kugelman A, Bromiker R, Riskin A, Shoris I, Ronen M, Qumqam N, et al. Diagnostic accuracy of capnography during high-frequency ventilation in neonatal intensive care units. Pediatr Pulmonol. 2016;51:510–6. https://doi.org/10.1002/ppul.23319
Johns RJ, Lindsay WJ, Shepard RH. A system for monitoring pulmonary ventilation. Biomed Sci Instrum. 1969;5:119–21.
O’Connor TA, Grueber R. Transcutaneous measurement of carbon dioxide tension during long-distance transport of neonates receiving mechanical ventilation. J Perinatol. 1998;18:189–92.
Berkenbosch JW, Tobias JD. Transcutaneous carbon dioxide monitoring during high-frequency oscillatory ventilation in infants and children. Crit Care Med. 2002;30:1024–7. https://doi.org/10.1097/00003246-200205000-00011
Hand IL, Shepard EK, Krauss AN, Auld PA. Discrepancies between transcutaneous and end-tidal carbon dioxide monitoring in the critically ill neonate with respiratory distress syndrome. Crit Care Med. 1989;17:556–9. https://doi.org/10.1097/00003246-198906000-00015
Geven WB, Nagler E, de Boo T, Lemmens W. Combined transcutaneous oxygen, carbon dioxide tensions and end-expired CO2 levels in severely ill newborns. Adv Exp Med Biol. 1987;220:115–20. https://doi.org/10.1007/978-1-4613-1927-6_21
Epstein MF, Cohen AR, Feldman HA, Raemer DB. Estimation of PaCO2 by two noninvasive methods in the critically ill newborn infant. J Pediatr. 1985;106:282–6. https://doi.org/10.1016/s0022-3476(85)80306-1
Eberhard P. The design, use, and results of transcutaneous carbon dioxide analysis: current and future directions. Anesthesia Analgesia. 2007;105:S48–S52. https://doi.org/10.1213/01.ane.0000278642.16117.f8
Garlapati P, Phan R, Lakshminrusimha S, Vali P. Accuracy of transcutaneous CO2 monitoring in newborns undergoing therapeutic hypothermia. J Investig Med. 128–129.
Technical manual Sentec. https://www.sentec.com/fileadmin/documents/Labeling/Technical_Manuals/HB-005752-t-SDM_Technical_Manual.pdf.
Siobal MS. Monitoring exhaled carbon dioxide. Respiratory Care. 2016;61:1397 https://doi.org/10.4187/respcare.04919
Kelly JS, Wilhoit RD, Brown RE, James R. Efficacy of the FEF colorimetric end-tidal carbon dioxide detector in children. Anesth Analg. 1992;75:45–50.
Blank D, Rich W, Leone T, Garey D, Finer N. Pedi-cap color change precedes a significant increase in heart rate during neonatal resuscitation. Resuscitation. 2014;85:1568–72.
Leone TA, Lange A, Rich W, Finer NN. Disposable colorimetric carbon dioxide detector use as an indicator of a patent airway during noninvasive mask ventilation. Pediatrics. 2006;118:e202–204. https://doi.org/10.1542/peds.2005-2493
O’Donnell CP, Kamlin CO, Davis PG, Morley CJ. Endotracheal intubation attempts during neonatal resuscitation: success rates, duration, and adverse effects. Pediatrics. 2006;117:e16–21. https://doi.org/10.1542/peds.2005-0901
Schmolzer GM, Kamlin OC, Dawson JA, te Pas AB, Morley CJ, Davis PG. Respiratory monitoring of neonatal resuscitation. Arch Dis Child Fetal Neonatal Ed. 2010;95:F295–303. https://doi.org/10.1136/adc.2009.165878
Garey DM, Ward R, Rich W, Heldt G, Leone T, Finer NN. Tidal volume threshold for colorimetric carbon dioxide detectors available for use in neonates. Pediatrics. 2008;121:e1524–1527. https://doi.org/10.1542/peds.2007-2708
Bennett NP. Carbon dioxide detector. https://www.mercurymed.com/wp-content/uploads/RDR_CarbonDioxideDetector.pdf.
Schmölzer GM, Roehr CCC. WITHDRAWN: techniques to ascertain correct endotracheal tube placement in neonates. Cochrane Database Syst Rev. 2018;7:CD010221–CD010221. https://doi.org/10.1002/14651858.CD010221.pub3
NHS. Improvement never events list 2018. https://nhsicorporatesite.blob.core.windows.net/green/uploads/documents/Never_Events_list_2018_FINAL_v5.pdf Accessed 23 Apr 2018).
Cook TM, Woodall N, Harper J, Benger J. Major complications of airway management in the UK: results of the fourth national audit project of the royal college of anaesthetists and the difficult airway society. Part 2: intensive care and emergency departments. Br J Anaesth. 2011;106:632–42. https://doi.org/10.1093/bja/aer059
Panchal AR, Bartos JA, Cabañas JG, Donnino MW, Drennan IR, Hirsch KG, et al. Part 3: adult basic and advanced life support: 2020 American Heart Association guidelines for cardiopulmonary resuscitation and emergency cardiovascular care. Circulation. 2020;142:S366–s468. https://doi.org/10.1161/cir.0000000000000916
Sanders AB, Atlas M, Ewy GA, Kern KB, Bragg S. Expired PCO2 as an index of coronary perfusion pressure. Am J Emerg Med. 1985;3:147–9.
Sutton RM, French B, Meaney PA, Topjian AA, Parshuram CS, Edelson DP, et al. Physiologic monitoring of CPR quality during adult cardiac arrest: a propensity-matched cohort study. Resuscitation. 2016;106:76–82. https://doi.org/10.1016/j.resuscitation.2016.06.018
Pryds O, Greisen G, Lou H, Friis-Hansen B. Vasoparalysis associated with brain damage in asphyxiated term infants. J Pediatr. 1990;117:119–25. https://doi.org/10.1016/s0022-3476(05)72459-8
Chandrasekharan PK, Rawat M, Nair J, Gugino SF, Koenigsknecht C, Swartz DD, et al. Continuous end-tidal carbon dioxide monitoring during resuscitation of asphyxiated term lambs. Neonatology. 2016;109:265–73. https://doi.org/10.1159/000443303
Leahy FA, Cates D, MacCallum M, Rigatto H. Effect of CO2 and 100% O2 on cerebral blood flow in preterm infants. J Appl Physiol Respir Environ Exerc Physiol. 1980;48:468–72. https://doi.org/10.1152/jappl.1980.48.3.468
van Kaam AH, De Jaegere AP, Rimensberger PC. Incidence of hypo- and hyper-capnia in a cross-sectional European cohort of ventilated newborn infants. Arch Dis Child Fetal Neonatal Ed. 2013;98:F323–326. https://doi.org/10.1136/archdischild-2012-302649
Kugelman A, Golan A, Riskin A, Shoris I, Ronen M, Qumqam N, et al. Impact of continuous capnography in ventilated neonates: a randomized, multicenter study. J Pediatr. 2016;168:56–61.e52. https://doi.org/10.1016/j.jpeds.2015.09.051
Kaiser JR, Gauss CH, Pont MM, Williams DK. Hypercapnia during the first 3 days of life is associated with severe intraventricular hemorrhage in very low birth weight infants. J Perinatol. 2006;26:279–85. https://doi.org/10.1038/sj.jp.7211492
Wiswell TE, Graziani LJ, Kornhauser MS, Stanley C, Merton DA, McKee L, et al. Effects of hypocarbia on the development of cystic periventricular leukomalacia in premature infants treated with high-frequency jet ventilation. Pediatrics. 1996;98:918–24.
Erickson SJ, Grauaug A, Gurrin L, Swaminathan M. Hypocarbia in the ventilated preterm infant and its effect on intraventricular haemorrhage and bronchopulmonary dysplasia. J Paediatr Child Health. 2002;38:560–2. https://doi.org/10.1046/j.1440-1754.2002.00041.x
Lingappan K, Kaiser JR, Srinivasan C, Gunn AJ. Relationship between PCO2 and unfavorable outcome in infants with moderate-to-severe hypoxic ischemic encephalopathy. Pediatr Res. 2016;80:204–8. https://doi.org/10.1038/pr.2016.62
Klinger G, Beyene J, Shah P, Perlman M. Do hyperoxaemia and hypocapnia add to the risk of brain injury after intrapartum asphyxia? Arch Dis Child Fetal Neonatal Ed. 2005;90:F49–52. https://doi.org/10.1136/adc.2003.048785
Leone TA, Lange A, Rich W, Finer NN. Disposable colorimetric carbon dioxide detector use as an indicator of a patent airway during noninvasive mask ventilation. Pediatrics. 2006;118:e202–e204.
Finer NN, Rich W, Wang C, Leone T. Airway obstruction during mask ventilation of very low birth weight infants during neonatal resuscitation. Pediatrics. 2009;123:865–9.
Schmölzer GM, Dawson JA, Kamlin COF, O’Donnell CP, Morley CJ, Davis PG. Airway obstruction and gas leak during mask ventilation of preterm infants in the delivery room. Arch Dis Child. 2011;96:F254–F257. https://doi.org/10.1136/adc.2010.191171
van Os S, Cheung PY, Pichler G, Aziz K, O’Reilly M, Schmolzer GM. Exhaled carbon dioxide can be used to guide respiratory support in the delivery room. Acta Paediatr. 2014;103:796–806. https://doi.org/10.1111/apa.12650
O’Reilly M, Cheung PY, Aziz K, Schmolzer GM. Short- and intermediate-term outcomes of preterm infants receiving positive pressure ventilation in the delivery room. Crit Care Res Pract. 2013;2013:715915 https://doi.org/10.1155/2013/715915
Perlman JM, Wyllie J, Kattwinkel J, Wyckoff MH, Aziz K, Guinsburg R, et al. Part 7: neonatal resuscitation: 2015 international consensus on cardiopulmonary resuscitation and emergency cardiovascular care science with treatment recommendations. Circulation. 2015;132:S204–241. https://doi.org/10.1161/CIR.0000000000000276
Hawkes GA, Kelleher J, Ryan CA, Dempsey EM. A review of carbon dioxide monitoring in preterm newborns in the delivery room. Resuscitation. 2014;85:1315–9. https://doi.org/10.1016/j.resuscitation.2014.07.012
Maconochie IK, Aickin R, Hazinski MF, Atkins DL, Bingham R, Couto TB, et al. Pediatric life support: 2020 international consensus on cardiopulmonary resuscitation and emergency cardiovascular care science with treatment recommendations. Circulation. 2020;142:S140–S184. https://doi.org/10.1161/CIR.0000000000000894
GM., W. Textbook of neonatal resuscitation, 7th edition.
Aziz HF, Martin JB, Moore JJ. The pediatric disposable end-tidal carbon dioxide detector role in endotracheal intubation in newborns. J Perinatol. 1999;19:110–3. https://doi.org/10.1038/sj.jp.7200136
Molloy EJ, Deakins K. Are carbon dioxide detectors useful in neonates? Arch Dis Child Fetal Neonatal Ed. 2006;91:F295–298. https://doi.org/10.1136/adc.2005.082008
Roberts WA, Maniscalco WM, Cohen AR, Litman RS, Chhibber A. The use of capnography for recognition of esophageal intubation in the neonatal intensive care unit. Pediatr Pulmonol. 1995;19:262–8. https://doi.org/10.1002/ppul.1950190504
Repetto JE, Donohue P-CP, Baker SF, Kelly L, Nogee LM. Use of capnography in the delivery room for assessment of endotracheal tube placement. J Perinatol. 2001;21:284–7. https://doi.org/10.1038/sj.jp.7210534
Schmolzer GM, Poulton DA, Dawson JA, Kamlin CO, Morley CJ, Davis PG. Assessment of flow waves and colorimetric CO2 detector for endotracheal tube placement during neonatal resuscitation. Resuscitation. 2011;82:307–12. https://doi.org/10.1016/j.resuscitation.2010.11.008
Jones HE, Kaltenbach K, Heil SH, Stine SM, Coyle MG, Arria AM, et al. Neonatal abstinence syndrome after methadone or buprenorphine exposure. N Engl J Med. 2010;363:2320–31. https://doi.org/10.1056/NEJMoa1005359
Falk JL, Rackow EC, Weil MH. End-tidal carbon dioxide concentration during cardiopulmonary resuscitation. N Engl J Med. 1988;318:607–11. https://doi.org/10.1056/nejm198803103181005
Merchant RM, Topjian AA, Panchal AR, Cheng A, Aziz K, Berg KM, et al. Part 1: executive summary: 2020 American heart association guidelines for cardiopulmonary resuscitation and emergency cardiovascular care. Circulation. 2020;142:S337–s357. https://doi.org/10.1161/cir.0000000000000918
Chandrasekharan P, Vali P, Rawat M, Mathew B, Gugino SF, Koenigsknecht C, et al. Continuous capnography monitoring during resuscitation in a transitional large mammalian model of asphyxial cardiac arrest. Pediatr Res. 2017;81:898–904. https://doi.org/10.1038/pr.2017.26
O’Currain E, Thio M, Dawson JA, Donath SM, Davis PG. Respiratory monitors to teach newborn facemask ventilation: a randomised trial. Arch Dis Child. 2019;104:F582 https://doi.org/10.1136/archdischild-2018-316118
Kong JY, Rich W, Finer NN, Leone TA. Quantitative end-tidal carbon dioxide monitoring in the delivery room: a randomized controlled trial. J Pediatr. 2013;163:104–.e101. https://doi.org/10.1016/j.jpeds.2012.12.016
Hawkes GA, Kenosi M, Finn D, O’Toole JM, O’Halloran KD, Boylan GB, et al. Delivery room end tidal CO2 monitoring in preterm infants <32 weeks. Arch Dis Child Fetal Neonatal Ed. 2016;101:F62–65. https://doi.org/10.1136/archdischild-2015-308315
Kugelman A, Golan A, Riskin A, Shoris I, Ronen M, Qumqam N, et al. Impact of continuous capnography in ventilated neonates: a randomized, multicenter study. J Pediatr. 2016;168:56–61. e52.
Bhat YR, Abhishek N. Mainstream end-tidal carbon dioxide monitoring in ventilated neonates. Singap Med J. 2008;49:199–203.
Nangia S, Saili A, Dutta AK. End tidal carbon dioxide monitoring-its reliability in neonates. Indian J Pediatr. 1997;64:389–94. https://doi.org/10.1007/bf02845211
Aliwalas LL, Noble L, Nesbitt K, Fallah S, Shah V, Shah PS. Agreement of carbon dioxide levels measured by arterial, transcutaneous and end tidal methods in preterm infants < or = 28 weeks gestation. J Perinatol. 2005;25:26–29. https://doi.org/10.1038/sj.jp.7211202
Amuchou Singh S, Singhal N. Dose end-tidal carbon dioxide measurement correlate with arterial carbon dioxide in extremely low birth weight infants in the first week of life? Indian Pediatr. 2006;43:20–25.
Rozycki HJ, Sysyn GD, Marshall MK, Malloy R, Wiswell TE. Mainstream end-tidal carbon dioxide monitoring in the neonatal intensive care unit. Pediatrics. 1998;101:648–53. https://doi.org/10.1542/peds.101.4.648
Lopez E, Grabar S, Barbier A, Krauss B, Jarreau PH, Moriette G. Detection of carbon dioxide thresholds using low-flow sidestream capnography in ventilated preterm infants. Intens Care Med. 2009;35:1942–9. https://doi.org/10.1007/s00134-009-1647-5
Tingay DG, Stewart MJ, Morley CJ. Monitoring of end tidal carbon dioxide and transcutaneous carbon dioxide during neonatal transport. Arch Dis Child. 2005;90:F523 https://doi.org/10.1136/adc.2004.064717
Paton JY, Swaminathan S, Sargent CW, Keens TG. Hypoxic and hypercapnic ventilatory responses in awake children with congenital central hypoventilation syndrome. Am Rev Respir Dis. 1989;140:368–72. https://doi.org/10.1164/ajrccm/140.2.368
Karlsson V, Sporre B, Hellström-Westas L, Ågren J. Poor performance of main-stream capnography in newborn infants during general anesthesia. Paediatr Anaesth. 2017;27:1235–40. https://doi.org/10.1111/pan.13266
Foy KE, Mew E, Cook TM, Bower J, Knight P, Dean S, et al. Paediatric intensive care and neonatal intensive care airway management in the United Kingdom: the PIC-NIC survey. Anaesthesia. 2018;73:1337–44. https://doi.org/10.1111/anae.14359
Proquitté H, Krause S, Rüdiger M, Wauer RR, Schmalisch G. Current limitations of volumetric capnography in surfactant-depleted small lungs. Pediatr Crit Care Med. 2004;5:75–80.
Fouzas S, Häcki C, Latzin P, Proietti E, Schulzke S, Frey U. et al. Volumetric capnography in infants with bronchopulmonary dysplasia. J Pediatr. 2014;164:283.e281–3. https://doi.org/10.1016/j.jpeds.2013.09.034.
Kirpalani H, Kechagias S, Lerman J. Technical and clinical aspects of capnography in neonates. J Med Eng Technol. 1991;15:154–61. https://doi.org/10.3109/03091909109023702
Schmolzer GM, O’Reilly M, Davis PG, Cheung PY, Roehr CC. Confirmation of correct tracheal tube placement in newborn infants. Resuscitation. 2013;84:731–7. https://doi.org/10.1016/j.resuscitation.2012.11.028
Suzuki K, Hooper SB, Cock ML, Harding R. Effect of lung hypoplasia on birth-related changes in the pulmonary circulation in sheep. Pediatr Res. 2005;57:530–6. https://doi.org/10.1203/01.PDR.0000155753.67450.01
Hughes SM, Blake BL, Woods SL, Lehmann CU. False-positive results on colorimetric carbon dioxide analysis in neonatal resuscitation: potential for serious patient harm. J Perinatol. 2007;27:800–1. https://doi.org/10.1038/sj.jp.7211831
Janaillac M, Labarinas S, Pfister RE, Karam O. Accuracy of transcutaneous carbon dioxide measurement in premature infants. Crit Care Res Pract. 2016;2016:8041967 https://doi.org/10.1155/2016/8041967
Sørensen LC, Brage-Andersen L, Greisen G. Effects of the transcutaneous electrode temperature on the accuracy of transcutaneous carbon dioxide tension. Scand J Clin Lab Investig. 2011;71:548–52. https://doi.org/10.3109/00365513.2011.590601
Jakubowicz JF, Bai S, Matlock DN, Jones ML, Hu Z, Proffitt B, et al. Effect of transcutaneous electrode temperature on accuracy and precision of carbon dioxide and oxygen measurements in the preterm infants. Respir Care. 2018;63:900–6. https://doi.org/10.4187/respcare.05887
Acknowledgements
The authors would like to thank the funding sources listed below.
Funding
UC Davis Children’s Miracle Network, UC Davis Child Health Research Grant and First Tech Federal Union, Canadian Pediatric Society-Neonatal Resuscitation Program Research Grant, National Institutes of Health (NIH)/National Heart Lung and Blood Institute (NHLBI) K12 HL138052, HD072929 and UL1TR001412, and Eunice Kennedy Shriver National Institute of Child Health and Human Development (NICHD).
Author information
Authors and Affiliations
Contributions
DS conceptualized, designed, drafted the initial manuscript, reviewed, and revised the manuscript. LZ, SI, PC, and SL contributed to the concept, reviewed, and revised the manuscript. All the authors have critically revised and approved the final version of the manuscript. All authors agree to be accountable for all aspects of the work.
Corresponding author
Ethics declarations
Financial disclosure
Dr. Sankaran is supported by UC Davis Children’s Miracle Network, UC Davis Child Health Research Grant and First Tech Federal Credit Union, and Neonatal Resuscitation Program Research Grant from the Canadian Pediatric Society. Dr. Chandrasekharan is supported by the National Institutes of Health (NIH)/National Heart Lung and Blood Institute (NHLBI) K12 HL138052 and Eunice Kennedy Shriver National Institute of Child Health and Human Development (NICHD) R03HD096510. Research reported in this publication was supported by the National Center for Advancing Translational Sciences of the National Institutes of Health under award number UL1TR001412 to the University at Buffalo. Dr. Lakshminrusimha is supported by NICHD (HD072929). The funding agencies did not have any role in the design or submission of this manuscript. This review article does not contain a discussion of an unapproved/investigative use of a commercial product/device.
Conflict of interest
The authors declare no competing interests.
Additional information
Publisher’s note Springer Nature remains neutral with regard to jurisdictional claims in published maps and institutional affiliations.
The original online version of this article was revised: Under the heading “Types of non-invasive carbon dioxide monitoring” and subheading “Physical method (waveform capnography)” there is a number mentioned as “0.43 µm" which is an error, and it should read as “4.3 µm.
Rights and permissions
About this article

Cite this article
Sankaran, D., Zeinali, L., Iqbal, S. et al. Non-invasive carbon dioxide monitoring in neonates: methods, benefits, and pitfalls. J Perinatol 41, 2580–2589 (2021). https://doi.org/10.1038/s41372-021-01134-2
Received:
Revised:
Accepted:
Published:
Issue Date:
DOI: https://doi.org/10.1038/s41372-021-01134-2
- Springer Nature America, Inc.