
Abstract
The article presents the process of creating a computational model for the stability analysis of a harbour wharf’s embankment with regards to its failure. The described elements that were taken into account at the stage of data preparation are: historical analysis of the structure (structural calculations, and the calculations of the stability of the embankment), results of the author’s own soil and material tests (concrete, steel), environmental conditions (atmospheric and water), the possible load systems that acted on the facility, and also the results from the 3D model of the wharf’s structure. On this basis, five computational schemes were prepared for computer simulations of the stability of the embankment in a plain state of deformations. Various stages and conditions of its operation were taken into account. In conclusion, a possible course of the process of destruction of the structure of the harbour wharf, and the river embankment that cooperates with it, was proposed.
1 Introduction
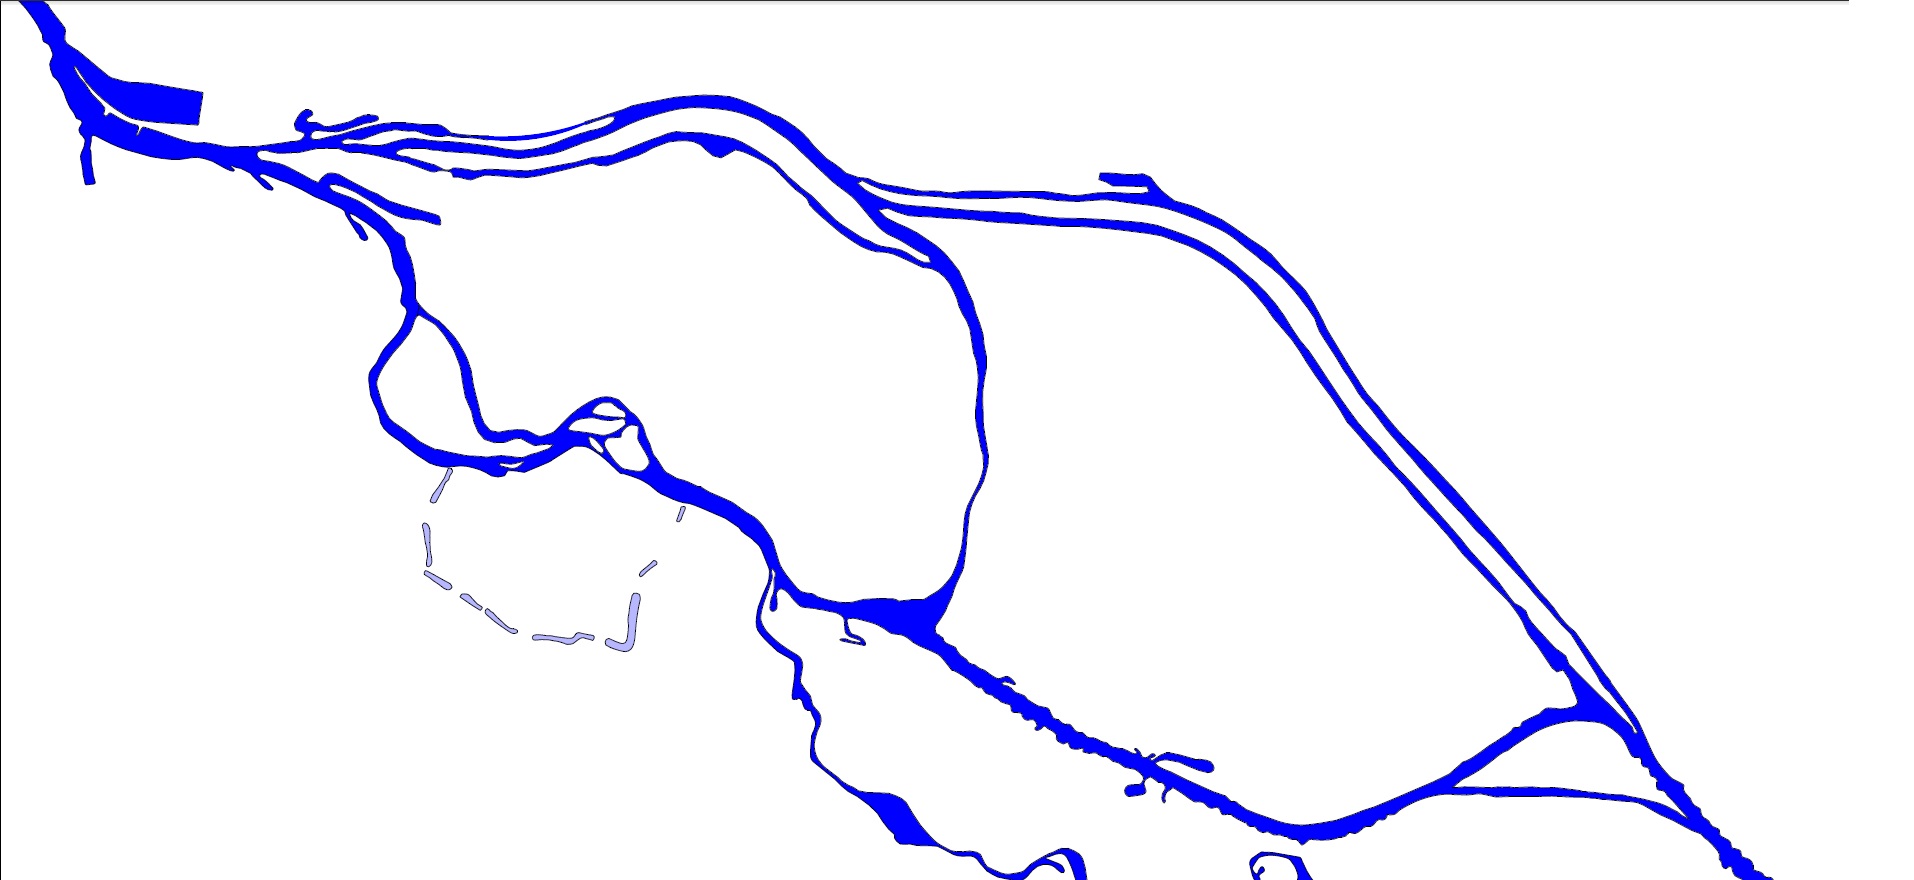
The water system of the Odra river in Wroclaw mainly consists of: the current river bed, the old Odra river bed, and the city, flood and navigation channels (Fig. 1).

Water system of the Odra River in Wroclaw with destroyed quay situation [https://www.wroclaw.pl/files/cmsdocuments/8742068/rzeka-format-ostateczny.jpg; 15.03.2021]
The river quays are therefore very diverse in terms of their geometrical and structural shape, which is related to their function. The following can be distinguished: canal quays in the form of unregulated river banks (Fig. 2), municipal recreational quays (Fig. 3), quays protected by stone (Fig. 4) or brick slopes, reinforced concrete harbour wharfs for mooring and reloading (Fig. 5)—currently not used.

Unregulated river bank

Revitalised city quay

Stone quay of the river

Archival photo of inland harbour wharf
In recent years, due to the very diversified and deteriorating technical condition of these quays [1, 2], the risk of flooding, and the current trends of including river quays in the life of a city [3,4,5,6,7], a number of renovation and revitalization works have been carried out. They aimed to ensure the safe operation of these quays within the city's tissue. However, some quays, especially those with an industrial and harbour function (Fig. 6), remained for a long time without any repairs (Fig. 7). This was an indirect cause of the serious failure of one of these quays (Figs. 6, 10).

General view of the considered RC river wharf

View of part of the RC river wharf
River quays are areas in which many unfavourable geological processes occur. Intensive depth and lateral erosion occurs in river beds, and in their vicinity there are often processes related to filtration deformations, such as suffosion and internal erosion [8]. Lateral erosion is one of the reasons why the regulation of river beds is necessary. Filtration deformations are associated with high values of runoff pressure occurring in the substrates of floodplains and fluvial terraces, especially in the case of extreme water levels in rivers.
There are many ways to prevent these undesirable phenomena. These include the use of plastics and geotextiles, or appropriately selected layers of non-cohesive soils, which limit the removal of fine soil particles (reverse filters). The technical strengthening of river banks (which is performed in the vicinity of water facilities and utility quays) includes: the strengthening of slopes with the use of cobblestones, mattresses, rip-raps or slabs, both concrete and stone; or the use of groats, gabions, palisades and tight concrete walls, e.g. in the technology of prefabricated reinforced concrete slabs (Figs. 2, 3, 4, 5). However, errors in execution, as well as the lack of appropriate maintenance may lead to the degradation of these protections and, consequently, to the failure of quay structures [9,10,11].
General issues concerning the stability of slopes are widely analysed due to the dangers related to their failures, especially landslides. Analytical methods are used, especially the analysis of two- and three-dimensional models with the use of the Finite Element Method [12,13,14,15,16,17,18]. The solutions to these problems concern excavation slopes, road and rail embankments, natural slopes, and river embankments [19,20,21,22,23].
For the Odra River (Fig. 1), flood conditions, which in this case have their specificity and typology, have a significant impact on the state of hazard to the river’s quays. This specificity and typology results from meteorological, climatic and hydrological conditions, as well as completed hydrotechnical facilities and regulatory works, which have shortened the course of the river from 1020 to 860 km [24].
The numerically modelled case of the loss of the stability of the slope, and the state of the structure’s failure (analysed from the construction point of view), concern the transhipment wharf of the Odra River from the beginning of the twentieth century [25, 26] (Figs. 6, 7).
2 Historical analysis and the description of the design of the analysed transhipment wharf
The considered reinforced embankment, which underwent failure at the same time as the quay, was a structural element of an old harbour wharf situated on the left bank of the southern branch of the Odra River in Wroclaw—directly below the left abutment of the Roman Dmowski Bridge (Fig. 6).
The construction of the embankments of the Odra River in Wroclaw began in the fifteenth century on the present South Odra River channel. In 1556, the first transhipment harbour was built on the southern shore of Kepa Mieszczanska, and was then expanded after 1668. As a result of the flood that destroyed Kepa Mieszczanska in 1736, the existing embankments were replaced with new ones. Their subsequent destruction was caused by a flood in 1907. According to the archival documentation, the new structure of the wharf was designed in 1912 (Figs. 8, 9).

Historical view of the considered RC wharf [photo: https://geoportal.wroclaw.pl/; 15.03.2021]

Archival design of the considered RC wharf and river slope [27]
It consisted of a series of reinforced concrete frames, which were spaced every 4.10 m and fastened at the top with a reinforced concrete slab and longitudinal joists from the river and wharf side. The reinforced concrete frames were additionally stabilised with steel anchors with a diameter of 40 mm, which were located at the level of the top of the beams that connect the piles. The frames’ columns were attached to high reinforced concrete horizontal beams, which were connected at the bottom at the level of a riverbank with a reinforced concrete band (located at the river side). The reinforced concrete beams were supported on two reinforced concrete piles with a diameter of approx. 40 cm—a vertical one that was situated on the river side, and a diagonal one that was situated on the wharf side. Prefabricated reinforced concrete planks, which were pounded into the bottom of the river, were attached to the reinforced concrete beam. They constituted a direct strengthening and protection of the Odra bed against the effects of water. Structurally, the quay was divided into six segments that were separated from each other. The first one consisted of 3 fields of 4.10 m each, the second one—two fields, and the third to sixth segment—10 fields. The upper surface of the wharf slab was approximately 3.3 m above the top of the lowest reinforced concrete beam.
A 45° slope was made under the wharf slab, which connected the lowest reinforced concrete beam with the edge of the slab (Fig. 9). At the edge of the slab, the slope became a horizontal embankment, which was a continuation of the wharf. From the side of the river bed, the slope was supported by the reinforced concrete beam of the retaining wall made of reinforced concrete planks. The slope was reinforced with octagonal concrete cubes, and a paved surface was made on the horizontal part of the embankment.
3 Synthesis of the technical condition of the wharf and the embankment of the river before and after the failure
As a result of the construction disaster, the reinforced concrete retaining structure with sheet piling, as well as the embankment of the Odra river with a length of 115.00 m (section of the washed out river bank at a distance of 253 + 750 km to 253 + 865 km), shifted towards the river by 3–4 m, and were practically completely destroyed (Figs. 10, 11).

General view of the destroyed RC wharf

View of the embankment part of the damaged RC wharf
It was also observed that the upper part of the wharf’s structure suffered significant displacements (10–14 cm) towards the river and along the shoreline, which was reflected in the displacements of the columns and the reinforcement of the columns and joists (Figs. 12, 13). At the time of the failure, two barges (47.00 m long and 8.60 m wide) were moored parallel to each other, and their impact could have contributed to the destruction of the wharf’s structure.

View of the damaged RC wharf structure

View of the damaged RC wharf structure
At the time of the wharf’s failure, sudden high water passed through Wroclaw due to heavy rainfall, causing a very fast flow of water in the river bed. Moreover, two empty barges, the lines of which were broken during the failure, were tied to the reinforced concrete pillars of the wharf.
As a result of the occurred situation, it was necessary to carry out a detailed material investigation, and also a structural and strength analysis of the facility (i.e. the structure of the wharf and the embankment) in order to create a model that would explain the causes of the disaster.
4 Methodology of the performed tests and the calculations of the wharf’s structure
The conducted and described field and laboratory tests, as well as the historical analysis of the facility, formed the basis for building a computational model of the reinforced concrete structure of the wharf in order to simulate the process of its destruction. This was then followed by the creation of numerical models of the behaviour of the embankment in order to determine possible variants of its loss of stability (Chapter 5).
4.1 Geotechnical investigations of the soil in the embankment
Due to the fact that part of the disaster area was covered by the rubble of fragments of the destroyed structure, and part was paved with small-size concrete elements, the soil condition tests were carried out in the two available places (Fig. 14). The conducted tests (Fig. 15) showed that under the layer of the loose embankment (approximately 2 m) there are fine medium-compacted sands, the degree of compaction of which ranges from 0.46 to 0.59 (Table 1). During the geotechnical investigations, the depth of the riverbed was also probed in three places located near the reinforced concrete planks. As a result of the research, it was found that the bottom of the river bed is located at a level of approx. 4.5 m below the embankment’s reinforced concrete beam, which connects the reinforced concrete planks.

Location of geotechnical survey points [photo: https://geoportal.wroclaw.pl/; 15.03.2021]

DPL dynamic probing
4.2 Geodetic measurements of the displacement of the wharf
After the wharf’s failure, geodetic measurements were conducted in order to determine the value of the displacements of the entire wharf towards the riverbed. The measurements showed that the reinforced concrete wharf and embankment were washed down towards the river by 3–4 m.
4.3 Material identification of the construction elements of the wharf
Concrete blocks and 8 reinforcing bars were taken from the quay structure (Figs. 16, 17). Cylindrical samples were cut from the blocks, and were then destroyed in a testing machine, while the bars were cleaned and torn off.

Concrete probes taken

Concrete probes prepared for testing
The tests were performed in an accredited research laboratory. The analysis of the concrete and reinforcing steel allowed the concrete of the wharf’s structure to be classified as C12/15 class, and the yield point of the reinforcing steel to be determined to be equal to 210 Mpa (Figs. 18, 19).

Steel rebar probes after testing

Steel rebar testing results
4.4 Determination of the forces acting on the barges’ lines during the failure
Estimation of the forces that acted on the mooring lines of the barges, and which were therefore transferred by them to the wharf, was presented in detail in study [28]. The general modelling schemes of these loads are presented below after being reviewed and adopted to the presnted particular failure case by the authors of this article. The loads were then used in the static and strength analysis of the three-dimensional wharf model (Chapter 4.5).
On the basis of monitoring, the speed of the river at the accident site on the day of the incident was determined to be about 1 m/s, and on the basis of meteorological data, the wind speed was about 9 m/s (Fig. 20). Data concerning the technical parameters of the barges’ mooring at the wharf were obtained from the Polish Register of Shipping S.A. Based on the assumed initial parameters, the forces that could occur in the mooring lines of the barges at the wharf were calculated. In the calculations, a case concerning the hydrodynamic pressure of the pressing river water was analysed.

Location of the barges anchored at the wharf [photo: https://geoportal.wroclaw.pl/; 15.03.2021]
4.4.1 The force acting on the stern of the barges caused by the hydrodynamic pressure
Due to the mooring of the barges in the open channel, in which the water speed was approx. 1 m/s, the longitudinal force acting on the stern of a barge can be defined using the following formula [28,29,30]:
where is the Rcx is the force acting on the sterns of the barges, which is reduced to the viscosity resistance [kgm/s2], cF is the drag coefficient—1.0 (–), r is the water density—1000 (kg/m3), u is the speed of the water current—1 (m/s), W is the wetted area of the hull (m2).
The immersion depth of the hull was assumed to be 1.0 m, while the width of one barge was 8.6 m. The wetted area of the hull was different depending on the location of the barges in relation to the watercourse (Figs. 21, 22, 23). It is a functional variable that depends on the angle of rotation of the barges in relation to the main stream of the river. The shape of the body on which the pressure is generated determines the size of the drag coefficient cF. In the case of a plate-shaped body, which is formed by the stern walls of barges, the drag coefficient cF during the flow of the liquid around it is 1.0 [31].

Forces acting on the sterns and sides of the barges before rotation [photo: https://geoportal.wroclaw.pl/; 15.03.2021]

Forces acting on the sterns and sides of the barges after rotation [photo: https://geoportal.wroclaw.pl/; 15.03.2021]

Definition of the angles of rotation for the barges [photo: https://geoportal.wroclaw.pl/; 15.03.2021]
4.4.2 The force acting on the sides of the barges due to hydrodynamic pressure
In the analysis of determining the forces acting on the barges, it was assumed that before and during the rotation of the barges, a force from the watercourse current also occurred on the side walls of the barges’ hulls (Figs. 21, 22, 23). In the case of the transverse position of the barges in relation to the current, the resistance force is described by the following formula [28,29,30]:
where, Rcy is the force acting on the sterns of the barges, which is reduced to the viscosity resistance [kgm/s2], cD is the drag coefficient—1 (–), r is the water density—1000 (kg/m3), u is the speed of the water current in the river—1 (m/s), L is the barge length—47.05 (m), T is the average immersion of the barge—1.0 (m).
However, as in the previous case, for the wetted hull surface W, the product of the L·T value, which also gives the wetted (longitudinal) surface, will be a variable value. It is a parameter that is dependent on the angle formed by the barge’s axis and the axis of the watercourse.
The total forces acting on the moored barges were determined using a functional relationship, in which the constants are the geometric parameters and the hydrodynamic conditions listed above, and the variable value is the angle between the main longitudinal axis of the barges and the axis of the watercourse’s mainstream (Fig. 23) [28,29,30]. This angle determines the total area (transverse and longitudinal) of the barges’ hulls, which is subjected to the force of the watercourse in the open channel. Due to the lack of precise information, the range of the defined angle was assumed from − 15° to 75°.
4.5 3D numerical analysis of the wharf’s structure while taking into account the forces from the moored barges
Using the analyses from the Chapter 4.4, the values of the forces acting on the barges in various states of their location in relation to the river current were determined. As a result, for these states, the values of the forces that could arise in the mooring lines anchoring the barges to the reinforced concrete structure of the wharf were determined.
In the next step, simulation calculations of the wharf’s structure, modelled as a spatial object, were performed in order to determine what the values of the forces generated from the moored barges were. These forces, after detachment of the barges from the wharf at one end (at the moment of the mooring lines breaking), caused displacements of several centimetres in the upper part of the reinforced concrete structure of the wharf (before the occurrence of the displacement of the entire wharf and the embankment) and the destruction of structural elements. It was assumed that the parameters of the soil behind the wall made of reinforced concrete panels were obtained from geotechnical tests of the ground (Table 1). In the static model, it was assumed that the upper slab of the wharf was unloaded and that the water was at the level of the top of the reinforced concrete beam. In turn, the load from the mooring lines was applied to the columns directly above the lowest reinforced concrete beam, which connects the reinforced concrete panels of the retaining wall. Moreover, in the case of the horizontal displacements, an elastic support of the lower piles in the ground was assumed.
The calculations of the spatial frame model of the analysed quay were carried out with the use of Autodesk Robot Structural Analysis (RSA). This programme is widely used both for professional structural design as well as for solving research issues relating to all kinds of engineering structures.
The calculations were made for two variants: in variant I—the nominal cross-sections of the elements were assumed, and in variant II—due to the very high corrosion of the concrete structure of the wharf, and in particular the reinforcement cover, it was assumed that the cross-sections of the columns and the lowest reinforced concrete beam are reduced on both sides by the value of the cover’s thickness, and that the height of the upper beams is reduced on one side by the thickness of the cover, i.e. by 3 cm. Based on the assumption that there are concrete corrosion losses, the obtained maximum displacements of the upper edge of the structure from the wharf side amounted to approx. 10 cm (Fig. 24). However, the values of the loads from the forces in the mooring lines of the barges, which were simulated for the above-mentioned variants, exceeded those determined in the calculations of real influences (Chapter 4.4) by an order of value. Therefore, it was found that even with the assumed damage and losses, the forces from the moored barges could not independently cause such large displacements and damage to the wharf’s structure, however, they could be a factor that contributed to the emergence of the failure.

3D numerical analysis of the wharf’s structure: a load scheme, b frame deformation—top view for variant II, c displacement of the structure for variant I, d displacement of the structure for variant II
5 Analysis of the stability of the wharf’s embankment
An important element in the search for the causes of the catastrophe of the wharf was the analysis of the phenomena related to the loss of the stability of the embankment with regards to the structure of the wharf and the various schemes of the embankment’s behaviour. When creating the model of the embankment-wharf system, the archival documentation of the construction (Fig. 9), and also calculation documentation (Fig. 25), were analysed. Moreover, the technical condition of the wharf’s elements, and the parameters of their material, which were determined on the basis of current tests and measurements, were taken into account.

Archival documentation of the structural calculations [27]
2D numerical simulations of the stability of the wharf with the use of the PLAXIS 2D programme in a plane state of deformations were carried out for five calculation schemes of the wharf:
-
Scheme I The original condition, after constructing the load-bearing structure and the sheet piling – with the assumption of the original level of the river’s bottom (Fig. 26).
-
Scheme II The condition after lowering the river’s bottom to the ordinate of 107.70 m above sea level (Fig. 27).
-
Scheme III The condition after loosening of the soil behind the sheet piling, which was caused by fluctuations (in the annual cycle) in the ground-water level behind the wall (Fig. 27).
-
Scheme IV The condition at the moment of losing the load-bearing capacity of the anchor rods (stresses exceeded due to the corrosion of the steel) (Fig. 28).
-
Scheme V The condition after the application of an external load from the mooring forces of the barges (Fig. 28).

Numerical model for scheme I

Numerical model for schemes II and III

Numerical model for schemes IV and V
The constitutive relationship for the soil medium was assumed to be elastic–plastic with the Mohr–Coulomb plasticity condition:
and unassociated law of plastic flow. In the above relation, \(\phi\) is the angle of internal friction, while c is the material’s cohesion. This relationship is valid for the following marking convention—the underlined symbols take positive values during compression.
For the numerical implementation using PLAXIS 2D software, the Mohr–Coulomb condition (stability index) written with the use of principal stresses was used, i.e.:
under the following conditions: \(\sigma_{1} \ge \sigma_{2}\) and \(\sigma_{2} \ge \sigma_{3}\).
The reinforced concrete structure was assumed to be made of an elastic material with the following parameters: Young's modulus E = 10 GPa, Poisson's ratio \(v\) = 0.2, and volumetric weight \(\gamma\) = 25.0 kN/m3.
As a result of the numerical analysis, the displacements of the quay that are shown in Figs. 29, 30, 31 and 32 were obtained for individual computational schemes.

The map of soil displacements for scheme I, with the stability index of the wharf estimated at the level of F = 1.32

The map of soil displacements for scheme II, with the stability index of the wharf estimated at the level of F = 1.22

The map of soil displacements for scheme III, with the stability index of the wharf estimated at the level of F = 1.08

The map of soil displacements for scheme IV, with the stability index of the wharf estimated at the level of F = 0.98 ÷ 1.03
In the case of scheme V, after applying the external load from the barges’ mooring forces, the displacements of the system were so large that the computational model became unstable. Therefore, Fig. 33 shows the slip surface after the application of an external load from the moored barges.

The slip surface after the application of the load from the mooring forces—scheme V
Figure 34 shows the estimated values of the wharf’s stability indexes for schemes I, II and III. The obtained stability index values of the wharf are higher than F = 1.0, which means that the wharf is stable. However, it has a small safety margin.

Chart of the estimated stability indexes of the wharf for the calculation schemes I–III: scheme I: F = 1.32; scheme II: F = 1.22; scheme III: F = 1.08
Figure 35 shows the stability index of the wharf for scheme IV. The value of the stability of the wharf F was estimated within the range of 0.98/1.03, which means that it is at the limit of stability, and that a loss of stability may occur.

Chart of the estimated stability index of the wharf for scheme IV: F = 0.95/1.03
6 Synthesis of the results of the conducted analyses
Based on the performed numerical analyses, the following conclusions were formulated:
-
1.
The stability index of the wharf’s embankment—immediately after its construction in 1912 (scheme I)—was defined as the minimum value of Fmin ≥ 1.32. However, due to the lack of knowledge concerning the wharf’s construction stages, the calculated stability index may be underestimated.
-
2.
Due to the fact that the deepening of the river’s bottom was considered in the calculations (scheme II), the stability index was reduced to the value of Fmin ≥ 1.22.
-
3.
Scheme III, based on the conducted archival ground tests in the vicinity of the accident site, takes into account the occurrence of loose non-cohesive soils in the zone between the river’s bottom and the top of the wharf’s embankment. In this model, the calculated stability index of the wharf is Fmin ≥ 1.08. A low value of stability index means that the wharf does not have a sufficient safety margin.
-
4.
Calculation scheme IV takes into account the effect of the breaking of the wharf’s anchor rod in the ground. For this scheme, the stability index of the embankment is F ≈ 1.0, and a loss of stability of the embankment may occur.
-
5.
Computational scheme V takes into account the occurrence of an additional load from the barges’ mooring forces, while at the same time assuming that there are no anchor rods. For such a scheme, the computational model becomes unstable, and large displacements of the structure are possible.
The analyses of the defined models of the stability of the embankment enabled these models to be related to the problem of determining the causes of the harbour wharf disaster. The described and numerically analysed course of the process of the long-term decline in the stability of the embankment and the wharf’s structure generated a situation in which the wharf underwent failure. The decline in the stability was caused by the following: the lack of appropriate repairs and the corrosion of the structure's elements; the lack of proper operation and maintenance of the river channel, which would be adapted to the parameters of the strengthening; the change in ground conditions; sudden changes in the water flow in the river current; and the possible initiating factor in the form of forces from the moored barges.
References
Bień J, Kamiński T, Rawa P. Emergency conditions of masonry embankments of the Odra river in Wrocław. In: Proc. 27th Scientific and Tecnical Conference Construction Failures. Międzyzdroje, Poland. 2015:143–50 (in Polish).
Klin S, Idzikowski R. Structures of embankment protection of Odra river in Wrocław—outline of history, variety of solutions, needs of technical and science optimization of repairing and renovation technology, Infrastructure and ecology of rural areas. Pol Acad Sci. 2008;9:19–34 (in Polish).
Gyurkovich J. Cologne—revitalization of the former port of Rheinauhafen, Technical Transactions—Architecture. 2011;3-A/2011(12):25–46 (in Polish).
Djukić A, Marić J, Antonić B, Kovač V, Joković J, Dinkić N. The evaluation of urban renewal waterfront development: the case of the Sava river in Belgrade, Serbia. Sustainability. 2020;12:6620.
Louekari M. Revitalizing New York’s East River waterfront. Archit Res Finl. 2018;2(1):165–79.
Gronostajska B. Revitalization of Düsseldorf port waterfronts as new city brand. Building Review. 2013;3:49–53 (in Polish).
Gronostajska B, Szefer I. Waterfronts in a modern city—selected designs. In: Modernity in architecture: integration, identification, innovation. Monograph. 2013;(3):77–88 (in Polish).
Perri MT, Boaga J, Bersan S, Cassiani G, Cola S, Deiana R, Simonini P, Patti S. River embankment characterization: the joint use of geophysical and geotechnical techniques. J Appl Geophys. 2014;110:5–22.
Godlewski T, Łukasik S, Kaczyński Ł, Chada K, Bogusz W. Geotechnical condidtions of river embankment construction failure, in: Proc. 26th Scientific and Technical Conference Construction Failures. Międzyzdroje, Poland. 2013:323–30 (in Polish).
Hossain MB, Sakai T, Hossain MZ. River embankment and bank failure: a study on geotechnical characteristics and stability analysis. Am J Environ Sci. 2011;7(2):102–7.
Kowalski K, Smoliński W. Modernization of the reloading quay as a result of an emergency and its further reconstruction in order to install other types of cranes. In: Proc. of 14th Interdisciplinary Symposium on prevention of failures and construction disaster. Świnoujście, Poland. 1993:1–9 (in Polish).
Cheng YM, Lau CK. Slope stability analysis and stabilization. New methods and Insight. 2nd ed. Boca Raton: CRC Press; 2017.
Cheng YM, Länsivaara T, Wei WB. Two-dimensional slope stability analysis by limit equilibrium and strength reduction methods. Comput Geotech. 2007;34(3):137–50.
Liu SY, Shao LT, Li HJ. Slope stability analysis using the limit equilibrium method and two finite element methods. Comput Geotech. 2015;63:291–8.
Su Z, Shao L. A three-dimensional slope stability analysis method based on finite element method stress analysis. Eng Geol. 2021;280:105910.
Wrana B, Pietrzak N. Slope stability estimation of the Kościuszko Mound in Cracow. Studia Geotech Mech. 2015;37(2):93–101.
Krażelewski J. The reinforcement design of the slope in Trzęsacz. Studia Geotech Mech. 2005;XXVII(1–2):111–6.
Batog A, Stilger-Szydło E. Stability of road earth structures in the complex and complicated ground conditions. Studia Geotech Mech. 2018;4(40):300–12.
Abusharar SW, Han J. Two-dimensional deep-seated slope stability analysis of embankments over stone column-improved soft clay. Eng Geol. 2011;120(1–4):103–10.
Haque D, Reza MI. Parametric analysis of slope stability for river embankment. J Adv Eng Comput. 2020;4(3):196–206.
Gottardi G, Gragnano CG, Rocchi I, Bitelli M. Assessing river embankment stability under transient seepage conditions. Proc Eng. 2016;158:350–5.
Fatema N, Ansary MH. Slope stability analysis of a Jamuna river embankment. J Civ Eng. 2014;42(1):119–36.
Balawejder A, Chalfen M, Molski T, Surowiecki A. The stability of hydrotechnical embankments under various seepage conditions. Communications. 2007;1:67–70.
Zaleski J. Odra river and construction failures in effect of floods. In: Proc. 25th Scientific and Technical Conference Construction Failures. Międzyzdroje, Poland. 2011:321–34 (in Polish).
Parylak K, Witek K. Complexity of conditions of the causes of the disaster of the Odra reloading wharf. Acta Sci Pol Architect. 2018;17(3):91–101.
Dmochowski G, Berkowski P. Structural failure of old reinforced concrete river wharf. In: Proc. 7th International Conference on Concrete Repair, Concrete Solutions, Cluj-Napoca, Romania. MATEC Web of Conferences. 2019;289 (10004).
Archival documentation. Building Archive of the City of Wrocław.
Walczak A, Szkudlarek A. Analysis of the forces acting on the mooring of barges at the quay at Michalczyka Str. in Wrocław on May 4, 2017. In: Dmochowski G. et al. Technical expertise of the reinforced concrete wharf of the Odra river at Michalczyka Str. in Wrocław due to structural failure. Idea Broker Ltd. 2017 (in Polish).
Forces in the mooring lines. Polish Register of Shipping. https://www.prs.pl/r-d/prace-naukowo-badawcze-w-prs/sily-w-linach-cumowniczych (in Polish).
Mitosek M. Fluid mechanics in engineering and environmental protection. Publishing House of the Warsaw University of Technology; 2007 (in Polish).
Sobota J. Hydraulics and fluid mechanics. Publishing House of the Agricultural University in Wrocław; 2003 (in Polish).
Funding
This work was partially funded by Idea Broker Ltd., Wroclaw, Poland.
Author information
Authors and Affiliations
Corresponding author
Ethics declarations
Conflict of interest
Authors declare they have no conflict of interest.
Ethical approval
This article does not contain any studies with human participants or animals performed by any of the authors.
Additional information
Publisher's Note
Springer Nature remains neutral with regard to jurisdictional claims in published maps and institutional affiliations.
Rights and permissions
Open Access This article is licensed under a Creative Commons Attribution 4.0 International License, which permits use, sharing, adaptation, distribution and reproduction in any medium or format, as long as you give appropriate credit to the original author(s) and the source, provide a link to the Creative Commons licence, and indicate if changes were made. The images or other third party material in this article are included in the article's Creative Commons licence, unless indicated otherwise in a credit line to the material. If material is not included in the article's Creative Commons licence and your intended use is not permitted by statutory regulation or exceeds the permitted use, you will need to obtain permission directly from the copyright holder. To view a copy of this licence, visit http://creativecommons.org/licenses/by/4.0/.
About this article

Cite this article
Dmochowski, G., Berkowski, P., Szołomicki, J. et al. Modelling and analysis of the stability of a harbour wharf’s embankment with regards to its failure. Archiv.Civ.Mech.Eng 21, 140 (2021). https://doi.org/10.1007/s43452-021-00293-5
Received:
Revised:
Accepted:
Published:
DOI: https://doi.org/10.1007/s43452-021-00293-5