
Abstract
The digital world has a wealth of data, such as internet of things (IoT) data, business data, health data, mobile data, urban data, security data, and many more, in the current age of the Fourth Industrial Revolution (Industry 4.0 or 4IR). Extracting knowledge or useful insights from these data can be used for smart decision-making in various applications domains. In the area of data science, advanced analytics methods including machine learning modeling can provide actionable insights or deeper knowledge about data, which makes the computing process automatic and smart. In this paper, we present a comprehensive view on “Data Science” including various types of advanced analytics methods that can be applied to enhance the intelligence and capabilities of an application through smart decision-making in different scenarios. We also discuss and summarize ten potential real-world application domains including business, healthcare, cybersecurity, urban and rural data science, and so on by taking into account data-driven smart computing and decision making. Based on this, we finally highlight the challenges and potential research directions within the scope of our study. Overall, this paper aims to serve as a reference point on data science and advanced analytics to the researchers and decision-makers as well as application developers, particularly from the data-driven solution point of view for real-world problems.
Introduction
We are living in the age of “data science and advanced analytics”, where almost everything in our daily lives is digitally recorded as data [17]. Thus the current electronic world is a wealth of various kinds of data, such as business data, financial data, healthcare data, multimedia data, internet of things (IoT) data, cybersecurity data, social media data, etc [112]. The data can be structured, semi-structured, or unstructured, which increases day by day [105]. Data science is typically a “concept to unify statistics, data analysis, and their related methods” to understand and analyze the actual phenomena with data. According to Cao et al. [17] “data science is the science of data” or “data science is the study of data”, where a data product is a data deliverable, or data-enabled or guided, which can be a discovery, prediction, service, suggestion, insight into decision-making, thought, model, paradigm, tool, or system. The popularity of “Data science” is increasing day-by-day, which is shown in Fig. 1 according to Google Trends data over the last 5 years [36]. In addition to data science, we have also shown the popularity trends of the relevant areas such as “Data analytics”, “Data mining”, “Big data”, “Machine learning” in the figure. According to Fig. 1, the popularity indication values for these data-driven domains, particularly “Data science”, and “Machine learning” are increasing day-by-day. This statistical information and the applicability of the data-driven smart decision-making in various real-world application areas, motivate us to study briefly on “Data science” and machine-learning-based “Advanced analytics” in this paper.

The worldwide popularity score of data science comparing with relevant areas in a range of 0 (min) to 100 (max) over time where x-axis represents the timestamp information and y-axis represents the corresponding score
Usually, data science is the field of applying advanced analytics methods and scientific concepts to derive useful business information from data. The emphasis of advanced analytics is more on anticipating the use of data to detect patterns to determine what is likely to occur in the future. Basic analytics offer a description of data in general, while advanced analytics is a step forward in offering a deeper understanding of data and helping to analyze granular data, which we are interested in. In the field of data science, several types of analytics are popular, such as "Descriptive analytics" which answers the question of what happened; "Diagnostic analytics" which answers the question of why did it happen; "Predictive analytics" which predicts what will happen in the future; and "Prescriptive analytics" which prescribes what action should be taken, discussed briefly in “Advanced analytics methods and smart computing”. Such advanced analytics and decision-making based on machine learning techniques [105], a major part of artificial intelligence (AI) [102] can also play a significant role in the Fourth Industrial Revolution (Industry 4.0) due to its learning capability for smart computing as well as automation [121].
Although the area of “data science” is huge, we mainly focus on deriving useful insights through advanced analytics, where the results are used to make smart decisions in various real-world application areas. For this, various advanced analytics methods such as machine learning modeling, natural language processing, sentiment analysis, neural network, or deep learning analysis can provide deeper knowledge about data, and thus can be used to develop data-driven intelligent applications. More specifically, regression analysis, classification, clustering analysis, association rules, time-series analysis, sentiment analysis, behavioral patterns, anomaly detection, factor analysis, log analysis, and deep learning which is originated from the artificial neural network, are taken into account in our study. These machine learning-based advanced analytics methods are discussed briefly in “Advanced analytics methods and smart computing”. Thus, it’s important to understand the principles of various advanced analytics methods mentioned above and their applicability to apply in various real-world application areas. For instance, in our earlier paper Sarker et al. [114], we have discussed how data science and machine learning modeling can play a significant role in the domain of cybersecurity for making smart decisions and to provide data-driven intelligent security services. In this paper, we broadly take into account the data science application areas and real-world problems in ten potential domains including the area of business data science, health data science, IoT data science, behavioral data science, urban data science, and so on, discussed briefly in “Real-world application domains”.
Based on the importance of machine learning modeling to extract the useful insights from the data mentioned above and data-driven smart decision-making, in this paper, we present a comprehensive view on “Data Science” including various types of advanced analytics methods that can be applied to enhance the intelligence and the capabilities of an application. The key contribution of this study is thus understanding data science modeling, explaining different analytic methods for solution perspective and their applicability in various real-world data-driven applications areas mentioned earlier. Overall, the purpose of this paper is, therefore, to provide a basic guide or reference for those academia and industry people who want to study, research, and develop automated and intelligent applications or systems based on smart computing and decision making within the area of data science.
The main contributions of this paper are summarized as follows:
-
To define the scope of our study towards data-driven smart computing and decision-making in our real-world life. We also make a brief discussion on the concept of data science modeling from business problems to data product and automation, to understand its applicability and provide intelligent services in real-world scenarios.
-
To provide a comprehensive view on data science including advanced analytics methods that can be applied to enhance the intelligence and the capabilities of an application.
-
To discuss the applicability and significance of machine learning-based analytics methods in various real-world application areas. We also summarize ten potential real-world application areas, from business to personalized applications in our daily life, where advanced analytics with machine learning modeling can be used to achieve the expected outcome.
-
To highlight and summarize the challenges and potential research directions within the scope of our study.
The rest of the paper is organized as follows. The next section provides the background and related work and defines the scope of our study. The following section presents the concepts of data science modeling for building a data-driven application. After that, briefly discuss and explain different advanced analytics methods and smart computing. Various real-world application areas are discussed and summarized in the next section. We then highlight and summarize several research issues and potential future directions, and finally, the last section concludes this paper.
Background and Related Work
In this section, we first discuss various data terms and works related to data science and highlight the scope of our study.
Data Terms and Definitions
There is a range of key terms in the field, such as data analysis, data mining, data analytics, big data, data science, advanced analytics, machine learning, and deep learning, which are highly related and easily confusing. In the following, we define these terms and differentiate them with the term “Data Science” according to our goal.
The term “Data analysis” refers to the processing of data by conventional (e.g., classic statistical, empirical, or logical) theories, technologies, and tools for extracting useful information and for practical purposes [17]. The term “Data analytics”, on the other hand, refers to the theories, technologies, instruments, and processes that allow for an in-depth understanding and exploration of actionable data insight [17]. Statistical and mathematical analysis of the data is the major concern in this process. “Data mining” is another popular term over the last decade, which has a similar meaning with several other terms such as knowledge mining from data, knowledge extraction, knowledge discovery from data (KDD), data/pattern analysis, data archaeology, and data dredging. According to Han et al. [38], it should have been more appropriately named “knowledge mining from data”. Overall, data mining is defined as the process of discovering interesting patterns and knowledge from large amounts of data [38]. Data sources may include databases, data centers, the Internet or Web, other repositories of data, or data dynamically streamed through the system. “Big data” is another popular term nowadays, which may change the statistical and data analysis approaches as it has the unique features of “massive, high dimensional, heterogeneous, complex, unstructured, incomplete, noisy, and erroneous” [74]. Big data can be generated by mobile devices, social networks, the Internet of Things, multimedia, and many other new applications [129]. Several unique features including volume, velocity, variety, veracity, value (5Vs), and complexity are used to understand and describe big data [69].
In terms of analytics, basic analytics provides a summary of data whereas the term “Advanced Analytics” takes a step forward in offering a deeper understanding of data and helps to analyze granular data. Advanced analytics is characterized or defined as autonomous or semi-autonomous data or content analysis using advanced techniques and methods to discover deeper insights, predict or generate recommendations, typically beyond traditional business intelligence or analytics. “Machine learning”, a branch of artificial intelligence (AI), is one of the major techniques used in advanced analytics which can automate analytical model building [112]. This is focused on the premise that systems can learn from data, recognize trends, and make decisions, with minimal human involvement [38, 115]. “Deep Learning” is a subfield of machine learning that discusses algorithms inspired by the human brain’s structure and the function called artificial neural networks [38, 139].
Unlike the above data-related terms, “Data science” is an umbrella term that encompasses advanced data analytics, data mining, machine, and deep learning modeling, and several other related disciplines like statistics, to extract insights or useful knowledge from the datasets and transform them into actionable business strategies. In [17], Cao et al. defined data science from the disciplinary perspective as “data science is a new interdisciplinary field that synthesizes and builds on statistics, informatics, computing, communication, management, and sociology to study data and its environments (including domains and other contextual aspects, such as organizational and social aspects) to transform data to insights and decisions by following a data-to-knowledge-to-wisdom thinking and methodology”. In “Understanding data science modeling”, we briefly discuss the data science modeling from a practical perspective starting from business problems to data products that can assist the data scientists to think and work in a particular real-world problem domain within the area of data science and analytics.
Related Work
In the area, several papers have been reviewed by the researchers based on data science and its significance. For example, the authors in [19] identify the evolving field of data science and its importance in the broader knowledge environment and some issues that differentiate data science and informatics issues from conventional approaches in information sciences. Donoho et al. [27] present 50 years of data science including recent commentary on data science in mass media, and on how/whether data science varies from statistics. The authors formally conceptualize the theory-guided data science (TGDS) model in [53] and present a taxonomy of research themes in TGDS. Cao et al. include a detailed survey and tutorial on the fundamental aspects of data science in [17], which considers the transition from data analysis to data science, the principles of data science, as well as the discipline and competence of data education.
Besides, the authors include a data science analysis in [20], which aims to provide a realistic overview of the use of statistical features and related data science methods in bioimage informatics. The authors in [61] study the key streams of data science algorithm use at central banks and show how their popularity has risen over time. This research contributes to the creation of a research vector on the role of data science in central banking. In [62], the authors provide an overview and tutorial on the data-driven design of intelligent wireless networks. The authors in [87] provide a thorough understanding of computational optimal transport with application to data science. In [97], the authors present data science as theoretical contributions in information systems via text analytics.
Unlike the above recent studies, in this paper, we concentrate on the knowledge of data science including advanced analytics methods, machine learning modeling, real-world application domains, and potential research directions within the scope of our study. The advanced analytics methods based on machine learning techniques discussed in this paper can be applied to enhance the capabilities of an application in terms of data-driven intelligent decision making and automation in the final data product or systems.
Understanding Data Science Modeling
In this section, we briefly discuss how data science can play a significant role in the real-world business process. For this, we first categorize various types of data and then discuss the major steps of data science modeling starting from business problems to data product and automation.
Types of Real-World Data
Typically, to build a data-driven real-world system in a particular domain, the availability of data is the key [17, 112, 114]. The data can be in different types such as (i) Structured—that has a well-defined data structure and follows a standard order, examples are names, dates, addresses, credit card numbers, stock information, geolocation, etc.; (ii) Unstructured—has no pre-defined format or organization, examples are sensor data, emails, blog entries, wikis, and word processing documents, PDF files, audio files, videos, images, presentations, web pages, etc.; (iii) Semi-structured—has elements of both the structured and unstructured data containing certain organizational properties, examples are HTML, XML, JSON documents, NoSQL databases, etc.; and (iv) Metadata—that represents data about the data, examples are author, file type, file size, creation date and time, last modification date and time, etc. [38, 105].
In the area of data science, researchers use various widely-used datasets for different purposes. These are, for example, cybersecurity datasets such as NSL-KDD [127], UNSW-NB15 [79], Bot-IoT [59], ISCX’12 [15], CIC-DDoS2019 [22], etc., smartphone datasets such as phone call logs [88, 110], mobile application usages logs [124, 149], SMS Log [28], mobile phone notification logs [77] etc., IoT data [56, 11, 64], health data such as heart disease [99], diabetes mellitus [86, 147], COVID-19 [41, 78], etc., agriculture and e-commerce data [128, 150], and many more in various application domains. In “Real-world application domains”, we discuss ten potential real-world application domains of data science and analytics by taking into account data-driven smart computing and decision making, which can help the data scientists and application developers to explore more in various real-world issues.
Overall, the data used in data-driven applications can be any of the types mentioned above, and they can differ from one application to another in the real world. Data science modeling, which is briefly discussed below, can be used to analyze such data in a specific problem domain and derive insights or useful information from the data to build a data-driven model or data product.
Steps of Data Science Modeling
Data science is typically an umbrella term that encompasses advanced data analytics, data mining, machine, and deep learning modeling, and several other related disciplines like statistics, to extract insights or useful knowledge from the datasets and transform them into actionable business strategies, mentioned earlier in “Background and related work”. In this section, we briefly discuss how data science can play a significant role in the real-world business process. Figure 2 shows an example of data science modeling starting from real-world data to data-driven product and automation. In the following, we briefly discuss each module of the data science process.
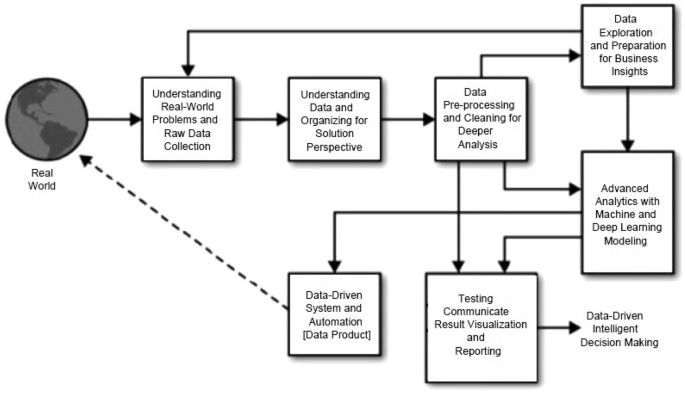
An example of data science modeling from real-world data to data-driven system and decision making
-
Understanding business problems: This involves getting a clear understanding of the problem that is needed to solve, how it impacts the relevant organization or individuals, the ultimate goals for addressing it, and the relevant project plan. Thus to understand and identify the business problems, the data scientists formulate relevant questions while working with the end-users and other stakeholders. For instance, how much/many, which category/group, is the behavior unrealistic/abnormal, which option should be taken, what action, etc. could be relevant questions depending on the nature of the problems. This helps to get a better idea of what business needs and what we should be extracted from data. Such business knowledge can enable organizations to enhance their decision-making process, is known as “Business Intelligence” [65]. Identifying the relevant data sources that can help to answer the formulated questions and what kinds of actions should be taken from the trends that the data shows, is another important task associated with this stage. Once the business problem has been clearly stated, the data scientist can define the analytic approach to solve the problem.
-
Understanding data: As we know that data science is largely driven by the availability of data [114]. Thus a sound understanding of the data is needed towards a data-driven model or system. The reason is that real-world data sets are often noisy, missing values, have inconsistencies, or other data issues, which are needed to handle effectively [101]. To gain actionable insights, the appropriate data or the quality of the data must be sourced and cleansed, which is fundamental to any data science engagement. For this, data assessment that evaluates what data is available and how it aligns to the business problem could be the first step in data understanding. Several aspects such as data type/format, the quantity of data whether it is sufficient or not to extract the useful knowledge, data relevance, authorized access to data, feature or attribute importance, combining multiple data sources, important metrics to report the data, etc. are needed to take into account to clearly understand the data for a particular business problem. Overall, the data understanding module involves figuring out what data would be best needed and the best ways to acquire it.
-
Data pre-processing and exploration: Exploratory data analysis is defined in data science as an approach to analyzing datasets to summarize their key characteristics, often with visual methods [135]. This examines a broad data collection to discover initial trends, attributes, points of interest, etc. in an unstructured manner to construct meaningful summaries of the data. Thus data exploration is typically used to figure out the gist of data and to develop a first step assessment of its quality, quantity, and characteristics. A statistical model can be used or not, but primarily it offers tools for creating hypotheses by generally visualizing and interpreting the data through graphical representation such as a chart, plot, histogram, etc [72, 91]. Before the data is ready for modeling, it’s necessary to use data summarization and visualization to audit the quality of the data and provide the information needed to process it. To ensure the quality of the data, the data pre-processing technique, which is typically the process of cleaning and transforming raw data [107] before processing and analysis is important. It also involves reformatting information, making data corrections, and merging data sets to enrich data. Thus, several aspects such as expected data, data cleaning, formatting or transforming data, dealing with missing values, handling data imbalance and bias issues, data distribution, search for outliers or anomalies in data and dealing with them, ensuring data quality, etc. could be the key considerations in this step.
-
Machine learning modeling and evaluation: Once the data is prepared for building the model, data scientists design a model, algorithm, or set of models, to address the business problem. Model building is dependent on what type of analytics, e.g., predictive analytics, is needed to solve the particular problem, which is discussed briefly in “Advanced analytics methods and smart computing”. To best fits the data according to the type of analytics, different types of data-driven or machine learning models that have been summarized in our earlier paper Sarker et al. [105], can be built to achieve the goal. Data scientists typically separate training and test subsets of the given dataset usually dividing in the ratio of 80:20 or data considering the most popular k-folds data splitting method [38]. This is to observe whether the model performs well or not on the data, to maximize the model performance. Various model validation and assessment metrics, such as error rate, accuracy, true positive, false positive, true negative, false negative, precision, recall, f-score, ROC (receiver operating characteristic curve) analysis, applicability analysis, etc. [38, 115] are used to measure the model performance, which can guide the data scientists to choose or design the learning method or model. Besides, machine learning experts or data scientists can take into account several advanced analytics such as feature engineering, feature selection or extraction methods, algorithm tuning, ensemble methods, modifying existing algorithms, or designing new algorithms, etc. to improve the ultimate data-driven model to solve a particular business problem through smart decision making.
-
Data product and automation: A data product is typically the output of any data science activity [17]. A data product, in general terms, is a data deliverable, or data-enabled or guide, which can be a discovery, prediction, service, suggestion, insight into decision-making, thought, model, paradigm, tool, application, or system that process data and generate results. Businesses can use the results of such data analysis to obtain useful information like churn (a measure of how many customers stop using a product) prediction and customer segmentation, and use these results to make smarter business decisions and automation. Thus to make better decisions in various business problems, various machine learning pipelines and data products can be developed. To highlight this, we summarize several potential real-world data science application areas in “Real-world application domains”, where various data products can play a significant role in relevant business problems to make them smart and automate.
Overall, we can conclude that data science modeling can be used to help drive changes and improvements in business practices. The interesting part of the data science process indicates having a deeper understanding of the business problem to solve. Without that, it would be much harder to gather the right data and extract the most useful information from the data for making decisions to solve the problem. In terms of role, “Data Scientists” typically interpret and manage data to uncover the answers to major questions that help organizations to make objective decisions and solve complex problems. In a summary, a data scientist proactively gathers and analyzes information from multiple sources to better understand how the business performs, and designs machine learning or data-driven tools/methods, or algorithms, focused on advanced analytics, which can make today’s computing process smarter and intelligent, discussed briefly in the following section.
Advanced Analytics Methods and Smart Computing
As mentioned earlier in “Background and related work”, basic analytics provides a summary of data whereas advanced analytics takes a step forward in offering a deeper understanding of data and helps in granular data analysis. For instance, the predictive capabilities of advanced analytics can be used to forecast trends, events, and behaviors. Thus, “advanced analytics” can be defined as the autonomous or semi-autonomous analysis of data or content using advanced techniques and methods to discover deeper insights, make predictions, or produce recommendations, where machine learning-based analytical modeling is considered as the key technologies in the area. In the following section, we first summarize various types of analytics and outcome that are needed to solve the associated business problems, and then we briefly discuss machine learning-based analytical modeling.
Types of Analytics and Outcome
In the real-world business process, several key questions such as “What happened?”, “Why did it happen?”, “What will happen in the future?”, “What action should be taken?” are common and important. Based on these questions, in this paper, we categorize and highlight the analytics into four types such as descriptive, diagnostic, predictive, and prescriptive, which are discussed below.
-
Descriptive analytics: It is the interpretation of historical data to better understand the changes that have occurred in a business. Thus descriptive analytics answers the question, “what happened in the past?” by summarizing past data such as statistics on sales and operations or marketing strategies, use of social media, and engagement with Twitter, Linkedin or Facebook, etc. For instance, using descriptive analytics through analyzing trends, patterns, and anomalies, etc., customers’ historical shopping data can be used to predict the probability of a customer purchasing a product. Thus, descriptive analytics can play a significant role to provide an accurate picture of what has occurred in a business and how it relates to previous times utilizing a broad range of relevant business data. As a result, managers and decision-makers can pinpoint areas of strength and weakness in their business, and eventually can take more effective management strategies and business decisions.
-
Diagnostic analytics: It is a form of advanced analytics that examines data or content to answer the question, “why did it happen?” The goal of diagnostic analytics is to help to find the root cause of the problem. For example, the human resource management department of a business organization may use these diagnostic analytics to find the best applicant for a position, select them, and compare them to other similar positions to see how well they perform. In a healthcare example, it might help to figure out whether the patients’ symptoms such as high fever, dry cough, headache, fatigue, etc. are all caused by the same infectious agent. Overall, diagnostic analytics enables one to extract value from the data by posing the right questions and conducting in-depth investigations into the answers. It is characterized by techniques such as drill-down, data discovery, data mining, and correlations.
-
Predictive analytics: Predictive analytics is an important analytical technique used by many organizations for various purposes such as to assess business risks, anticipate potential market patterns, and decide when maintenance is needed, to enhance their business. It is a form of advanced analytics that examines data or content to answer the question, “what will happen in the future?” Thus, the primary goal of predictive analytics is to identify and typically answer this question with a high degree of probability. Data scientists can use historical data as a source to extract insights for building predictive models using various regression analyses and machine learning techniques, which can be used in various application domains for a better outcome. Companies, for example, can use predictive analytics to minimize costs by better anticipating future demand and changing output and inventory, banks and other financial institutions to reduce fraud and risks by predicting suspicious activity, medical specialists to make effective decisions through predicting patients who are at risk of diseases, retailers to increase sales and customer satisfaction through understanding and predicting customer preferences, manufacturers to optimize production capacity through predicting maintenance requirements, and many more. Thus predictive analytics can be considered as the core analytical method within the area of data science.
-
Prescriptive analytics: Prescriptive analytics focuses on recommending the best way forward with actionable information to maximize overall returns and profitability, which typically answer the question, “what action should be taken?” In business analytics, prescriptive analytics is considered the final step. For its models, prescriptive analytics collects data from several descriptive and predictive sources and applies it to the decision-making process. Thus, we can say that it is related to both descriptive analytics and predictive analytics, but it emphasizes actionable insights instead of data monitoring. In other words, it can be considered as the opposite of descriptive analytics, which examines decisions and outcomes after the fact. By integrating big data, machine learning, and business rules, prescriptive analytics helps organizations to make more informed decisions to produce results that drive the most successful business decisions.
In summary, to clarify what happened and why it happened, both descriptive analytics and diagnostic analytics look at the past. Historical data is used by predictive analytics and prescriptive analytics to forecast what will happen in the future and what steps should be taken to impact those effects. In Table 1, we have summarized these analytics methods with examples. Forward-thinking organizations in the real world can jointly use these analytical methods to make smart decisions that help drive changes in business processes and improvements. In the following, we discuss how machine learning techniques can play a big role in these analytical methods through their learning capabilities from the data.
Machine Learning Based Analytical Modeling
In this section, we briefly discuss various advanced analytics methods based on machine learning modeling, which can make the computing process smart through intelligent decision-making in a business process. Figure 3 shows a general structure of a machine learning-based predictive modeling considering both the training and testing phase. In the following, we discuss a wide range of methods such as regression and classification analysis, association rule analysis, time-series analysis, behavioral analysis, log analysis, and so on within the scope of our study.
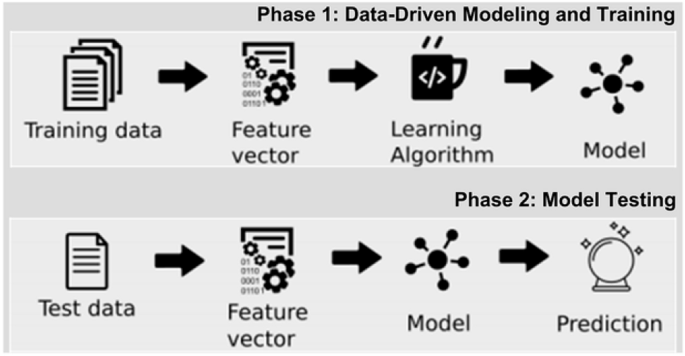
A general structure of a machine learning based predictive model considering both the training and testing phase
Regression Analysis
In data science, one of the most common statistical approaches used for predictive modeling and data mining tasks is regression techniques [38]. Regression analysis is a form of supervised machine learning that examines the relationship between a dependent variable (target) and independent variables (predictor) to predict continuous-valued output [105, 117]. The following equations Eqs. 1, 2, and 3 [85, 105] represent the simple, multiple or multivariate, and polynomial regressions respectively, where x represents independent variable and y is the predicted/target output mentioned above:
Regression analysis is typically conducted for one of two purposes: to predict the value of the dependent variable in the case of individuals for whom some knowledge relating to the explanatory variables is available, or to estimate the effect of some explanatory variable on the dependent variable, i.e., finding the relationship of causal influence between the variables. Linear regression cannot be used to fit non-linear data and may cause an underfitting problem. In that case, polynomial regression performs better, however, increases the model complexity. The regularization techniques such as Ridge, Lasso, Elastic-Net, etc. [85, 105] can be used to optimize the linear regression model. Besides, support vector regression, decision tree regression, random forest regression techniques [85, 105] can be used for building effective regression models depending on the problem type, e.g., non-linear tasks. Financial forecasting or prediction, cost estimation, trend analysis, marketing, time-series estimation, drug response modeling, etc. are some examples where the regression models can be used to solve real-world problems in the domain of data science and analytics.
Classification Analysis
Classification is one of the most widely used and best-known data science processes. This is a form of supervised machine learning approach that also refers to a predictive modeling problem in which a class label is predicted for a given example [38]. Spam identification, such as ‘spam’ and ‘not spam’ in email service providers, can be an example of a classification problem. There are several forms of classification analysis available in the area such as binary classification—which refers to the prediction of one of two classes; multi-class classification—which involves the prediction of one of more than two classes; multi-label classification—a generalization of multiclass classification in which the problem’s classes are organized hierarchically [105].
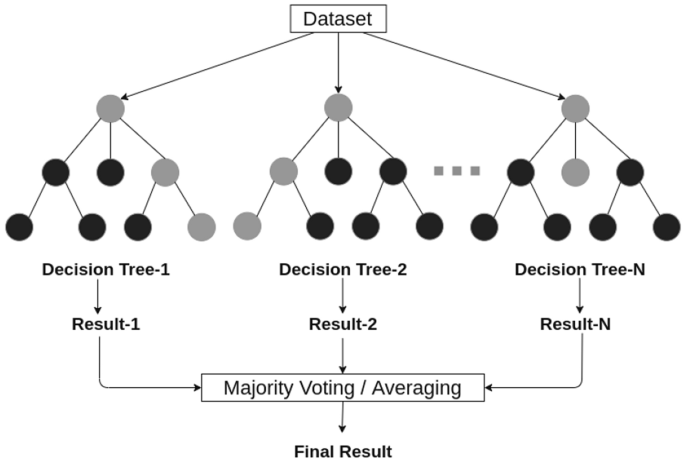
An example of a random forest structure considering multiple decision trees
Several popular classification techniques, such as k-nearest neighbors [5], support vector machines [55], navies Bayes [49], adaptive boosting [32], extreme gradient boosting [85], logistic regression [66], decision trees ID3 [92], C4.5 [93], and random forests [13] exist to solve classification problems. The tree-based classification technique, e.g., random forest considering multiple decision trees, performs better than others to solve real-world problems in many cases as due to its capability of producing logic rules [103, 115]. Figure 4 shows an example of a random forest structure considering multiple decision trees. In addition, BehavDT recently proposed by Sarker et al. [109], and IntrudTree [106] can be used for building effective classification or prediction models in the relevant tasks within the domain of data science and analytics.
Cluster Analysis
Clustering is a form of unsupervised machine learning technique and is well-known in many data science application areas for statistical data analysis [38]. Usually, clustering techniques search for the structures inside a dataset and, if the classification is not previously identified, classify homogeneous groups of cases. This means that data points are identical to each other within a cluster, and different from data points in another cluster. Overall, the purpose of cluster analysis is to sort various data points into groups (or clusters) that are homogeneous internally and heterogeneous externally [105]. To gain insight into how data is distributed in a given dataset or as a preprocessing phase for other algorithms, clustering is often used. Data clustering, for example, assists with customer shopping behavior, sales campaigns, and retention of consumers for retail businesses, anomaly detection, etc.
Many clustering algorithms with the ability to group data have been proposed in machine learning and data science literature [98, 138, 141]. In our earlier paper Sarker et al. [105], we have summarized this based on several perspectives, such as partitioning methods, density-based methods, hierarchical-based methods, model-based methods, etc. In the literature, the popular K-means [75], K-Mediods [84], CLARA [54] etc. are known as partitioning methods; DBSCAN [30], OPTICS [8] etc. are known as density-based methods; single linkage [122], complete linkage [123], etc. are known as hierarchical methods. In addition, grid-based clustering methods, such as STING [134], CLIQUE [2], etc.; model-based clustering such as neural network learning [141], GMM [94], SOM [18, 104], etc.; constrained-based methods such as COP K-means [131], CMWK-Means [25], etc. are used in the area. Recently, Sarker et al. [111] proposed a hierarchical clustering method, BOTS [111] based on bottom-up agglomerative technique for capturing user’s similar behavioral characteristics over time. The key benefit of agglomerative hierarchical clustering is that the tree-structure hierarchy created by agglomerative clustering is more informative than an unstructured set of flat clusters, which can assist in better decision-making in relevant application areas in data science.
Association Rule Analysis
Association rule learning is known as a rule-based machine learning system, an unsupervised learning method is typically used to establish a relationship among variables. This is a descriptive technique often used to analyze large datasets for discovering interesting relationships or patterns. The association learning technique’s main strength is its comprehensiveness, as it produces all associations that meet user-specified constraints including minimum support and confidence value [138].
Association rules allow a data scientist to identify trends, associations, and co-occurrences between data sets inside large data collections. In a supermarket, for example, associations infer knowledge about the buying behavior of consumers for different items, which helps to change the marketing and sales plan. In healthcare, to better diagnose patients, physicians may use association guidelines. Doctors can assess the conditional likelihood of a given illness by comparing symptom associations in the data from previous cases using association rules and machine learning-based data analysis. Similarly, association rules are useful for consumer behavior analysis and prediction, customer market analysis, bioinformatics, weblog mining, recommendation systems, etc.
Several types of association rules have been proposed in the area, such as frequent pattern based [4, 47, 73], logic-based [31], tree-based [39], fuzzy-rules [126], belief rule [148] etc. The rule learning techniques such as AIS [3], Apriori [4], Apriori-TID and Apriori-Hybrid [4], FP-Tree [39], Eclat [144], RARM [24] exist to solve the relevant business problems. Apriori [4] is the most commonly used algorithm for discovering association rules from a given dataset among the association rule learning techniques [145]. The recent association rule-learning technique ABC-RuleMiner proposed in our earlier paper by Sarker et al. [113] could give significant results in terms of generating non-redundant rules that can be used for smart decision making according to human preferences, within the area of data science applications.
Time-Series Analysis and Forecasting
A time series is typically a series of data points indexed in time order particularly, by date, or timestamp [111]. Depending on the frequency, the time-series can be different types such as annually, e.g., annual budget, quarterly, e.g., expenditure, monthly, e.g., air traffic, weekly, e.g., sales quantity, daily, e.g., weather, hourly, e.g., stock price, minute-wise, e.g., inbound calls in a call center, and even second-wise, e.g., web traffic, and so on in relevant domains.
A mathematical method dealing with such time-series data, or the procedure of fitting a time series to a proper model is termed time-series analysis. Many different time series forecasting algorithms and analysis methods can be applied to extract the relevant information. For instance, to do time-series forecasting for future patterns, the autoregressive (AR) model [130] learns the behavioral trends or patterns of past data. Moving average (MA) [40] is another simple and common form of smoothing used in time series analysis and forecasting that uses past forecasted errors in a regression-like model to elaborate an averaged trend across the data. The autoregressive moving average (ARMA) [12, 120] combines these two approaches, where autoregressive extracts the momentum and pattern of the trend and moving average capture the noise effects. The most popular and frequently used time-series model is the autoregressive integrated moving average (ARIMA) model [12, 120]. ARIMA model, a generalization of an ARMA model, is more flexible than other statistical models such as exponential smoothing or simple linear regression. In terms of data, the ARMA model can only be used for stationary time-series data, while the ARIMA model includes the case of non-stationarity as well. Similarly, seasonal autoregressive integrated moving average (SARIMA), autoregressive fractionally integrated moving average (ARFIMA), autoregressive moving average model with exogenous inputs model (ARMAX model) are also used in time-series models [120].
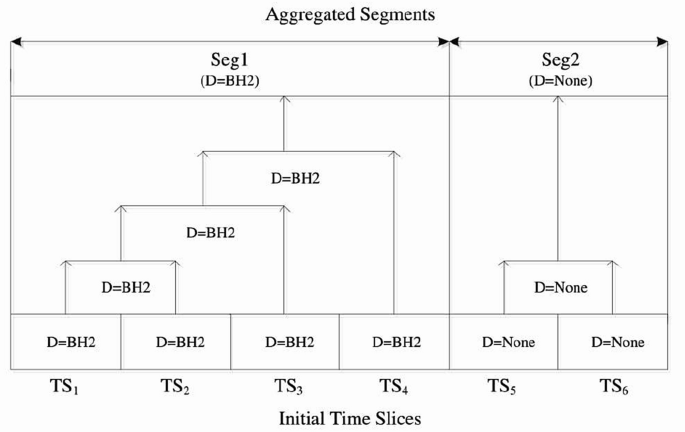
An example of producing aggregate time segments from initial time slices based on similar behavioral characteristics
In addition to the stochastic methods for time-series modeling and forecasting, machine and deep learning-based approach can be used for effective time-series analysis and forecasting. For instance, in our earlier paper, Sarker et al. [111] present a bottom-up clustering-based time-series analysis to capture the mobile usage behavioral patterns of the users. Figure 5 shows an example of producing aggregate time segments Seg_i from initial time slices TS_i based on similar behavioral characteristics that are used in our bottom-up clustering approach, where D represents the dominant behavior BH_i of the users, mentioned above [111]. The authors in [118], used a long short-term memory (LSTM) model, a kind of recurrent neural network (RNN) deep learning model, in forecasting time-series that outperform traditional approaches such as the ARIMA model. Time-series analysis is commonly used these days in various fields such as financial, manufacturing, business, social media, event data (e.g., clickstreams and system events), IoT and smartphone data, and generally in any applied science and engineering temporal measurement domain. Thus, it covers a wide range of application areas in data science.
Opinion Mining and Sentiment Analysis
Sentiment analysis or opinion mining is the computational study of the opinions, thoughts, emotions, assessments, and attitudes of people towards entities such as products, services, organizations, individuals, issues, events, topics, and their attributes [71]. There are three kinds of sentiments: positive, negative, and neutral, along with more extreme feelings such as angry, happy and sad, or interested or not interested, etc. More refined sentiments to evaluate the feelings of individuals in various situations can also be found according to the problem domain.
Although the task of opinion mining and sentiment analysis is very challenging from a technical point of view, it’s very useful in real-world practice. For instance, a business always aims to obtain an opinion from the public or customers about its products and services to refine the business policy as well as a better business decision. It can thus benefit a business to understand the social opinion of their brand, product, or service. Besides, potential customers want to know what consumers believe they have when they use a service or purchase a product. Document-level, sentence level, aspect level, and concept level, are the possible levels of opinion mining in the area [45].
Several popular techniques such as lexicon-based including dictionary-based and corpus-based methods, machine learning including supervised and unsupervised learning, deep learning, and hybrid methods are used in sentiment analysis-related tasks [70]. To systematically define, extract, measure, and analyze affective states and subjective knowledge, it incorporates the use of statistics, natural language processing (NLP), machine learning as well as deep learning methods. Sentiment analysis is widely used in many applications, such as reviews and survey data, web and social media, and healthcare content, ranging from marketing and customer support to clinical practice. Thus sentiment analysis has a big influence in many data science applications, where public sentiment is involved in various real-world issues.
Behavioral Data and Cohort Analysis
Behavioral analytics is a recent trend that typically reveals new insights into e-commerce sites, online gaming, mobile and smartphone applications, IoT user behavior, and many more [112]. The behavioral analysis aims to understand how and why the consumers or users behave, allowing accurate predictions of how they are likely to behave in the future. For instance, it allows advertisers to make the best offers with the right client segments at the right time. Behavioral analytics, including traffic data such as navigation paths, clicks, social media interactions, purchase decisions, and marketing responsiveness, use the large quantities of raw user event information gathered during sessions in which people use apps, games, or websites. In our earlier papers Sarker et al. [101, 111, 113] we have discussed how to extract users phone usage behavioral patterns utilizing real-life phone log data for various purposes.
In the real-world scenario, behavioral analytics is often used in e-commerce, social media, call centers, billing systems, IoT systems, political campaigns, and other applications, to find opportunities for optimization to achieve particular outcomes. Cohort analysis is a branch of behavioral analytics that involves studying groups of people over time to see how their behavior changes. For instance, it takes data from a given data set (e.g., an e-commerce website, web application, or online game) and separates it into related groups for analysis. Various machine learning techniques such as behavioral data clustering [111], behavioral decision tree classification [109], behavioral association rules [113], etc. can be used in the area according to the goal. Besides, the concept of RecencyMiner, proposed in our earlier paper Sarker et al. [108] that takes into account recent behavioral patterns could be effective while analyzing behavioral data as it may not be static in the real-world changes over time.
Anomaly Detection or Outlier Analysis
Anomaly detection, also known as Outlier analysis is a data mining step that detects data points, events, and/or findings that deviate from the regularities or normal behavior of a dataset. Anomalies are usually referred to as outliers, abnormalities, novelties, noise, inconsistency, irregularities, and exceptions [63, 114]. Techniques of anomaly detection may discover new situations or cases as deviant based on historical data through analyzing the data patterns. For instance, identifying fraud or irregular transactions in finance is an example of anomaly detection.
It is often used in preprocessing tasks for the deletion of anomalous or inconsistency in the real-world data collected from various data sources including user logs, devices, networks, and servers. For anomaly detection, several machine learning techniques can be used, such as k-nearest neighbors, isolation forests, cluster analysis, etc [105]. The exclusion of anomalous data from the dataset also results in a statistically significant improvement in accuracy during supervised learning [101]. However, extracting appropriate features, identifying normal behaviors, managing imbalanced data distribution, addressing variations in abnormal behavior or irregularities, the sparse occurrence of abnormal events, environmental variations, etc. could be challenging in the process of anomaly detection. Detection of anomalies can be applicable in a variety of domains such as cybersecurity analytics, intrusion detections, fraud detection, fault detection, health analytics, identifying irregularities, detecting ecosystem disturbances, and many more. This anomaly detection can be considered a significant task for building effective systems with higher accuracy within the area of data science.
Factor Analysis
Factor analysis is a collection of techniques for describing the relationships or correlations between variables in terms of more fundamental entities known as factors [23]. It’s usually used to organize variables into a small number of clusters based on their common variance, where mathematical or statistical procedures are used. The goals of factor analysis are to determine the number of fundamental influences underlying a set of variables, calculate the degree to which each variable is associated with the factors, and learn more about the existence of the factors by examining which factors contribute to output on which variables. The broad purpose of factor analysis is to summarize data so that relationships and patterns can be easily interpreted and understood [143].
Exploratory factor analysis (EFA) and confirmatory factor analysis (CFA) are the two most popular factor analysis techniques. EFA seeks to discover complex trends by analyzing the dataset and testing predictions, while CFA tries to validate hypotheses and uses path analysis diagrams to represent variables and factors [143]. Factor analysis is one of the algorithms for unsupervised machine learning that is used for minimizing dimensionality. The most common methods for factor analytics are principal components analysis (PCA), principal axis factoring (PAF), and maximum likelihood (ML) [48]. Methods of correlation analysis such as Pearson correlation, canonical correlation, etc. may also be useful in the field as they can quantify the statistical relationship between two continuous variables, or association. Factor analysis is commonly used in finance, marketing, advertising, product management, psychology, and operations research, and thus can be considered as another significant analytical method within the area of data science.
Log Analysis
Logs are commonly used in system management as logs are often the only data available that record detailed system runtime activities or behaviors in production [44]. Log analysis is thus can be considered as the method of analyzing, interpreting, and capable of understanding computer-generated records or messages, also known as logs. This can be device log, server log, system log, network log, event log, audit trail, audit record, etc. The process of creating such records is called data logging.
Logs are generated by a wide variety of programmable technologies, including networking devices, operating systems, software, and more. Phone call logs [88, 110], SMS Logs [28], mobile apps usages logs [124, 149], notification logs [77], game Logs [82], context logs [16, 149], web logs [37], smartphone life logs [95], etc. are some examples of log data for smartphone devices. The main characteristics of these log data is that it contains users’ actual behavioral activities with their devices. Similar other log data can be search logs [50, 133], application logs [26], server logs [33], network logs [57], event logs [83], network and security logs [142] etc.
Several techniques such as classification and tagging, correlation analysis, pattern recognition methods, anomaly detection methods, machine learning modeling, etc. [105] can be used for effective log analysis. Log analysis can assist in compliance with security policies and industry regulations, as well as provide a better user experience by encouraging the troubleshooting of technical problems and identifying areas where efficiency can be improved. For instance, web servers use log files to record data about website visitors. Windows event log analysis can help an investigator draw a timeline based on the logging information and the discovered artifacts. Overall, advanced analytics methods by taking into account machine learning modeling can play a significant role to extract insightful patterns from these log data, which can be used for building automated and smart applications, and thus can be considered as a key working area in data science.
Neural Networks and Deep Learning Analysis
Deep learning is a form of machine learning that uses artificial neural networks to create a computational architecture that learns from data by combining multiple processing layers, such as the input, hidden, and output layers [38]. The key benefit of deep learning over conventional machine learning methods is that it performs better in a variety of situations, particularly when learning from large datasets [114, 140].
The most common deep learning algorithms are: multi-layer perceptron (MLP) [85], convolutional neural network (CNN or ConvNet) [67], long short term memory recurrent neural network (LSTM-RNN) [34]. Figure 6 shows a structure of an artificial neural network modeling with multiple processing layers. The Backpropagation technique [38] is used to adjust the weight values internally while building the model. Convolutional neural networks (CNNs) [67] improve on the design of traditional artificial neural networks (ANNs), which include convolutional layers, pooling layers, and fully connected layers. It is commonly used in a variety of fields, including natural language processing, speech recognition, image processing, and other autocorrelated data since it takes advantage of the two-dimensional (2D) structure of the input data. AlexNet [60], Xception [21], Inception [125], Visual Geometry Group (VGG) [42], ResNet [43], etc., and other advanced deep learning models based on CNN are also used in the field.
In addition to CNN, recurrent neural network (RNN) architecture is another popular method used in deep learning. Long short-term memory (LSTM) is a popular type of recurrent neural network architecture used broadly in the area of deep learning. Unlike traditional feed-forward neural networks, LSTM has feedback connections. Thus, LSTM networks are well-suited for analyzing and learning sequential data, such as classifying, sorting, and predicting data based on time-series data. Therefore, when the data is in a sequential format, such as time, sentence, etc., LSTM can be used, and it is widely used in the areas of time-series analysis, natural language processing, speech recognition, and so on.
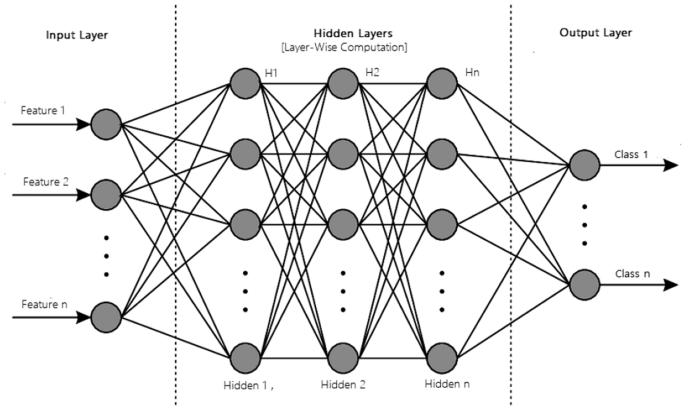
A structure of an artificial neural network modeling with multiple processing layers
In addition to the most popular deep learning methods mentioned above, several other deep learning approaches [104] exist in the field for various purposes. The self-organizing map (SOM) [58], for example, uses unsupervised learning to represent high-dimensional data as a 2D grid map, reducing dimensionality. Another learning technique that is commonly used for dimensionality reduction and feature extraction in unsupervised learning tasks is the autoencoder (AE) [10]. Restricted Boltzmann machines (RBM) can be used for dimensionality reduction, classification, regression, collaborative filtering, feature learning, and topic modeling, according to [46]. A deep belief network (DBN) is usually made up of a backpropagation neural network and unsupervised networks like restricted Boltzmann machines (RBMs) or autoencoders (BPNN) [136]. A generative adversarial network (GAN) [35] is a deep learning network that can produce data with characteristics that are similar to the input data. Transfer learning is common worldwide presently because it can train deep neural networks with a small amount of data, which is usually the re-use of a pre-trained model on a new problem [137]. These deep learning methods can perform well, particularly, when learning from large-scale datasets [105, 140]. In our previous article Sarker et al. [104], we have summarized a brief discussion of various artificial neural networks (ANN) and deep learning (DL) models mentioned above, which can be used in a variety of data science and analytics tasks.
Real-World Application Domains
Almost every industry or organization is impacted by data, and thus “Data Science” including advanced analytics with machine learning modeling can be used in business, marketing, finance, IoT systems, cybersecurity, urban management, health care, government policies, and every possible industries, where data gets generated. In the following, we discuss ten most popular application areas based on data science and analytics.
-
Business or financial data science: In general, business data science can be considered as the study of business or e-commerce data to obtain insights about a business that can typically lead to smart decision-making as well as taking high-quality actions [90]. Data scientists can develop algorithms or data-driven models predicting customer behavior, identifying patterns and trends based on historical business data, which can help companies to reduce costs, improve service delivery, and generate recommendations for better decision-making. Eventually, business automation, intelligence, and efficiency can be achieved through the data science process discussed earlier, where various advanced analytics methods and machine learning modeling based on the collected data are the keys. Many online retailers, such as Amazon [76], can improve inventory management, avoid out-of-stock situations, and optimize logistics and warehousing using predictive modeling based on machine learning techniques [105]. In terms of finance, the historical data is related to financial institutions to make high-stakes business decisions, which is mostly used for risk management, fraud prevention, credit allocation, customer analytics, personalized services, algorithmic trading, etc. Overall, data science methodologies can play a key role in the future generation business or finance industry, particularly in terms of business automation, intelligence, and smart decision-making and systems.
-
Manufacturing or industrial data science: To compete in global production capability, quality, and cost, manufacturing industries have gone through many industrial revolutions [14]. The latest fourth industrial revolution, also known as Industry 4.0, is the emerging trend of automation and data exchange in manufacturing technology. Thus industrial data science, which is the study of industrial data to obtain insights that can typically lead to optimizing industrial applications, can play a vital role in such revolution. Manufacturing industries generate a large amount of data from various sources such as sensors, devices, networks, systems, and applications [6, 68]. The main categories of industrial data include large-scale data devices, life-cycle production data, enterprise operation data, manufacturing value chain sources, and collaboration data from external sources [132]. The data needs to be processed, analyzed, and secured to help improve the system’s efficiency, safety, and scalability. Data science modeling thus can be used to maximize production, reduce costs and raise profits in manufacturing industries.
-
Medical or health data science: Healthcare is one of the most notable fields where data science is making major improvements. Health data science involves the extrapolation of actionable insights from sets of patient data, typically collected from electronic health records. To help organizations, improve the quality of treatment, lower the cost of care, and improve the patient experience, data can be obtained from several sources, e.g., the electronic health record, billing claims, cost estimates, and patient satisfaction surveys, etc., to analyze. In reality, healthcare analytics using machine learning modeling can minimize medical costs, predict infectious outbreaks, prevent preventable diseases, and generally improve the quality of life [81, 119]. Across the global population, the average human lifespan is growing, presenting new challenges to today’s methods of delivery of care. Thus health data science modeling can play a role in analyzing current and historical data to predict trends, improve services, and even better monitor the spread of diseases. Eventually, it may lead to new approaches to improve patient care, clinical expertise, diagnosis, and management.
-
IoT data science: Internet of things (IoT) [9] is a revolutionary technical field that turns every electronic system into a smarter one and is therefore considered to be the big frontier that can enhance almost all activities in our lives. Machine learning has become a key technology for IoT applications because it uses expertise to identify patterns and generate models that help predict future behavior and events [112]. One of the IoT’s main fields of application is a smart city, which uses technology to improve city services and citizens’ living experiences. For example, using the relevant data, data science methods can be used for traffic prediction in smart cities, to estimate the total usage of energy of the citizens for a particular period. Deep learning-based models in data science can be built based on a large scale of IoT datasets [7, 104]. Overall, data science and analytics approaches can aid modeling in a variety of IoT and smart city services, including smart governance, smart homes, education, connectivity, transportation, business, agriculture, health care, and industry, and many others.
-
Cybersecurity data science: Cybersecurity, or the practice of defending networks, systems, hardware, and data from digital attacks, is one of the most important fields of Industry 4.0 [114, 121]. Data science techniques, particularly machine learning, have become a crucial cybersecurity technology that continually learns to identify trends by analyzing data, better detecting malware in encrypted traffic, finding insider threats, predicting where bad neighborhoods are online, keeping people safe while surfing, or protecting information in the cloud by uncovering suspicious user activity [114]. For instance, machine learning and deep learning-based security modeling can be used to effectively detect various types of cyberattacks or anomalies [103, 106]. To generate security policy rules, association rule learning can play a significant role to build rule-based systems [102]. Deep learning-based security models can perform better when utilizing the large scale of security datasets [140]. Thus data science modeling can enable professionals in cybersecurity to be more proactive in preventing threats and reacting in real-time to active attacks, through extracting actionable insights from the security datasets.
-
Behavioral data science: Behavioral data is information produced as a result of activities, most commonly commercial behavior, performed on a variety of Internet-connected devices, such as a PC, tablet, or smartphones [112]. Websites, mobile applications, marketing automation systems, call centers, help desks, and billing systems, etc. are all common sources of behavioral data. Behavioral data is much more than just data, which is not static data [108]. Advanced analytics of these data including machine learning modeling can facilitate in several areas such as predicting future sales trends and product recommendations in e-commerce and retail; predicting usage trends, load, and user preferences in future releases in online gaming; determining how users use an application to predict future usage and preferences in application development; breaking users down into similar groups to gain a more focused understanding of their behavior in cohort analysis; detecting compromised credentials and insider threats by locating anomalous behavior, or making suggestions, etc. Overall, behavioral data science modeling typically enables to make the right offers to the right consumers at the right time on various common platforms such as e-commerce platforms, online games, web and mobile applications, and IoT. In social context, analyzing the behavioral data of human being using advanced analytics methods and the extracted insights from social data can be used for data-driven intelligent social services, which can be considered as social data science.
-
Mobile data science: Today’s smart mobile phones are considered as “next-generation, multi-functional cell phones that facilitate data processing, as well as enhanced wireless connectivity” [146]. In our earlier paper [112], we have shown that users’ interest in “Mobile Phones” is more and more than other platforms like “Desktop Computer”, “Laptop Computer” or “Tablet Computer” in recent years. People use smartphones for a variety of activities, including e-mailing, instant messaging, online shopping, Internet surfing, entertainment, social media such as Facebook, Linkedin, and Twitter, and various IoT services such as smart cities, health, and transportation services, and many others. Intelligent apps are based on the extracted insight from the relevant datasets depending on apps characteristics, such as action-oriented, adaptive in nature, suggestive and decision-oriented, data-driven, context-awareness, and cross-platform operation [112]. As a result, mobile data science, which involves gathering a large amount of mobile data from various sources and analyzing it using machine learning techniques to discover useful insights or data-driven trends, can play an important role in the development of intelligent smartphone applications.
-
Multimedia data science: Over the last few years, a big data revolution in multimedia management systems has resulted from the rapid and widespread use of multimedia data, such as image, audio, video, and text, as well as the ease of access and availability of multimedia sources. Currently, multimedia sharing websites, such as Yahoo Flickr, iCloud, and YouTube, and social networks such as Facebook, Instagram, and Twitter, are considered as valuable sources of multimedia big data [89]. People, particularly younger generations, spend a lot of time on the Internet and social networks to connect with others, exchange information, and create multimedia data, thanks to the advent of new technology and the advanced capabilities of smartphones and tablets. Multimedia analytics deals with the problem of effectively and efficiently manipulating, handling, mining, interpreting, and visualizing various forms of data to solve real-world problems. Text analysis, image or video processing, computer vision, audio or speech processing, and database management are among the solutions available for a range of applications including healthcare, education, entertainment, and mobile devices.
-
Smart cities or urban data science: Today, more than half of the world’s population live in urban areas or cities [80] and considered as drivers or hubs of economic growth, wealth creation, well-being, and social activity [96, 116]. In addition to cities, “Urban area” can refer to the surrounding areas such as towns, conurbations, or suburbs. Thus, a large amount of data documenting daily events, perceptions, thoughts, and emotions of citizens or people are recorded, that are loosely categorized into personal data, e.g., household, education, employment, health, immigration, crime, etc., proprietary data, e.g., banking, retail, online platforms data, etc., government data, e.g., citywide crime statistics, or government institutions, etc., Open and public data, e.g., data.gov, ordnance survey, and organic and crowdsourced data, e.g., user-generated web data, social media, Wikipedia, etc. [29]. The field of urban data science typically focuses on providing more effective solutions from a data-driven perspective, through extracting knowledge and actionable insights from such urban data. Advanced analytics of these data using machine learning techniques [105] can facilitate the efficient management of urban areas including real-time management, e.g., traffic flow management, evidence-based planning decisions which pertain to the longer-term strategic role of forecasting for urban planning, e.g., crime prevention, public safety, and security, or framing the future, e.g., political decision-making [29]. Overall, it can contribute to government and public planning, as well as relevant sectors including retail, financial services, mobility, health, policing, and utilities within a data-rich urban environment through data-driven smart decision-making and policies, which lead to smart cities and improve the quality of human life.
-
Smart villages or rural data science: Rural areas or countryside are the opposite of urban areas, that include villages, hamlets, or agricultural areas. The field of rural data science typically focuses on making better decisions and providing more effective solutions that include protecting public safety, providing critical health services, agriculture, and fostering economic development from a data-driven perspective, through extracting knowledge and actionable insights from the collected rural data. Advanced analytics of rural data including machine learning [105] modeling can facilitate providing new opportunities for them to build insights and capacity to meet current needs and prepare for their futures. For instance, machine learning modeling [105] can help farmers to enhance their decisions to adopt sustainable agriculture utilizing the increasing amount of data captured by emerging technologies, e.g., the internet of things (IoT), mobile technologies and devices, etc. [1, 51, 52]. Thus, rural data science can play a very important role in the economic and social development of rural areas, through agriculture, business, self-employment, construction, banking, healthcare, governance, or other services, etc. that lead to smarter villages.
Overall, we can conclude that data science modeling can be used to help drive changes and improvements in almost every sector in our real-world life, where the relevant data is available to analyze. To gather the right data and extract useful knowledge or actionable insights from the data for making smart decisions is the key to data science modeling in any application domain. Based on our discussion on the above ten potential real-world application domains by taking into account data-driven smart computing and decision making, we can say that the prospects of data science and the role of data scientists are huge for the future world. The “Data Scientists” typically analyze information from multiple sources to better understand the data and business problems, and develop machine learning-based analytical modeling or algorithms, or data-driven tools, or solutions, focused on advanced analytics, which can make today’s computing process smarter, automated, and intelligent.
Challenges and Research Directions
Our study on data science and analytics, particularly data science modeling in “Understanding data science modeling”, advanced analytics methods and smart computing in “Advanced analytics methods and smart computing”, and real-world application areas in “Real-world application domains” open several research issues in the area of data-driven business solutions and eventual data products. Thus, in this section, we summarize and discuss the challenges faced and the potential research opportunities and future directions to build data-driven products.
-
Understanding the real-world business problems and associated data including nature, e.g., what forms, type, size, labels, etc., is the first challenge in the data science modeling, discussed briefly in “Understanding data science modeling”. This is actually to identify, specify, represent and quantify the domain-specific business problems and data according to the requirements. For a data-driven effective business solution, there must be a well-defined workflow before beginning the actual data analysis work. Furthermore, gathering business data is difficult because data sources can be numerous and dynamic. As a result, gathering different forms of real-world data, such as structured, or unstructured, related to a specific business issue with legal access, which varies from application to application, is challenging. Moreover, data annotation, which is typically the process of categorization, tagging, or labeling of raw data, for the purpose of building data-driven models, is another challenging issue. Thus, the primary task is to conduct a more in-depth analysis of data collection and dynamic annotation methods. Therefore, understanding the business problem, as well as integrating and managing the raw data gathered for efficient data analysis, may be one of the most challenging aspects of working in the field of data science and analytics.
-
The next challenge is the extraction of the relevant and accurate information from the collected data mentioned above. The main focus of data scientists is typically to disclose, describe, represent, and capture data-driven intelligence for actionable insights from data. However, the real-world data may contain many ambiguous values, missing values, outliers, and meaningless data [101]. The advanced analytics methods including machine and deep learning modeling, discussed in “Advanced analytics methods and smart computing”, highly impact the quality, and availability of the data. Thus understanding real-world business scenario and associated data, to whether, how, and why they are insufficient, missing, or problematic, then extend or redevelop the existing methods, such as large-scale hypothesis testing, learning inconsistency, and uncertainty, etc. to address the complexities in data and business problems is important. Therefore, developing new techniques to effectively pre-process the diverse data collected from multiple sources, according to their nature and characteristics could be another challenging task.
-
Understanding and selecting the appropriate analytical methods to extract the useful insights for smart decision-making for a particular business problem is the main issue in the area of data science. The emphasis of advanced analytics is more on anticipating the use of data to detect patterns to determine what is likely to occur in the future. Basic analytics offer a description of data in general, while advanced analytics is a step forward in offering a deeper understanding of data and helping to granular data analysis. Thus, understanding the advanced analytics methods, especially machine and deep learning-based modeling is the key. The traditional learning techniques mentioned in “Advanced analytics methods and smart computing” may not be directly applicable for the expected outcome in many cases. For instance, in a rule-based system, the traditional association rule learning technique [4] may produce redundant rules from the data that makes the decision-making process complex and ineffective [113]. Thus, a scientific understanding of the learning algorithms, mathematical properties, how the techniques are robust or fragile to input data, is needed to understand. Therefore, a deeper understanding of the strengths and drawbacks of the existing machine and deep learning methods [38, 105] to solve a particular business problem is needed, consequently to improve or optimize the learning algorithms according to the data characteristics, or to propose the new algorithm/techniques with higher accuracy becomes a significant challenging issue for the future generation data scientists.
-
The traditional data-driven models or systems typically use a large amount of business data to generate data-driven decisions. In several application fields, however, the new trends are more likely to be interesting and useful for modeling and predicting the future than older ones. For example, smartphone user behavior modeling, IoT services, stock market forecasting, health or transport service, job market analysis, and other related areas where time-series and actual human interests or preferences are involved over time. Thus, rather than considering the traditional data analysis, the concept of RecencyMiner, i.e., recent pattern-based extracted insight or knowledge proposed in our earlier paper Sarker et al. [108] might be effective. Therefore, to propose the new techniques by taking into account the recent data patterns, and consequently to build a recency-based data-driven model for solving real-world problems, is another significant challenging issue in the area.
-
The most crucial task for a data-driven smart system is to create a framework that supports data science modeling discussed in “Understanding data science modeling”. As a result, advanced analytical methods based on machine learning or deep learning techniques can be considered in such a system to make the framework capable of resolving the issues. Besides, incorporating contextual information such as temporal context, spatial context, social context, environmental context, etc. [100] can be used for building an adaptive, context-aware, and dynamic model or framework, depending on the problem domain. As a result, a well-designed data-driven framework, as well as experimental evaluation, is a very important direction to effectively solve a business problem in a particular domain, as well as a big challenge for the data scientists.
-
In several important application areas such as autonomous cars, criminal justice, health care, recruitment, housing, management of the human resource, public safety, where decisions made by models, or AI agents, have a direct effect on human lives. As a result, there is growing concerned about whether these decisions can be trusted, to be right, reasonable, ethical, personalized, accurate, robust, and secure, particularly in the context of adversarial attacks [104]. If we can explain the result in a meaningful way, then the model can be better trusted by the end-user. For machine-learned models, new trust properties yield new trade-offs, such as privacy versus accuracy; robustness versus efficiency; fairness versus robustness. Therefore, incorporating trustworthy AI particularly, data-driven or machine learning modeling could be another challenging issue in the area.
In the above, we have summarized and discussed several challenges and the potential research opportunities and directions, within the scope of our study in the area of data science and advanced analytics. The data scientists in academia/industry and the researchers in the relevant area have the opportunity to contribute to each issue identified above and build effective data-driven models or systems, to make smart decisions in the corresponding business domains.
Conclusion
In this paper, we have presented a comprehensive view on data science including various types of advanced analytical methods that can be applied to enhance the intelligence and the capabilities of an application. We have also visualized the current popularity of data science and machine learning-based advanced analytical modeling and also differentiate these from the relevant terms used in the area, to make the position of this paper. A thorough study on the data science modeling with its various processing modules that are needed to extract the actionable insights from the data for a particular business problem and the eventual data product. Thus, according to our goal, we have briefly discussed how different data modules can play a significant role in a data-driven business solution through the data science process. For this, we have also summarized various types of advanced analytical methods and outcomes as well as machine learning modeling that are needed to solve the associated business problems. Thus, this study’s key contribution has been identified as the explanation of different advanced analytical methods and their applicability in various real-world data-driven applications areas including business, healthcare, cybersecurity, urban and rural data science, and so on by taking into account data-driven smart computing and decision making.
Finally, within the scope of our study, we have outlined and discussed the challenges we faced, as well as possible research opportunities and future directions. As a result, the challenges identified provide promising research opportunities in the field that can be explored with effective solutions to improve the data-driven model and systems. Overall, we conclude that our study of advanced analytical solutions based on data science and machine learning methods, leads in a positive direction and can be used as a reference guide for future research and applications in the field of data science and its real-world applications by both academia and industry professionals.
References
Adnan N, Nordin SM, Rahman I, Noor A. The effects of knowledge transfer on farmers decision making toward sustainable agriculture practices. World J Sci Technol Sustain Dev. 2018.
Agrawal R, Gehrke J, Gunopulos D, Raghavan P. Automatic subspace clustering of high dimensional data for data mining applications. In: Proceedings of the 1998 ACM SIGMOD international conference on management of data. 1998. p. 94–105.
Agrawal R, Imieliński T, Swami A. Mining association rules between sets of items in large databases. In: ACM SIGMOD record, vol 22. ACM. 1993. p. 207–16.
Agrawal R, Srikant R. Fast algorithms for mining association rules. In: Proceedings of the international joint conference on very large data bases, Santiago, Chile, vol 1215. 1994. p. 487–99.
Aha DW, Kibler D, Albert MK. Instance-based learning algorithms. Mach Learn. 1991;6(1):37–66.
Al-Abassi A, Karimipour H, HaddadPajouh H, Dehghantanha A, Parizi RM. Industrial big data analytics: challenges and opportunities. In: Handbook of big data privacy. Springer; 2020. p. 37–61.
Al-Garadi MA, Mohamed A, Al-Ali AK, Du X, Ali I, Guizani M. A survey of machine and deep learning methods for internet of things (iot) security. IEEE Commun Surv Tutor. 2020;22(3):1646–85.
Ankerst M, Breunig MM, Kriegel H-P, Sander J. Optics: ordering points to identify the clustering structure. ACM Sigmod Rec. 1999;28(2):49–60.
Atzori L, Iera A, Morabito G. The internet of things: a survey. Comput Netw. 2010;54(15):2787–805.
Baldi P. Autoencoders, unsupervised learning, and deep architectures. In: Proceedings of ICML workshop on unsupervised and transfer learning. 2012. p. 37–49.
Balducci F, Impedovo D, Pirlo G. Machine learning applications on agricultural datasets for smart farm enhancement. Machines. 2018;6(3):38.
Box GEP, Jenkins GM, Reinsel GC, Ljung GM. Time series analysis: forecasting and control. New York: Wiley; 2015.
Breiman L. Random forests. Mach Learn. 2001;45(1):5–32.
Brettel M, Friederichsen N, Keller M, Rosenberg M. How virtualization, decentralization and network building change the manufacturing landscape: an industry 4.0 perspective. FormaMente 2017;12.
Canadian institute of cybersecurity. University of new Brunswick, iscx dataset. http://www.unb.ca/cic/datasets/index.html/. Accessed 20 Oct 2019.
Cao H, Bao T, Yang Q, Chen E, Tian J. An effective approach for mining mobile user habits. In: Proceedings of the international conference on information and knowledge management, Toronto, ON, Canada, 26–30 October. New York: ACM; 2010. p. 1677–80.
Cao L. Data science: a comprehensive overview. ACM Comput Surv (CSUR). 2017;50(3):1–42.
Carpenter GA, Grossberg S. A massively parallel architecture for a self-organizing neural pattern recognition machine. Comput Vis Graph Image Process. 1987;37(1):54–115.
Cervone HF. Informatics and data science: an overview for the information professional. Digital Library Perspectives. 2016.
Chessel A. An overview of data science uses in bioimage informatics. Methods. 2017;115:110–8.
Chollet F. Xception: deep learning with depthwise separable convolutions. In: Proceedings of the IEEE conference on computer vision and pattern recognition. 2017. p. 1251–58.
Cic-ddos2019 [online]. https://www.unb.ca/cic/datasets/ddos-2019.html/. Accessed 28 Mar 2020.
Cudeck R. Exploratory factor analysis. In: Handbook of applied multivariate statistics and mathematical modeling. Elsevier. p. 265–96. 2000.
Das A, Ng W-K, Woon Y-K. Rapid association rule mining. In: Proceedings of the tenth international conference on Information and knowledge management. ACM; 2001. p. 474–481.
de Amorim V. Constrained clustering with Minkowski weighted k-means. In: 2012 IEEE 13th international symposium on computational intelligence and informatics (CINTI). IEEE. 2012. p. 13–17.
Dev H, Liu Z. Identifying frequent user tasks from application logs. In: Proceedings of the 22nd international conference on intelligent user interfaces. 2017. p. 263–73.
Donoho D. 50 years of data science. J Comput Graph Stat. 2017;26(4):745–66.
Eagle N, Pentland AS. Reality mining: sensing complex social systems. Pers Ubiquitous Comput. 2006;10(4):255–68.
Engin Z, van Dijk J, Lan T, Longley PA, Treleaven P, Batty M, Penn A. Data-driven urban management: mapping the landscape. J Urban Manag. 2020;9(2):140–50.
Ester M, Kriegel H-P, Sander J, Xiaowei X, et al. A density-based algorithm for discovering clusters in large spatial databases with noise. Kdd. 1996;96:226–31.
Flach PA, Lachiche N. Confirmation-guided discovery of first-order rules with tertius. Mach Learn. 2001;42(1–2):61–95.
Freund Y, Schapire RE, et al. Experiments with a new boosting algorithm. In: Icml, vol 96. Citeseer; 1996. p. 148–156.
Ghavare P, Ahire P. Big data classification of users navigation and behavior using web server logs. In: 2018 fourth international conference on computing communication control and automation (ICCUBEA). IEEE. 2018. p. 1–6.
Goodfellow I, Bengio Y, Courville A, Bengio Y. Deep learning, vol. 1. Cambridge: MIT Press; 2016.
Goodfellow I, Pouget-Abadie J, Mirza M, Xu B, Warde-Farley D, Ozair S, Courville A, Bengio Y. Generative adversarial nets. In: Advances in neural information processing systems. 2014. p. 2672–80.
Google trends. 2019. https://trends.google.com/trends/.
Halvey M, Keane MT, Smyth B. Time based segmentation of log data for user navigation prediction in personalization. In: Proceedings of the international conference on web intelligence, Compiegne, France, 19–22 September. Washington, DC: IEEE Computer Society; 2005. p. 636–40.
Han J, Pei J, Kamber M. Data mining: concepts and techniques. Amsterdam: Elsevier; 2011.
Han J, Pei J, Yin Y. Mining frequent patterns without candidate generation. In: ACM Sigmod Record, vol 29. ACM; 2000. p. 1–12.
Hansun S. A new approach of moving average method in time series analysis. In: 2013 conference on new media studies (CoNMedia). IEEE; 2013. p. 1–4.
Harmon SA, Sanford TH, Xu S, Turkbey EB, Holger R, Ziyue X, Dong Y, Andriy M, Victoria A, Amel A, et al. Artificial intelligence for the detection of covid-19 pneumonia on chest ct using multinational datasets. Nat Commun. 2020;11(1):1–7.
He K, Zhang X, Ren S, Sun J. Spatial pyramid pooling in deep convolutional networks for visual recognition. IEEE Trans Pattern Anal Mach Intell. 2015;37(9):1904–16.
He K, Zhang X, Ren S, Sun J. Deep residual learning for image recognition. In: Proceedings of the IEEE conference on computer vision and pattern recognition. 2016. p. 770–78.
He P, Zhu J, He S, Li J, Lyu MR. Towards automated log parsing for large-scale log data analysis. IEEE Trans Dependable Secure Comput. 2017;15(6):931–44.
Hemmatian F, Sohrabi MK. A survey on classification techniques for opinion mining and sentiment analysis. In: Artificial intelligence review. 2019. p. 1–51.
Hinton GE. A practical guide to training restricted Boltzmann machines. In: Neural networks: tricks of the trade. Springer; 2012. p. 599–619.
Houtsma M, Swami A. Set-oriented mining for association rules in relational databases. In: Proceedings of the eleventh international conference on data engineering. IEEE; 1995. p. 25–33.
Howard MC. A review of exploratory factor analysis decisions and overview of current practices: what we are doing and how can we improve? Int J Hum Comput Interact. 2016;32(1):51–62.
John GH, Langley P. Estimating continuous distributions in Bayesian classifiers. In: Proceedings of the eleventh conference on uncertainty in artificial intelligence. Morgan Kaufmann Publishers Inc.; 1995. p. 338–45.
Kacprzak E, Koesten L, Ibá nez L-D, Blount T, Tennison J, Simperl E. Characterising dataset search-an analysis of search logs and data requests. J Web Semant. 2019;55:37–55.
Kamble SS, Gunasekaran A, Gawankar SA. Sustainable industry 4.0 framework: a systematic literature review identifying the current trends and future perspectives. Process Saf Environ Prot. 2018;117:408–425.
Kamble SS, Gunasekaran A, Gawankar SA. Achieving sustainable performance in a data-driven agriculture supply chain: a review for research and applications. Int J Prod Econ. 2020;219:179–94.
Karpatne A, Atluri G, Faghmous JH, Steinbach M, Banerjee A, Ganguly A, Shekhar S, Samatova N, Kumar V. Theory-guided data science: a new paradigm for scientific discovery from data. IEEE Trans Knowl Data Eng. 2017;29(10):2318–31.
Kaufman L, Rousseeuw PJ. Finding groups in data: an introduction to cluster analysis, vol. 344. New York: Wiley; 2009.
Keerthi SS, Shevade SK, Bhattacharyya C, Murthy KRK. Improvements to Platt’s smo algorithm for svm classifier design. Neural Comput. 2001;13(3):637–49.
Khadse V, Mahalle PN, Biraris SV. An empirical comparison of supervised machine learning algorithms for internet of things data. In: 2018 fourth international conference on computing communication control and automation (ICCUBEA). IEEE; 2018. p. 1–6.
Kimura T, Watanabe A, Toyono T, Ishibashi K. Proactive failure detection learning generation patterns of large-scale network logs. IEICE Trans Commun. 2018.
Kohonen T. The self-organizing map. Proc IEEE. 1990;78(9):1464–80.
Koroniotis N, Moustafa N, Sitnikova E, Turnbull B. Towards the development of realistic botnet dataset in the internet of things for network forensic analytics: bot-iot dataset. Future Gener Comput Syst. 2019;100:779–96.
Krizhevsky A, Sutskever I, Hinton GE. Imagenet classification with deep convolutional neural networks. In: Advances in neural information processing systems. 2012. p. 1097–1105.
Krukovets D, et al. Data science opportunities at central banks: overview. Visnyk Natl Bank Ukr. 2020;249:13–24.
Kulin M, Fortuna C, De Poorter E, Deschrijver D, Moerman I. Data-driven design of intelligent wireless networks: an overview and tutorial. Sensors. 2016;16(6):790.
Kwon D, Kim H, Kim J, Suh SC, Kim I, Kim KJ. A survey of deep learning-based network anomaly detection. Cluster Comput. 2019;22(1):949–61.
Lade P, Ghosh R, Srinivasan S. Manufacturing analytics and industrial internet of things. IEEE Intell Syst. 2017;32(3):74–9.
Larson D, Chang V. A review and future direction of agile, business intelligence, analytics and data science. Int J Inf Manag. 2016;36(5):700–10.
Le Cessie S, Van Houwelingen JC. Ridge estimators in logistic regression. J R Stat Soc Ser C (Applied Statistics). 1992;41(1):191–201.
LeCun Y, Bottou L, Bengio Y, Haffner P. Gradient-based learning applied to document recognition. Proc IEEE. 1998;86(11):2278–324.
Lee J, Bagheri B, Kao H-A. Recent advances and trends of cyber-physical systems and big data analytics in industrial informatics. In: International proceeding of int conference on industrial informatics (INDIN). 2014. p. 1–6.
Leevy JL, Khoshgoftaar TM, Bauder RA, Seliya N. A survey on addressing high-class imbalance in big data. J Big Data. 2018;5(1):42.
Li Z, Fan Y, Jiang B, Lei T, Liu W. A survey on sentiment analysis and opinion mining for social multimedia. Multimed Tools Appl. 2019;78(6):6939–67.
Liu B. Sentiment analysis: mining opinions, sentiments, and emotions. Cambridge: Cambridge University Press; 2020.
Liu J, Tang T, Wang W, Bo X, Kong X, Xia F. A survey of scholarly data visualization. IEEE Access. 2018;6:19205–21.
Ma B, Liu W, Hsu Y. Integrating classification and association rule mining. In: Proceedings of the fourth international conference on knowledge discovery and data mining. 1998.
Ma C, Zhang HH, Wang X. Machine learning for big data analytics in plants. Trends Plant Sci. 2014;19(12):798–808.
MacQueen J, et al. Some methods for classification and analysis of multivariate observations. In: Proceedings of the fifth Berkeley symposium on mathematical statistics and probability, Oakland, CA, USA, vol 1. 1967. p. 281–297.
Marchand A, Marx P. Automated product recommendations with preference-based explanations. J Retail. 2020;96(3):328–43.
Mehrotra A, Hendley R, Musolesi M. Prefminer: mining user’s preferences for intelligent mobile notification management. In: Proceedings of the international joint conference on pervasive and ubiquitous computing, Heidelberg, 12–16 September, ACM, New York. 2016. p. 1223–1234.
Mohamadou Y, Halidou A, Kapen PT. A review of mathematical modeling, artificial intelligence and datasets used in the study, prediction and management of covid-19. Appl Intell. 2020;50(11):3913–25.
Moustafa N, Slay J. Unsw-nb15: a comprehensive data set for network intrusion detection systems (unsw-nb15 network data set). In: 2015 military communications and information systems conference (MilCIS). IEEE. 2015. p. 1–6.
Nations U. Revision of world urbanization prospects. New York: United Nations; 2018.
Nilashi M, Ibrahim O, Ahmadi H, Shahmoradi L. An analytical method for diseases prediction using machine learning techniques. Comput Chem Eng. 2017;106:212–23.
Paireekreng W, Rapeepisarn K, Wong KW. Time-based personalised mobile game downloading. In: Transactions on edutainment II. 2009. p. 59–69.
Pan Y, Zhang L, Li Z. Mining event logs for knowledge discovery based on adaptive efficient fuzzy Kohonen clustering network. Knowl Based Syst. 2020:209.
Park H-S, Jun C-H. A simple and fast algorithm for k-medoids clustering. Expert Syst Appl. 2009;36(2):3336–41.
Pedregosa F, Varoquaux G, Gramfort A, Michel V, Thirion B, Grisel O, Blondel M, Prettenhofer P, Weiss R, Dubourg V, et al. Scikit-learn: machine learning in python. J Mach Learn Res. 2011;12:2825–30.
Perveen S, Shahbaz M, Keshavjee K, Guergachi A. Metabolic syndrome and development of diabetes mellitus: predictive modeling based on machine learning techniques. IEEE Access. 2018;7:1365–75.
Peyré G, Cuturi M, et al. Computational optimal transport: with applications to data science. Found Trends Mach Learn. 2019;11(5–6):355–607.
Phithakkitnukoon S, Dantu R, Claxton R, Eagle N. Behavior-based adaptive call predictor. ACM Trans Auton Adapt Syst. 2011;6(3):21:1–21:28.
Pouyanfar S, Yang Y, Chen S-C, Shyu M-L, Iyengar SS. Multimedia big data analytics: a survey. ACM Comput Surv (CSUR). 2018;51(1):1–34.
Provost F, Fawcett T. Data science for business: what you need to know about data mining and data-analytic thinking. O’Reilly Media, Inc.; 2013.
Qin X, Luo Y, Tang N, Li G. Making data visualization more efficient and effective: a survey. VLDB J. 2020;29(1):93–117.
Quinlan JR. Induction of decision trees. Mach Learn. 1986;1(1):81–106.
Quinlan JR. C4.5: programs for machine learning. Mach Learn. 1993.
Rasmussen C. The infinite Gaussian mixture model. Adv Neural Inf Process Syst. 1999;12:554–60.
Rawassizadeh R, Tomitsch M, Wac K, Tjoa AM. Ubiqlog: a generic mobile phone-based life-log framework. Pers Ubiquitous Comput. 2013;17(4):621–37.
Resch B, Szell M. Human-centric data science for urban studies. 2019.
Rizk A, Elragal A. Data science: developing theoretical contributions in information systems via text analytics. J Big Data. 2020;7(1):1–26.
Rokach L. A survey of clustering algorithms. In: Data mining and knowledge discovery handbook. Springer; 2010. p. 269–298.
Safdar S, Zafar S, Zafar N, Khan NF. Machine learning based decision support systems (dss) for heart disease diagnosis: a review. Artif Intell Rev. 2018;50(4):597–623.
Sarker IH. Context-aware rule learning from smartphone data: survey, challenges and future directions. J Big Data. 2019;6(1):1–25.
Sarker IH. A machine learning based robust prediction model for real-life mobile phone data. Internet Things. 2019;5:180–93.
Sarker IH. Ai-driven cybersecurity: an overview, security intelligence modeling and research directions. SN Comput Sci. 2021.
Sarker IH. Cyberlearning: effectiveness analysis of machine learning security modeling to detect cyber-anomalies and multi-attacks. Internet Things. 2021:100393.
Sarker IH. Deep cybersecurity: a comprehensive overview from neural network and deep learning perspective. SN Comput Sci. 2021.
Sarker IH. Machine learning: algorithms, real-world applications and research directions. SN Comput Sci. 2021;2(3):1–21.
Sarker IH, Abushark YB, Alsolami F, Khan AI. Intrudtree: a machine learning based cyber security intrusion detection model. Symmetry. 2020;12(5):754.
Sarker IH, Alqahtani H, Alsolami F, Khan AI, Abushark YB, Siddiqui MK. Context pre-modeling: an empirical analysis for classification based user-centric context-aware predictive modeling. J Big Data. 2020;7(1):1–23.
Sarker IH, Colman A, Han J. Recencyminer: mining recency-based personalized behavior from contextual smartphone data. J Big Data. 2019;6(1):1–21.
Sarker IH, Colman A, Han J, Khan AI, Abushark YB, Salah K. Behavdt: a behavioral decision tree learning to build user-centric context-aware predictive model. Mob Netw Appl. 2020;25(3):1151–61.
Sarker IH, Colman A, Kabir MA, Han J. Phone call log as a context source to modeling individual user behavior. In: Proceedings of the 2016 ACM international joint conference on pervasive and ubiquitous computing (Ubicomp): adjunct, Germany. ACM. 2016. p. 630–634.
Sarker IH, Colman A, Kabir MA, Han J. Individualized time-series segmentation for mining mobile phone user behavior. Comput J. 2018;61(3):349–68.
Sarker IH, Hoque MM, Uddin MK, Alsanoosy T. Mobile data science and intelligent apps: Concepts, ai-based modeling and research directions. Mob Netw Appl. 2020:1–19.
Sarker IH, Kayes ASM. Abc-ruleminer: user behavioral rule-based machine learning method for context-aware intelligent services. J Netw Comput Appl. 2020:102762.
Sarker IH, Kayes ASM, Badsha S, Alqahtani H, Watters P, Ng A. Cybersecurity data science: an overview from machine learning perspective. J Big Data. 2020;7(1):1–29.
Sarker IH, Kayes ASM, Watters P. Effectiveness analysis of machine learning classification models for predicting personalized context-aware smartphone usage. J Big Data. 2019;6(1):1–28.
Schläpfer M, Bettencourt LMA, Grauwin S, Raschke M, Claxton R, Smoreda Z, West GB, Ratti C. The scaling of human interactions with city size. J R Soc Interface. 2014;11(98):20130789.
Shukla N, Fricklas K. Machine learning with TensorFlow. Greenwich: Manning; 2018.
Siami-Namini S, Tavakoli N, Namin AS. A comparison of arima and lstm in forecasting time series. In: 2018 17th IEEE international conference on machine learning and applications (ICMLA). IEEE. 2018. p. 1394–1401.
Silahtaroğlu G, Yılmaztürk N. Data analysis in health and big data: a machine learning medical diagnosis model based on patients’ complaints. Commun Stat Theory Methods. 2019;1–10.
Silvestrini A, Veredas D. Temporal aggregation of univariate and multivariate time series models: a survey. J Econ Surv. 2008;22(3):458–97.
Ślusarczyk B. Industry 4.0: are we ready? Pol J Manag Stud. 2018:17.
Sneath PHA. The application of computers to taxonomy. J Gen Microbiol. 1957;17(1).
Sorensen T. Method of establishing groups of equal amplitude in plant sociology based on similarity of species. Biol. Skr. 1948:5.
Srinivasan V, Moghaddam S, Mukherji A. Mobileminer: mining your frequent patterns on your phone. In: Proceedings of the international joint conference on pervasive and ubiquitous computing, Seattle, WA, USA, 13–17 September. New York: ACM; 2014. p. 389–400
Szegedy C, Liu W, Jia Y, Sermanet P, Reed S, Anguelov D, Erhan D, Vanhoucke V, Rabinovich A. Going deeper with convolutions. In: Proceedings of the IEEE conference on computer vision and pattern recognition. 2015. p. 1–9.
Tajbakhsh A, Rahmati M, Mirzaei A. Intrusion detection using fuzzy association rules. Appl Soft Comput. 2009;9(2):462–9.
Tavallaee M, Bagheri E, Lu W, Ghorbani AA. A detailed analysis of the kdd cup 99 data set. In: 2009 IEEE symposium on computational intelligence for security and defense applications. IEEE. 2009. p. 1–6.
Tsagkias M, Tracy HK, Surya K, Vanessa M, de Rijke M. Challenges and research opportunities in ecommerce search and recommendations. In: ACM SIGIR forum, vol 54. New York: ACM; 2021. p. 1–23.
Tsai C-W, Lai C-F, Chao H-C, Vasilakos AV. Big data analytics: a survey. J Big Data. 2015;2(1):1–32.
Tuncel KS, Baydogan MG. Autoregressive forests for multivariate time series modeling. Pattern Recognit. 2018;73:202–15.
Wagstaff K, Cardie C, Rogers S, Schrödl S, et al. Constrained k-means clustering with background knowledge. ICML. 2001;1:577–84.
Wang J, Zhang W, Shi Y, Duan S, Liu J. Industrial big data analytics: challenges, methodologies, and applications. 2018. arXiv:1807.01016.
Wang L, Zhang J, Chen G, Qiao D. Identifying comparable entities with indirectly associative relations and word embeddings from web search logs. Decis Support Syst. 2021:141.
Wang W, Yang J, Muntz R, et al. Sting: a statistical information grid approach to spatial data mining. VLDB. 1997;97:186–95.
Waskom ML. Seaborn: statistical data visualization. J Open Source Softw. 2021;6(60):3021.
Wei P, Li Y, Zhang Z, Tao H, Li Z, Liu D. An optimization method for intrusion detection classification model based on deep belief network. IEEE Access. 2019;7:87593–605.
Weiss K, Khoshgoftaar TM, Wang DD. A survey of transfer learning. J Big Data. 2016;3(1):9.
Witten IH, Frank E. Data mining: practical machine learning tools and techniques. Morgan Kaufmann; 2005.
Witten IH, Frank E, Trigg LE, Hall MA, Holmes G, Cunningham SJ. Weka: practical machine learning tools and techniques with java implementations. 1999.
Xin Y, Kong L, Liu Z, Chen Y, Li Y, Zhu H, Gao M, Hou H, Wang C. Machine learning and deep learning methods for cybersecurity. IEEE Access. 2018;6:35365–81.
Xu D, Yingjie T. A comprehensive survey of clustering algorithms. Ann Data Sci. 2015;2(2):165–93.
Ya J, Liu T, Li Q, Shi J, Zhang H, Lv P, Guo L. Mining host behavior patterns from massive network and security logs. Proc Comput Sci. 2017;108:38–47.
Yong AG, Pearce S, et al. A beginner’s guide to factor analysis: Focusing on exploratory factor analysis. Tutor Quant Methods Psychol. 2013;9(2):79–94.
Zaki MJ. Scalable algorithms for association mining. IEEE Trans Knowl Data Eng. 2000;12(3):372–90.
Zhao Q, Bhowmick SS. Association rule mining: a survey. Singapore: Nanyang Technological University; 2003.
Zheng P, Ni LM. Spotlight: the rise of the smart phone. IEEE Distrib Syst Online. 2006;7(3):3.
Zheng T, Xie W, Liling X, He X, Zhang Y, You M, Yang G, Chen Y. A machine learning-based framework to identify type 2 diabetes through electronic health records. Int J Med Inform. 2017;97:120–7.
Zhou Z-J, Hu G-Y, Hu C-H, Wen C-L, Chang L-L. A survey of belief rule-base expert system. IEEE Trans Syst Man Cybern Syst. 2019.
Zhu H, Chen E, Xiong H, Kuifei Y, Cao H, Tian J. Mining mobile user preferences for personalized context-aware recommendation. ACM Trans Intell Syst Technol (TIST). 2014;5(4):58.
Zikang H, Yong Y, Guofeng Y, Xinyu Z. Sentiment analysis of agricultural product ecommerce review data based on deep learning. In: 2020 international conference on internet of things and intelligent applications (ITIA). IEEE. 2020. p. 1–7.
Author information
Authors and Affiliations
Corresponding author
Ethics declarations
Conflict of interest
The author declares no conflict of interest.
Additional information
Publisher's Note
Springer Nature remains neutral with regard to jurisdictional claims in published maps and institutional affiliations.
This article is part of the topical collection “Advances in Computational Approaches for Artificial Intelligence, Image Processing, IoT and Cloud Applications” guest edited by Bhanu Prakash K N and M. Shivakumar.
Rights and permissions
About this article

Cite this article
Sarker, I.H. Data Science and Analytics: An Overview from Data-Driven Smart Computing, Decision-Making and Applications Perspective. SN COMPUT. SCI. 2, 377 (2021). https://doi.org/10.1007/s42979-021-00765-8
Received:
Accepted:
Published:
DOI: https://doi.org/10.1007/s42979-021-00765-8