
Abstract
During an earthquake, the reinforced concrete (RC) structures are subjected to deformations that may lead their structural elements to exceed the corresponding resistance limit state, forcing them to have nonlinear responses. The application of realistic numerical models that can represent the non-linearity of each structural element requires full examination and calibration. Furthermore, simplified numerical approaches that can represent the seismic behaviour of original and strengthened RC elements are of full importance. For this, the experimental tests are useful to calibrate the numerical models, and thus to capture as well as possible the real response of the elements. The main goal of this work is to evaluate the efficiency of a simplified numerical approach to represent strengthened RC columns with steel and CFRP jacketing, subjected to biaxial horizontal loading. The numerical modelling efficiency will be evaluated by comparing the numerical results with the experimental ones in terms of shear-drift hysteretic behaviour, initial stiffness and stiffness degradation, maximum strength and energy dissipation. The results shows a good performance of the numerical models, mainly for the RC columns strengthened with CFRP jacketing technique.
Introduction
The structural behaviour of reinforced concrete (RC) buildings when subjected to earthquakes should be regarded as a very important topic, as demonstrated in the earthquakes in Sichuan (China) in 2008 [1], L’Aquila (Italy) in 2009 [2], Port-au-Prince (Haiti) in 2010 [3] and Lorca (Spain) in 2011 [4] and more recently in Nepal. The earthquakes effects can result in the structural collapse or by several damages in many of the structural elements [5], as can be observed in Fig. 1a. It is known that some existing RC buildings, designed with older codes, can be more prone to serious damage under seismic action, like shear or flexure failure, as illustrated in Fig. 1b. This is mainly justified by the reduced capacity to deform of the RC columns (reduced ductility) and the reduced amount of longitudinal reinforcement [6–8], which can be due to lower design seismic actions, use of plain rebars, poorer detailing, lap slices in critical regions, premature terminations of longitudinal reinforcement and lack of lateral confinement, which are common in existing structures built until late 1980s [9, 10].

RC column damaged after the Gorkha 2015 earthquake in Nepal. a General view of the RC column. b Plastic hinge in the base of the RC column
The available data regarding to RC columns subjected to biaxial cyclic bending and constant or variable axial load allows us to recognize that the biaxial bending effect is a very important topic for building structures in earthquake prone regions. Recently, Rodrigues et al. [11–14] tested several number of RC full-scale column specimens under different horizontal loading patterns, always including the comparison of 2D test results with those of similar columns tested in (1D) bending. Rodrigues concluded that: (i) initial column stiffness is not much affected by 2D load path; (ii) maximum strength in one specific column direction for each 2D test is always lower than that of the corresponding 1D test; (iii) ultimate ductility is clearly reduced in columns under 2D loading paths; (iv) strength degradation is very reduced before ductility demands about 3, increasing thereafter; (v) 2D bending can introduce higher energy dissipation than 1D loading; (vi) viscous damping highly depends on biaxial load path. Recently some experimental tests were conducted To evaluate the efficiency of different strengthening technics to improve the RC columns behaviour [15–24].
Some numerical modelling research works regarding to the use of simplified approaches to represent the RC columns cyclic behaviour can be found in the literature [25, 26]. Different modelling strategies are proposed by several authors regarding for example to lumped damaged models [27], fiber models [28], among others. However the number of studies about the numerical modelling of strengthened RC columns subjected to biaxial horizontal loading are scarce, and is of full importance to study numerical strategies that allow to analyse the effect of different strengthening technics application in the existing buildings response.
This study intends to evaluate numerical efficiency of a simplified approach to represent the biaxial cyclic behaviour of RC columns strengthened with CFRP and steel plates jacketing, through a distributed plasticity approach with the formulation based in forces coupled with a nonlinear variable confinement material model developed by Ferracuti and Savoia [29] to represent the reinforcement material effect. The numerical modelling efficiency was evaluated by comparing the numerical results with the experimental ones, in terms of: shear-drift hysteretic response, initial stiffness, stiffness degradation, maximum strength and energy dissipation.
Simplified modelling approach to represent strengthened RC columns behaviour
Overview of the experimental campaign
The main purpose of the present work is, as previous said, test the numerical efficiency of a simplified approach that can represent RC columns strengthened with CFRP and steel plates jacketing tested by Rodrigues et al. [13]. The experimental campaign was composed by seven rectangular RC columns with the following dimensions: 1.70 m high, and are cast in strong square concrete foundation blocks with dimensions 1.30 × 1.30 m2 in plan and 0.50 m high. The specimens and cross-section dimensions and the reinforcement detailing are presented in Fig. 2a. All of them were constructed with the same geometric characteristic and reinforcement detailing, and were cyclically tested for two different loading histories, described in Table 1. In Fig. 2b is also illustrated the general view of the experimental setup, which can be observe the existence of four holes that are drilled in the foundation block to fix the specimen to the laboratory strong floor. An extra 0.20 m height is added for attaching the three actuators devices.

a Specimen dimensions and general scheme of the reinforcement layout. b General view of the test setup
With the main objective of characterise the column specimen’s response when subjected to cyclic biaxial horizontal loading conditions, two horizontal displacement path were adopted: diagonal 45º and diamond (illustrated in Fig. 3). During the experimental tests, cyclic lateral displacements were imposed at the top of the column with steadily increasing demand levels. Three cycles were repeated for each lateral deformation demand level and the following nominal peak displacement levels (in mm) were considered: 3, 5, 10, 4, 12, 15, 7, 20, 25, 30, 35, 40, 45, 50, 55, 60, 65, 70, 75, 80. A constant axial load was maintained with the value of 300 kN. Seven of the specimens were strengthened with two different techniques: CFRP plates jacketing and steel plates jacketing (see Table 1). The concrete and steel material properties of each specimen, the loading conditions and the strengthening technique adopted for each specimen are summarised, in Table 1. The seven RC columns are divided in three groups, namely: Group 1—four RC columns strengthened with CFRP plates jacketing and Group 2—three RC columns strengthened with steel plates jacketing.

Horizontal displacement load path
Numerical modelling strategy description
The numerical modelling of all the specimens was performed in the computer program SeismoStruct [30]. For this study, it was adopted the distributed plasticity approach with the formulation based in forces, typically known as force-based approach. To represent each RC column it was adopted a single element with several integration points through the entire length of the element, as illustrated in Fig. 4a. Each integration point was associated with a control section. The choice of the number of integration points was decided according to the sensitivity studies carried out by Calabrese et al. [31] and Rodrigues et al. [11]. Both have concluded that the number of seven control sections are enough to represent RC columns behavior with this type of strategy, as illustrated in Fig. 4b.

Numerical modelling strategy. a General view of the RC column discretization, b distributed inelasticity element with force-based formulation, c fiber-based modelling
Fiber discretization was adopted to represent the behaviour at section level, where each fiber was associated with the corresponding uniaxial stress–strain law. The sectional moment–curvature state of the beam and column elements is then obtained through the integration of the non-linear uniaxial stress–strain response of the individual fibers into which the section has been subdivided (Fig. 4c). Through the integration of the non-linear response, the stress–strain uniaxial relationship in each individual fiber of the control section are submitted, results in the stress–strain state of the element. The non-linearity of each column was obtained directly from the nonlinear behaviour of the fibers, which were is so accurate as much as the accuracy of the fibers. In this study the number of 600 fibers was assumed. Taking into account that the Seismostruct [30] does not have the possibility to take into account with the bond-slip effect, and regarding to the considerations made by Bousias [32] in his parametric study to evaluate the bond-split consideration in the numerical modelling with simplified approaches, the bond-split effect was neglected.
Some numerical modelling approaches of the confinement effect provided by reinforcement materials can be found in the literature, mainly regarding to micro-modelling strategies. For the present study, a simplified numerical approach proposed by Ferracuti and Savoia [29] was adopted, which the main goal is through a uniaxial variable confinement model determines the concrete strength obtained with the jacketing material (CFRP and steel plates in the present study). This nonlinear uniaxial variable confinement model follows the constitutive cyclic rules proposed by Mander et al. [33] for the compression and the Yankelevsky for the tension [34]. The confinement effects provided by the jacketing material are represented through the use of the rules proposed by Spoelstra and Monti [30, 35]. This numerical model approach allow to represent the interaction between the containment devices (jacketing material) due to the concrete lateral deformation, through and iterative incremental approach. The relationship between the axial and lateral stresses is implicitly derived through equilibrium between the confined concrete (dilation) and the containment device.
Similarly to the numerical modelling of original columns, the strategy is supported in lumped inelastic element based in forces formulation and discretized in 7 control sections. Each control section (of strengthened RC columns) is numerically represented by two different material components: homogenous confined concrete (the uniaxial variable confinement model takes into account with the Confinement provided by the transversal reinforcement and the jacketing material) and the longitudinal reinforcement fibers as illustrated in Fig. 5.

Control section discretization of the strengthened RC columns elements in fibres, where JM is jacketing material (CFRP or Steel), RM is reinforcement material, CCM confined concrete material, NCCM non-confined concrete material, HCM homogenous concrete material
It should be noted that the elements have the same control sections characteristics throughout the entire length. What does not happen in reality because this reinforced control sections are only located in the seismic zone interventions, 0.50 m from the base.
However, the fact of the control sections located above the seismic reinforcement is different, because they are in linear elastic behavior which does not significantly affect the final response of the element. Additionally two original RC columns were modelled to calibrate the numerical strengthened models, despite as can be observed in Table 1 the material properties are slightly different for each RC columns group. In the next sub-sections are summarized the values adopted in the modelling process of the RC columns and the most important considerations.
RC columns strengthened with CFRP plates—Group 1
Considering the CFRP properties (CFRP ultimate strain ε uj = 0.0155 %, ultimate strength f uj = 3800 MPa and ρCFRP = 0.0018), and the corresponding characteristic value of the elastic modulus E fk = 240,000 MPa, it was obtained the total thickness of CFRP jacketing t j = 0.342 mm for the total repaired zone height (500 mm). The total area value along this height (0.342 × 500 = 171 mm2) was then divided by 3 CFRP plates 80 mm wide, spaced at 70 mm, each one with six layers of CFRP sheet thickness (0.117 mm), having a 40 mm gap between the footing and the first plate. The Fig. 6 shows the general schematic view of the strengthened columns with CFRP plates jacketing.

Strengthened column specimen with CFRP plates jacketing—Group 1
Looking for this uniaxial material model for the homogenous confined concrete, the following parameters were adopted in the numerical models are described in Table 2.
For the reinforcement steel it was adopted the Menegotto and Pinto uniaxial material model [36], that combined with the isotropic hardening rules proposed by Filippou et al. [37]. This model considers the Bauschinger effect, which is relevant for the representation of the columns’ stiffness degradation under cyclic loading. The parameters that are required for the model are: the steel yield strength (f y ); the elastic Young modulus (E s ); the strain-hardening ratio (r) and five parameters to describe the transition from elastic to plastic branches (R 0 , a 1 , a 2 , a 3 , and a 4 ). The parameters adopted in the numerical models are summarized in Table 3.
RC columns strengthened with steel plates jacketing—Group 2
Considering the yielding steel strength of 275 MPa (Esteel = 210GPa and ρsteel = 0.0013) and the ultimate strain εult of 0.15 %, the steel jacket thickness t j = 0.536 mm was obtained, which was then divided by three to obtain the steel plate areas (30 × 5 mm2). The steel plates were L-shape folded, bonded to the column with epoxy resin and welded in situ in two corners to complete the collar. The plates were placed in three previously defined levels at increasing distances from the footing (125, 275 and 425 mm). After welding, the voids between the plates and the concrete were filled with injection of two component epoxy resin in order to ensure full contact and early efficiency of the external strengthening. The Fig. 7 shows the general schematic view of the strengthened columns with steel plates jacketing.

Strengthened column specimen with steel plates jacketing—Group 2
The following parameters were adopted for the homogenous confined concrete uniaxial material model, in the numerical models and are described in Table 4.
The parameters adopted for the reinforcement material parameters in the numerical models are summarized in Table 5.
Evaluation of the numerical modelling efficiency
The numerical results will be presented along the present section for of all the specimens and were compared with the experimental ones in terms of shear-drift hysteretic behaviour, shear-drift envelopes, maximum strength, initial stiffness, secant stiffness degradation, tangent stiffness degradation and energy dissipation and are presented in the next sub-sections.
Shear-drift hysteretic curves results
Through the observation of the shear-drift hysteretic behaviour of the numerical and experimental results (Figs. 8, 9), the following comments can be drawn:

Shear-drift hysteretic response—Group 1

Shear-drift hysteretic response—Group 2
-
Generally, it can be stated that the numerical responses were similar to the experimental results. Some problems were observed in some numerical models to capture the experimental response for large displacements, mainly in terms of the strength degradation. Similar problems are reported by other authors in the numerical modelling, with simplified approaches, of original RC columns subjected to biaxial loading [38]. Nevertheless, it is possible to observe already some strength degradation in the numerical results;
-
Regarding to the results of the Group 1 (Fig. 8) it can be observed a better numerical results for the columns subjected to diagonal—45º loading pattern when compared with the results for the diamond loading pattern. The same was also verified for the Group 2 RC columns subjected to the same loading pattern, as illustrated in Fig. 9;
-
Comparing the numerical results of the Group 2 it can be observed that the pinching effect is better adjusted to the experimental hysteretic results for the Group 1 specimens, mainly in the weak direction. In terms of energy dissipation, it was observed that the Group 2 that the numerical models dissipated higher energy than the observed in the experimental results.
Shear-drift envelopes
The numerical shear-drift envelopes of Group 1 and 2 specimens presented, respectively in Figs. 10 and 11. As observed in the previous sub-section, the results shows generally that the numerical models reproduced very satisfactory the experimental response for lower displacement demands, however some problems in capture the experimental response is observed for higher drift demands, mainly for the specimens of the Group 2. This is justified by the difficulty of the numerical model in represent the strength degradation along the numerical analysis. Better results were again founded for the samples subjected to the diagonal 45º loading pattern in the both of the Groups.

Shear-drift envelopes—Group 1

Shear-drift envelopes—Group 2
In terms of capture of the RC columns initial stiffness, it is observed that the numerical models have better results for the weak direction when compared with the other direction.
Initial stiffness ratio
The initial stiffness for each specimen was determined and through the observation of the ratio between the numerical and the experimental initial stiffness, illustrated in Fig. 12 it can be observed that the numerical models capture higher initial stiffness values for the stronger direction than the observed for the weak direction of the specimens, as already mentioned.

Ratio between numerical and experimental initial stiffness. a Group 1 and b Group 2
Comparing the results for each Group, it is observed that the results are better for the Group 1, illustrated in Fig. 12a, where was found slight differences between the numerical and experimental results, 5–60 % for the strong direction and 0–25 % for weak direction. For Group 2, plotted in Fig. 12a, it is observed differences about 45–50 % for the stronger direction and between 0–30 % for the weak direction.
Maximum strength ratio
In order to evaluate the numerical models capacity to represent the maximum strength observed in the experimental results, it was plotted in Fig. 13 the ratio between the maximum strength obtained in the experimental and in the numerical models. It is observed that the numerical models represent very satisfactory the maximum strength of the experimental results, such for the positive cycle and for negative.

Ratio between numerical and experimental maximum strength. a Group 1 and b Group 2
Better results were obtained for Group 1, when compared with the Group 2 results, as reported by the slight difference between 5–15 % obtained for the RC columns strengthened with CFRP jacketing and the 5–40 % observed for the RC strengthened columns with steel plates jacketing.
Stiffness degradation
The stiffness degradation, or as common to know as relative stiffness, was evaluated by comparing the peak-to-peak secant stiffness values resulting from the first cycle of each imposed peak displacement (see Fig. 14). It was calculated the lateral peak-to-peak stiffness degradation for each column in each direction.

Stiffness degradation (adapted from Rodrigues et al. [11])
-
From the results, illustrated in Figs. 15 and 16 the following considerations can be performed:
Fig. 15 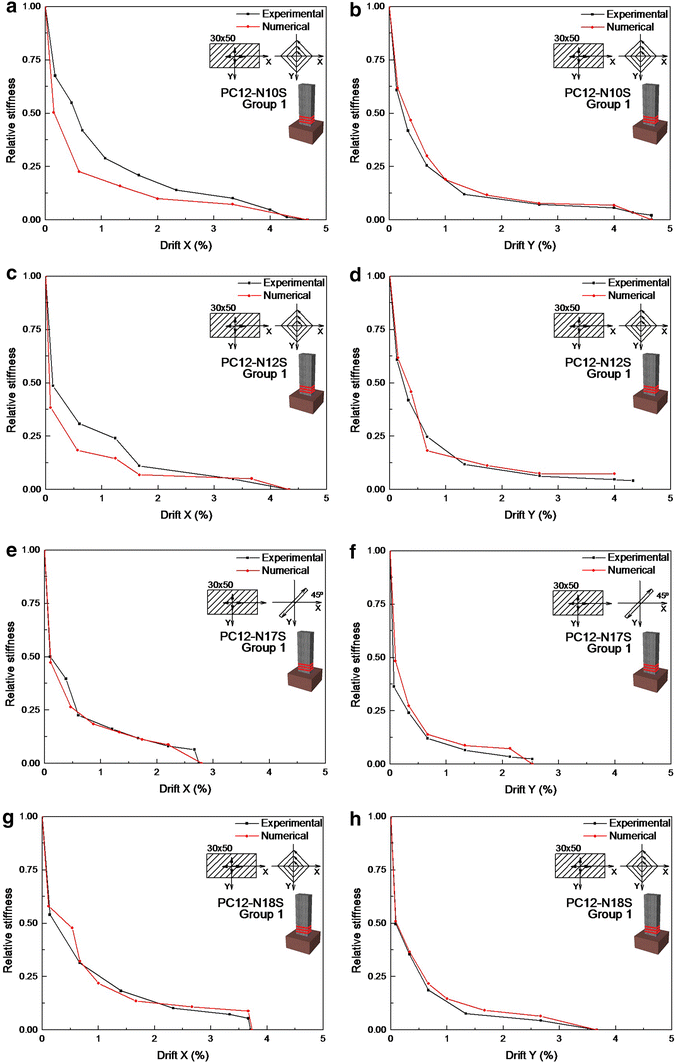
Stiffness degradation evolution—Group 1
Fig. 16 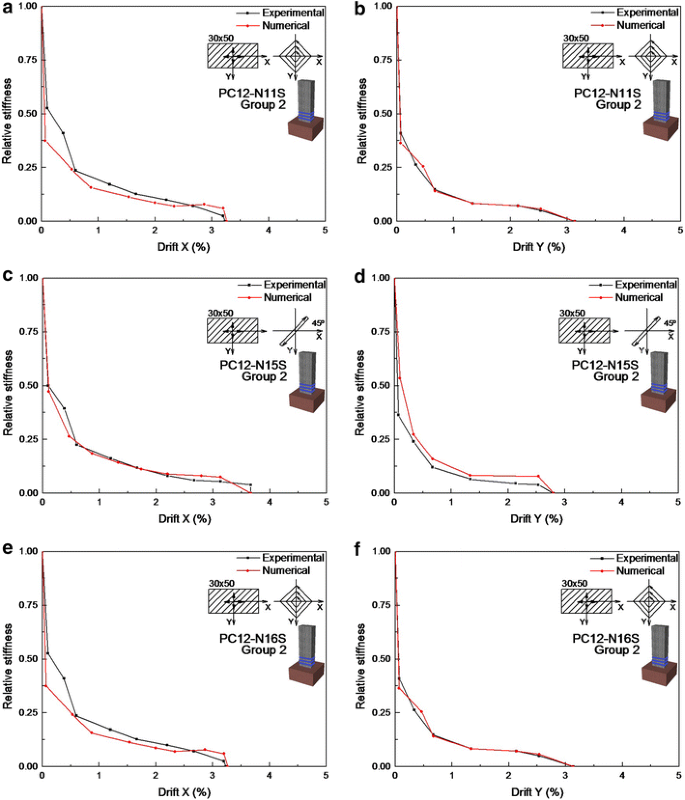
Stiffness degradation evolution—group 2
-
The stiffness degradation was satisfactory captured by the numerical models, however it is observed that the results are better in the weak direction;
-
The numerical models obtained better stiffness degradation representation for larger drift values, mainly after 1.5 % of drift;
-
Comparing the results between the RC columns of Group 1, it is possible to observe that the numerical models are better for the diagonal 45º load path. The same was not observed for the RC columns of Group 2.


Stiffness normalized degradation
The evolution of stiffness normalized degradation was determined between the initial stiffness and each relative stiffness determined in the Sect. 3.3, according to Rodrigues et al. [11], and is illustrated in the Figs. 17 and 18.

Normalized relative stiffness evolution—Group 1

Normalized relative stiffness evolution—Group 2
As observed for the evolution of the stiffness degradation the results shows to be better for the Group 1 RC columns. Again, comparing the stiffness normalized degradation between the RC columns of Group 1, it is possible to observe that the numerical models are better for the diagonal 45º load path. The same was again not observed for the RC columns of Group 2.
Energy dissipation
The numerical and experimental cumulative dissipated energy are illustrated in Figs. 19 and 20. For each displacement amplitude level, the plotted value of dissipated energy corresponds to the end of the third cycle. For the biaxial load paths, the value of dissipated energy corresponds to the maximum resultant displacement for each cycle.

Accumulative energy dissipation evolution—Group 1

Accumulative energy dissipation evolution—Group 2
Regarding to the results obtained for RC columns of Group 1, it is observed slow differences for the samples subjected to the diamond load pattern, with differences between 5–45 %. The results of the Group 2 shows to be better than for Group 1, and this can be observed through the difference between the 5–50 % and the 15–25 % of difference observed respectively. It was also observed that the diagonal 45º load path presents better results than the diamond load path.
It can be observed also a good performance of the numerical models for lower drift values (0–3 % drift), and justified by the insufficient capacity to represent the strength degradation for higher drift values, the results of the final energy dissipated is higher than the observed in the experimental ones.
Total energy dissipation
The total energy dissipation were determined and plotted in Fig. 21. From these, it was observed that all the numerical models represented very satisfactory. The results obtained for the Group 2 were better than the Group 1, with slight difference between 10–60 % of difference for the strengthened columns with CFRP jacketing and between 5–25 % of difference observed for the strengthened columns with steel plates jacketing.

Total energy dissipated—Group 1 and 2
Conclusions
The main objective of the present study was to evaluate the efficiency of a simplified approach to represent RC strengthened columns with two types of strengthening techniques (CFRP and steel plates jacketing) subjected to biaxial horizontal loading and constant axial load. The modelling strategy was based on the distributed plasticity element with force-based formulation, with particular attention to the modelling process of the strengthening material and the respective effect on the RC columns response. This numerical model approach allow to represent the interaction between the containment devices (jacketing material) due to the concrete lateral deformation, through and iterative incremental approach. The relationship between the axial and lateral stresses is implicitly derived through equilibrium between the confined concrete (dilation) and the containment device.
The numerical modelling efficiency was evaluated by comparing the numerical results with the experimental ones. Globally it was observed that the numerical models represented satisfactory the original RC columns for both of the Groups. Relatively to the RC columns of Group 1 it was observed that all of them were well represented, especially the RC column subjected to the diagonal 45º horizontal load path. The same was observed for the group 2 where the best representation of the experimental behavior was obtained for the column under the same horizontal load path.
In terms of initial stiffness and maximum strength it was observed that the numerical models reproduced accurately the experimental response with better results with slight differences around 5–15 % when compared with the differences observed for Group 2 around 5–40 %. Regarding to the stiffness degradation the results shows to be better for the Group 1 RC columns. Again, comparing the stiffness degradation between the RC columns of Group 1, it is possible to observe that the numerical models are better for the diagonal 45º load path. The same was again not observed for the RC columns of Group 2. It was verified that the original RC columns numerical columns obtained higher energy dissipation values in the experimental test when compared with the numerical results. However for the strengthened columns the same wasn’t verified, with higher values for the numerical models, as consequently of the difficulty of the maximum strength degradation. All numerical models showed limitations in the representation of the pinching effect at the discharge-recharge phase.
The global findings of the present research work allow to conclude that this modelling strategy for strengthened columns can help the designers to evaluate the benefits in the structural response by introducing some jacketing reinforcements in RC buildings.
References
Guo HD, Ehrlich D, Molch K, Ma JW, Pesaresi M (2009) Identifying damage caused by the 2008 Wenchuan earthquake from VHR remote sinsing data. Int J Digit Earth 2(4):309–326
Aydan O, Kaw Ashima K, Aoki T, Kishimoto I, Konogai K, Matsui T, Sakuta J, Takahashi N, Teodori S-P, Yashim A (2010) Reconnaissance investigation on the damage of the 2009 L’Aquila, central Italy earthquake. J Earthq Eng 14:817–841
Dunbar P, Stroker K, McCullough H (2010) Do the 2010 Haiti and Chile earthquakes and tsunam is indicate increasing trends? Geomat Nat Hazards Risk 1(2):95–114
Romão X, Costa AA, Paupério E, Rodrigues H, Vicente R, Varum H, Costa A (2011) Field observations and interpretation of the structural performanceof construction after the 11 May 2011 Lorca earthquake. Eng Fail Anal 34:670–692
Varum H (2003) Seismic assessment, strengthening and repair of existing buildings. Departamento de Engenharia Civil, Universidade de Aveiro, Aveiro
Rodrigues H, Arêde A, Varum H, Costa A (2013) Experimental evaluation of rectangular reinforced concrete column behaviour under biaxial cyclic loading. Earthq Eng Struct Dynam 43:239–259
Rocha P, Delgado P, Rodrigues V, Santos M, Arêde A, Pouca N et al. (2006) Seismic rehabilitation of reinforced concrete columns. In: Presented at the 1st European conference on earthquake engineering and seismology, Geneva, Switzerland, 2006
Monti G, Nuti C (1992) Nonlinear cyclic behavior of reinforcing bars including buckling. ASCE J Struct Eng 118:3268–3284
Melo J (2014) Characterization of the cyclic behaviour of reinforced concrete elements with plain bars, PhD, Civil Engineering Department, University of Aveiro, Aveiro
Melo J, Varum H, Rossetto T (2016) Experimental cyclic behaviour of RC columns with plain bars and proposal for Eurocode 8 formula improvement. Eng Struct (In press)
Rodrigues H (2012) Biaxial seismic behaviour of reinforced concrete columns, PhD Thesis, Departamento de Engenharia, Universidade de Aveiro, Aveiro
Rodrigues H, Arêde A, Varum H, Costa A (2012) Behaviour of RC building columns under cyclic loading: experimental study. J Earthq Tsunami JET 6(04):1250026 (World Scientific Publishing)
Rodrigues H, Arêde A, Varum H, Costa A (2013) Damage evolution in reinforced concrete columns subjected to biaxial loading. Earthq Eng Struct Vib 42:239–259
Rodrigues H, Furtado A, Arêde A (2015) Behavior of rectangular reinforced-concrete columns under biaxial cyclic loading and variable axial loads. J Struct Eng 142(1):04015085
Binici B, Khalid M, Mosalam M (2007) Analysis of reinforced concrete columns retrofitted with fiber reinforced polymer lamina. Compos B 38:265–276
Ozcan O, Binici B, Ozcebe G (2007) Seismic retrofitting of reinforced concrete columns using carbon fiber reinforced polymer (CFRP). In: Presented at the Asia-Pacific Conference on FRP in structures (APFIS 2007)
Yalein C, Kaya O, Sinangil M (2008) Seismic retrofitting of R/C columns having plain rebars using CFRP sheets for improved strength and ductility. Constr Build Mater 22:295–307
Ye L, Zhang K, Zhao S, Feng P (2003) Experimental study on seismic strengthening of RC columns with wrapped CFRP sheets. Constr Build Mater 17:499–506
Rocha P, Delgado P, Rodrigues V, Santos M, Arêde A, Vila Pouca N et al. (2006) Seismic rehabilitation of reinforced concrete columns. In: Proceedings of the first European conference on earthquake engineering and seismology (a joint event of the 13th European conference on earthquake engineering & 30th general assembly of the European seismological commission), Geneva, Switzerland, 2006
Monti G, Nisticó N, Santini S (2001) Design of FRP jackets for upgrade of circular bridge piers. J Compos Constr 5:94–101
Priestley M, Seible F, Calvi M (1996) Seismic design and retrofit of bridges. Wiley, New York
Priestley MJN, Park R (1987) Strength and ductility of concrete bridge columns under seismic loading. ACI Struct J 84:61–76
Seible F, Priestley M, Hegemier G, Innamorato D (1997) Seismic retrofit of RC columns with continuos carbon fiber jackets. J Compos Constr 1:52–62
Rodrigues H, Arêde A, Furtado A, Rocha P (2015) Seismic behavior of strengthened RC columns under biaxial loading: an experimental characterization. Constr Build Mater (In press)
CEB (1996) RC frames under earthquake loading. Bulletin no. 231, Comité Euro-International du Béton 1996
Fardis MN (1991) Member-type models for the nonlinear seismic response of reinforced concrete structures. In: Jean D, Jones PM (eds) Experimental and numerical methods in earthquake engineering. Kluwer Academic Publishers, Dordrecht
Mazza F, Mazza M (2008) A numerical model for the nonlinear seismic analysis of three-dimensional RC frames. In: The 14th world conference on earthquake engineering, Beijing, China, 2008
Spacone E, Ciampi V, Filippou F (1992) A beam element for seismic damage analysis. UCB/EERC-92/07, Earthquake Engineering Research Center, University of California, Berkeley, 1992–08, (555.1/S62/1995), p 118
Ferracuti B, Savoia M (2005) Cyclic behaviour of FRP-wrapped columns under axial and flexural loadings. In: International conference on fracture, Italy
SeismoSoft (2004) SeismoStruc—a computer program for static and dynamic nonlinear analysis of framed structures [online], ed. http://www.seismosoft.com
Calabrese A, Almeida JP, Pinho R (2010) Numerical issues in distributed inelasticity modeling of RC frame elements for seismic analysis. J Earthq Eng 14:38–68
Bousias SN, Panagiotakos TB, Fardis MN (2002) Modelling of RC members under cyclic biaxial flexure and axial force. J Earthq Eng 6(2):213–238
Mander JB, Priestley MJN, Park R (1988) Theoretical stress–strain model for confined concrete. J Struct Eng 114:1804–1826
Yankelevsky D, Reinhard H (1989) Uniaxial behavior of concrete in cyclic tension. J Struct Eng 115:166–182
Spoelstra M, Monti G (1999) FRP-confined concrete model. J Compos Constr 3:143–150
Menegotto M, Pinto PE (1973) Method of analysis for cyclically loaded R.C. plane frames including changes in geometry and non-elastic behaviour of elements under combined normal force and bending. In: Presented at the Symposium on the resistance and ultimate deformability of structures acted on by well defined repeated loads, international association for bridge and structural engineering, Zurich, Switzerland
Filippou FC, Popov EP, Bertero VV (1983) Modelling of R/C joints under cyclic excitations. ASCE J Struct Eng 109:2666–2684
Rodrigues H, Varum H, Arêde A, Costa A (2012) Comparative efficiency analysis of different non-linear modelling strategies to simulate the biaxial response of RC columns. Earthq Eng Eng Vib 11:553–566
Acknowledgments
This paper reports research developed under financial support provided by “FCT—Fundação para a Ciência e Tecnologia”, Portugal, through the research project PTDC/ECM/102221/2008. HR participated in the design of the study and carried out the non-linear analysis. AF worked on the results obtained and helped to draft the manuscript. HV and AA conceived of the study, and participated in its design and. All authors read and approved the final manuscript.
Author information
Authors and Affiliations
Corresponding author
Ethics declarations
Conflict of interest
The authors declare that they have no competing interests.
Rights and permissions
Open Access This article is distributed under the terms of the Creative Commons Attribution 4.0 International License (http://creativecommons.org/licenses/by/4.0/), which permits unrestricted use, distribution, and reproduction in any medium, provided you give appropriate credit to the original author(s) and the source, provide a link to the Creative Commons license, and indicate if changes were made.
About this article

Cite this article
Rodrigues, H., Furtado, A., Arêde, A. et al. Numerical modelling of RC strengthened columns under biaxial loading. Innov. Infrastruct. Solut. 1, 6 (2016). https://doi.org/10.1007/s41062-016-0008-9
Received:
Accepted:
Published:
DOI: https://doi.org/10.1007/s41062-016-0008-9