
Abstract
Turnover intention is an employee’s reported willingness to leave her organization within a given period of time and is often used for studying actual employee turnover. Since employee turnover can have a detrimental impact on business and the labor market at large, it is important to understand the determinants of such a choice. We describe and analyze a unique European-wide survey on employee turnover intention. A few baselines and state-of-the-art classification models are compared as per predictive performances. Logistic regression and LightGBM rank as the top two performing models. We investigate on the importance of the predictive features for these two models, as a means to rank the determinants of turnover intention. Further, we overcome the traditional correlation-based analysis of turnover intention by a novel causality-based approach to support potential policy interventions.
1 Introduction
Employee turnover refers to the situation where an employee leaves an organization. It can be classified as voluntary, when it is the employee who decides to terminate the working relationship, or involuntary, when it is the employer who decides [33]. Voluntary turnover is divided further into functional and dysfunctional [26], which refer to, respectively, the exit of low-performing and high-performing workers. This paper focuses on voluntary dysfunctional employee turnover (henceforth, employee turnover) as the departure of a high-performing employee can have a detrimental impact on the organization itself [62] and the labor market at large [33].
It is important for organizations to be able to retain their talented workforce as this brings stability and growth [30]. It is also important for governments to monitor whether organizations are able to do so as changes in employee turnover can be symptomatic of an ailing economic sector.Footnote 1 For instance, the European Commission includes it in its annual joint employment report to the European Union (EU) [14]. Understanding why employees leave their jobs is crucial for both employers and policy makers, especially when the goal is to prevent this from happening.
Turnover intention, which is an employee’s reported willingness to leave the organization within a defined period of time, is considered the best predictor of actual employee turnover [34]. Although the link between the two has been questioned [13], it is still widely used for studying employee retention as detailed quit data is often unavailable due to, e.g., privacy policies. Moreover, since one precedes the other, the correct prediction of intended turnover enables employers and policy makers alike to intervene and thus prevent actual turnover.
In this paper, we model employee turnover intention using a set of traditional and state-of-the-art machine learning (ML) models and a unique cross-national survey collected by EffectoryFootnote 2, which contains individual-level information. The survey includes sets of questions (called items) organized by themes that link an employee’s working environment to her willingness to leave her work. Our objective is to train accurate predictive models, and to extract from the best ones the most important features with a focus on such items and themes. This allows the potential employer/policy maker to better understand intended turnover and to identify areas of improvement within the organization to curtail actual employee turnover.
We train three interpretable (k-nearest neighbor, decision trees, and logistic regression) and four black-box (random forests, XGBoost, LightGBM, and TabNet) classifiers. We analyze the main features behind our two best performing models (logistic regression and LightGBM) across multiple folds on the training data for model robustness. We do so by ranking the features using a new procedure that aggregates their model importance across folds. Finally, we go beyond correlation-based techniques for feature importance by using a novel causal approach based on structural causal models and their link to partial dependence plots. This in turn provides an intuitive visual tool for interpreting our results.
In summary, the novel contributions of this paper are twofold. First, from a data science perspective:
-
we analyze a real-life, European-wide, and detailed survey dataset to test state-of-the-art ML techniques;
-
we find a new top-performing model (LightGBM) for predicting turnover intention;
-
we carefully study the importance of predictive features which have causal policy-making implications.
Second, method-wise:
-
we devise a robust ranking method for aggregating feature importance across many folds during cross-validation;
-
we are the first work in the employee turnover literature to use causality (in the form of structural causal models) for interventional (causal) analysis of ML model predictions.
The paper is organized as follows. First, we review related work in Sect. 2. The Global Employee Engagement Index (GEEI) survey is described in Sect. 3. The comparative analysis of predictive models is conducted in Sect. 4, while Sect. 5 studies feature importance. Section 6 investigates the causal inference analysis. Finally, we summarize the contributions and limitations of our study in Sect. 7.
2 Related work
We present the relevant literature around modeling and predicting turnover intention. Given our interdisciplinary approach, we group the related work by themes.
Turnover determinants. The study of both actual and intended employee turnover has had a long tradition within the fields of human resource management [45] and psychology [34]. The work has focused mostly on what factors influence and predict employee turnover [27]. Similarly, a complementary line of work has focused on job embeddedness, or why employees stay within a firm [42, 60]. A number of determinants have been identified for losing, or conversely, retaining employees [56], including demographic ones (such as gender, age, marriage), economic ones (working time, wage, fringe benefits, firm size, carrier development expectations) and psychological ones (carrier commitment, job satisfaction, value attainment, positive mood, emotional exhaustion), among others. The items and themes along with employee contextual information reported in GEEI capture these determinants.
Most of this literature has centered on the United States or on just a few European countries. See, for instance, [56] and [57], respectively. Our analysis is the first to cover almost all of the European countries.
Modeling approaches. Traditional approaches for testing the determinants of employee turnover have focused largely on statistical significance tests via regression and ANOVA analysis, which are tools commonly used in applied econometrics. See, e.g., [27, 56]. This line of work has embraced causal inference techniques as it works often with panel data, resorting to other econometric tools such as instrumental variables and random/fixed effects models. For a recent example see [31]. For an overview on these approaches see [5].
There has been a recent push for more advanced modeling approaches with the raise of human resource (HR) predictive analytics, where ML and data mining techniques are used to support HR teams [46]. This paper falls within this line of work. Most ML approaches use classification models to study the predictors of turnover. See, e.g., [2, 20, 24, 36]. The common approach among papers in this line of work is to test many ML models and to find the best one for predicting employee turnover. However, despite the fact that some of these papers use the same datasets, there is no consensus around the best models. Using the same synthetic dataset, e.g., [2] finds the support vector machine (SVM) to be the best-performing model while [20] finds it to be the naive Bayes classifier. We note, however, that similar to [24] we find the logistic regression to be one of our top-performing models. This paper adds to the literature by introducing a new top-performing model to the list, the LightGBM.
Similarly, this line of work does not agree on the top data-driving factors behind employee turnover either. For instance, [2] identifies overtime as the main driver while [24] identifies it to be the salary level. This paper adds to this aspect in two ways. First, rather than reporting feature importance on a final model, we do so across many folds for the same model, which gives a more robust view on each feature’s importance within a specific model. Second, we go beyond the limited correlation-based analysis [3] by incorporating causality into our feature importance analysis.
Among the classification models used in the literature and from the recent state-of-the-art in ML, we will experiment with the following models: logistic regression [35], k-nearest neighbor [53], decision trees [11], random forests [10], XGBoost [12], and the more recent LightGBM [37], which is a gradient boosting method [23]. Ensemble of decision trees achieve very good performances in general, with few configuration parameters [16], and especially when the distribution of classes is imbalanced [9], which is typically the case for turnover data. Recent trends in (deep) neural networks are showing increasing performances of sub-symbolic models for tabular data (see the survey [7]). We will experiment with TabNet [6], which is one of the top recent approaches in this line. Implementations of all of the approaches are available in Python with uniform APIs.
Modeling intent. A parallel and growing line of research focuses on predicting individual desire or want (i.e., intent or intention) over time using graphical and deep learning models. These approaches require sequential data detailed per individual. The adopted models allow to account for temporal dependencies within and across individuals for identifying patterns of intent. Intention models have been used, for example, to predict driving routes for drivers [55], online consumer habits [58, 59], and even for suggesting email [54] and chat bot responses [52]. Our survey data has a static nature, and therefore we cannot directly compare with those models, which would be appropriate for longitudinal survey data.
Determining feature importance. Beyond predictive performance, we are interested in determining the main features behind turnover. To this end, we build on the explainable AI (XAI) research [28], in particular XAI for tabular data [49], for extracting from ML models a ranking of the features used for making (accurate) predictions. ML models can either explain and present in understandable terms the logic of their predictions (white-boxes) or they can be obscure or too complex for human understanding (black-boxes). The k-nearest neighbor, logistic regression, and decision trees models we use are white-box models. All the other models are black-box models. For the latter group, we use the built-in model-specific methods for feature importance. We, however, add to this line of work in two ways. First, we device our own ranking procedure to aggregate each feature’s importance across many fold. Second, following [63] we use structural causal models (SCM) [47] to equip the partial dependence plot (PDP) [22] with causal inference properties. PDP is a common XAI visual tool for feature importance. Under our approach, we are able to test causal claims around drivers of turnover intention.
Turnover data. Predictive models are built from survey data (questionnaires) and/or from data about workers’ history and performances (roles covered, working times, productivity). Given its sensitive information, detailed data on actual and intended turnover is difficult to obtain. For instance, all of the advanced modeling approaches previously mentioned either use the IBM Watson synthetic data setFootnote 3 or the Kaggle HR Analytics datasetFootnote 4. This paper contributes to the existing literature by applying and testing the latest in ML techniques to a unique, relevant survey data for turnover intention. The GEEI survey offers a level of granularity via the items and themes that is not present in the commonly used datasets. This is useful information to both employers and policy makers, which allows this paper to have a potential policy impact.
Causal analysis. We note that this is not the first paper to approach employee turnover from a causality perspective, but, to the best of our knowledge, it is the first to do so using SCM. Other papers such as [25] and [48] use causal graphs as conceptual tools to illustrate their views on the features behind employee turnover. However, these papers do not equip their causal models with any interventional properties. Some works, e.g., [4, 21, 61], go further by testing the consistency of their conceptual models with data using path analysis techniques. Still, none of these three papers use SCM, meaning that they cannot reason about causal interventions.
3 The GEEI survey and datasets
Effectory ran in 2018 the Global Employee Engagement Index (GEEI) survey, a labor market questionnaire that covered a sample of 18,322 employees from 56 countries. The survey is composed of 123 questions that inquire contextual information (socio-demographic, working and industry aspects), items related to a number of HR themes (also called, constructs), and a target question. The target question (or target variable, the one to be predicted) is the intention of the respondent to leave the organization within the next three months. It takes values leave (positive) and stay (negative). The design and validation of the GEEI questionnaire followed the approach of [18]. After reviewing the social science literature, the designers defined the relevant themes, and items for each theme. Then they ran a pilot study in order to validate psychometric properties of questions to assess their internal consistency, and to test convergent and discriminant validityFootnote 5 of questions.
Contextual information is reported in Table 1, together with type of data encoded – binary for two-valued domains (male/female gender, profit/non-profit type of business, full/part time work status), nominal for multi-valued domains (e.g., country name), and ordinal for ranges of numeric values (e.g., age band) or for ordered values (e.g., primary/secondary/higher education level).
Items refer to questions related to a theme. The items for the Trust theme are shown in Table 2. There are 112 items in totalFootnote 6. Each item admits answers in Likert scale. A score from 0 to 10 is assigned to an answer by a respondent as follows:
-
Strongly agree \(\rightarrow \) 10
-
Agree \(\rightarrow \) 7.5
-
Neither agree nor disagree \(\rightarrow \) 5
-
Disagree \(\rightarrow \) 2.5
-
Strongly disagree \(\rightarrow \) 0
The direction of the response scale is uniform throughout all the items [50]. Table 3 shows the list of all 23 themes. For a respondent, a score from 0 to 10 is also assigned to a theme as the average score of the items of the theme.
From the raw data of the GEEI survey, we constructed twoFootnote 7 tabular datasets, both including the contextual information. The dataset with also the scores of the themes is called the themes dataset. The dataset with also the scores of the items is called the items dataset. The datasets are restricted to respondents from 30 countries in Europe. The GEEI survey includes 303 to 323 respondents per country, with the exception of Germany which has 1342 respondents. We sampled 323 German respondents stratifying by the target variable. Thus, the datasets have an approximately uniform distribution per country. Also, gender is uniformly distributed with 50.9% of males and 49.1% of females. These forms of selection bias do not take into account the (working) population size of countries. Caution will be mandatory when making conclusions about inferences on those datasets. Finally, Fig. 1 shows the distribution of respondents by age and gender.

Distribution of respondents by Age and Gender

Target variable by Country
In summary, the two datasets have a total of 9,296 rows each, one row per respondent. Only 51 values are missing (out of a total of 1.1M cell values), and they have been replaced by the mode of the column they appear in. The positive rate is 22.5% on average, but it differs considerably across countries, as shown in Fig. 2. In particular, it ranges from 12% of Luxemburg up to 30.6% of Finland.
4 Predictive modeling
Our first objective is to compare the predictive performances of a few state-of-the-art machine learning classifiers on both the datasets, which, as observed, are quite imbalanced [9]. We experiment with interpretable classifiers, namely k-nearest neighbors (KNN), decision trees (DT) and ridge logistic regression (LR), and with black-box classifiers, namely random forests (RF), XGBoost (XGB), LightGBM (LGBM), and TabNet (TABNET). We use the scikit-learnFootnote 8 implementation of LR, DT, and RF, and the xgboostFootnote 9, lightgbmFootnote 10, and pytorch-tabnetFootnote 11 Python packages of XGB, LGBM, and TABNET. Parameters are left as default except for the ones set by hyper-parameter search (see later on).

AUC-PR of logistic regression on a single theme. Bars show mean ± stdev over \(10 \times 10\) cross-validation folds
We adopt repeated stratified 10-fold cross validation as testing procedure to estimate the performance of classifiers. Cross-validation is a nearly unbiased estimator of the generalization error [40], yet highly variable for small datasets. Kohavi recommends to adopt a stratified version of it. Variability of the estimator is accounted for by adopting repetitions [39]. Cross-validation is repeated 10 times. At each repetition, the available dataset is split into 10 folds, using stratified random sampling. An evaluation metric is calculated on each fold for the classifier built on the remaining 9 folds used as training set. The performance of the classifier is then estimated as the average evaluation metric over the 100 classification models (10 models times 10 repetitions). An hyper-parameter search is performed on each training set by means of the OptunaFootnote 12 library [1] through a maximum of 50 trials of hyper-parameter settings. Each trial is a further 3-fold cross-validation of the training set to evaluate a given setting of hyper-parameters. The following hyper-parameters are searched for: (LR) the inverse of regularization strength; (DT) the maximum tree depth; (RF) the number of trees and their maximum depth; (XGBoost) the number of trees, number of leaves in trees, the stopping parameter of minimum child instances, and the re-balancing of class weights; (LightGBM) minimum child instances, L1 and L2 regularization coefficients, number of leaves in trees, feature fraction for each tree, data (bagging) fraction, and frequency of bagging; (TABNET) the number of shared Gated Linear Units.

AUC-PR of logistic regression on a single item. Bars show mean ± stdev over \(10 \times 10\) cross-validation folds
As evaluation metric, we consider the Area Under the Precision-Recall Curve (AUC-PR) [38], which is more informative than the Area Under the Curve of the Receiver operating characteristic (AUC-ROC) on imbalanced datasets [15, 51]. A random classifier achieves an AUC-PR of 0.225 (positive rate), which is then the reference baseline. A point estimate of the AUC-PR is the mean average precision over the 100 folds [8]. Confidence intervals are calculated using a normal approximation over the 100 folds [19]. We refer to [8] for details and for a comparison with alternative confidence interval methods.
Let us first concentrate on the case of the themes dataset. As a feature selection pre-processing step, we run a logistic regression for each theme, with the theme as the only predictive feature. Fig. 3 reports the achieved AUC-PRs (mean ± stdev over the \(10 \times 10\) cross-validation folds). It turns out that the top three themes (Retention factor, Loyalty, and Commitment) include among their items a question close or exactly the same as the target question. For this reason, we removed these themes (and their items, for the item dataset) from the set of predictive features. The nominal contextual features from Table 1, namely Country, Industry, and Job function, are one-hot encoded.
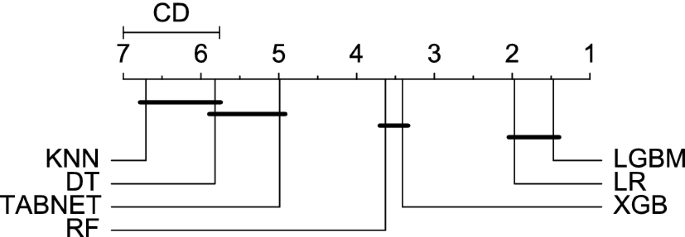
(Unweighted) items dataset: Critical Difference (CD) diagram for the post hoc Nemenyi test at 99.9% confidence level [17]
The performances of the experimented classifiers are shown in Table 4 (top). It includes the AUC-PR (mean ± stdev), the 95% confidence interval of the AUC-PR, and the elapsed timeFootnote 13 (mean ± stdev), including hyper-parameter search, over the \(10 \times 10\) cross-validation folds. AUC-PRs for all classifiers are considerably better than the baseline (more than twice the baseline even for the lower limit of the confidence interval). DT is the fastest classifierFootnote 14, but, together with KNN, also the one with lowest predictive performance. LGBM has the best AUC-PR values and an acceptable elapsed time. LR is runned up, but it is almost as fast as DT. RF has a performance close to LGBM and LR but it slower. XGB is in the middle as per AUC-PR and elapsed time. Finally, TABNET has intermediate performances, but it is two orders of magnitude slower than its competitors.
The statistical significance of the difference of mean performances of classifiers is assessed with two-way ANOVA if values are normally distributed (Shapiro’s test) and homoscedastic (Bartlett’s test). Otherwise, the nonparametric Friedman test is adopted [17, 32]. For the theme dataset, ANOVA was used. The test shows a statistically significant difference among the mean values (family-wise significance level \(\alpha = 0.001\)). The post hoc Tukey HSD test shows a no significant difference between LGBM and LR. All other differences are significant, as shown in Table 4 (top).
As a natural question, one may wonder how the performance would change if the datasets were weighted to reflect the workforce of each country. We collected the employment figures for all the countries in our training dataset for 2018, which was when the survey was carried out. The country-specific employment data was obtained from EurostatFootnote 15 (for the EU member states as well as for the United Kingdom) and from the World BankFootnote 16 (for Russia and Ukraine). The numbers correspond to the country’s total employed population between the ages of 15 and 74. For Russia and Ukraine, however, the number corresponds to the total employed population at any age. We assigned a weight to each instance in our datasets proportional to the workforce in the country of the employee. Weights are considered both in training of classifiers and in the evaluation metric (weighted average precision). The weighted positive rate is 20%. Table 4 (bottom) shows the performances of the classifiers over the weighted dataset. The mean AUC-PR is now smaller for most classifier, the same for LGBM, and slightly better for RF. Standard deviation has increased in all cases. The post hoc Tukey HSD test now shows a small significant difference between LGBM and LR.
Let us now consider the items dataset. Figure 4 shows the predictive performances of single-feature logistic regressions. Table 5 reports the performances of classifiers on all features for both the unweighted and the weighted data. Overall performances of each classifier improve over the theme dataset. Elapsed times also increase due to the larger dimensionality of the dataset. Differences are statistically significant. LGBM and LR are the best classifiers for both the unweighted and the weighted datasets. Figure 5 shows the critical difference diagram for the post hoc Nemenyi test for the unweighted dataset following a significant Friedman test. An horizontal line that crosses two or more classifier lines means that the mean performances of those features are not statistically different. In summary, we conclude that the LR and LGBM classifiers have highest predictive power of the turnover intention.
Weighted theme dataset: CD diagram for the post hoc Nemenyi test at 99.9% confidence level for the top-10 LR feature importances

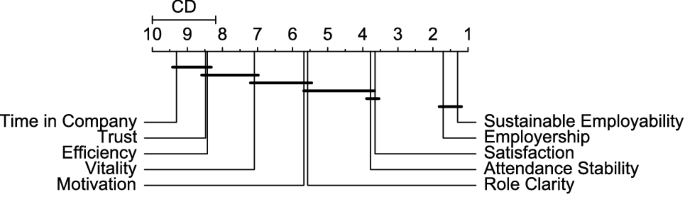
Weighted item dataset: CD diagram for the post hoc Nemenyi test at 99.9% confidence level for the top-10 LR feature importances
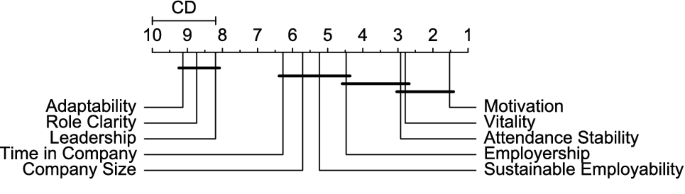
Weighted theme dataset: CD diagram for the post hoc Nemenyi test at 99.9% confidence level for the top-10 LGBM feature importances

Weighted item dataset: CD diagram for the post hoc Nemenyi test at 99.9% confidence level for the top-10 LGBM feature importances
5 Explanatory factors
We examine the driving features behind the two top-performing models found in Sect. 4: the LGBM and the LR. We use each model’s specific method for determining feature importance and aggregate the importance ranks over the 100 experimental folds. This novel approach yields more robust estimates (a.k.a., lower variance) of importance ranks than using a single hold-out set. We do so for the weighted version of both the theme and item datasets.
For a fixed fold, feature importance of the LR model is determined as the absolute value of the feature’s coefficient in the model. The importance of a feature in the LGBM model is measured as the number of times the feature is used in a split of a tree in the model. We aggregate feature importance using their ranks, as in nonparametric tests statistical [32]. For instance, LR absolute coefficients \((|\beta _1|, |\beta _2|, |\beta _3|, |\beta _4|) = (1, 2, 3, 0.5)\) lead to the ranking (3, 2, 1, 4).
The top-10 features w.r.t. the mean rank over the 100 folds are shown in Fig. 6 to Fig. 9 for the theme/item datasets and LR/LGBM models. For the theme dataset (resp., the item dataset), LR and LGBM share almost the same set of top features with slight differences in the mean ranks. For example, the Sustainable Employability, Employership, and Attendance Stability themes are all within the top-five features for both LR and LGBM. For the item dataset, we observe Time in Company, Satisfied Development, and Likelihood to Recommend Employer to Friends and Family to be among the top-five shared features. Interestingly, Gender, a well-recognized determinant of turnover intention, is not among the top features for both datasets. Also, no country-specific effect emerges.
The Friedman test shows significant differences among the importance measures in all four cases in Fig. 6 to Fig. 9.
Further, the figures show the critical difference diagrams for the post hoc Nemenyi test, thus answering the question whether there is any statistical difference among them. An horizontal line that crosses two or more feature lines means that the mean importances of those features are not statistically different. In Fig. 8, for example, the Motivation, Vitality, and Attendance Stability themes are grouped together.
Statistical significance of different feature importance is valuable information when drawing potential policy recommendations as we are able to prioritize policy interventions. For example, given these results, a company interested in employee retention could focus on improving either motivation or vitality, as they strongly influence LGBM predictions and, a fortiori, turnover intention. However, the magnitude and direction of the influence is not accounted for in the feature importance plots of Fig. 6 to Fig. 9. This is not actually a limitation of our (nonparametric) approach. Any association measure between features and predictions (such as the coefficients in regression models) does not allow for causal conclusions. We intend to overcome correlation analysis, as a means to support policy intervention, thought an explicit causal approach.
6 Causal analysis
In Sect. 4, we found LGBM and LR to be the best performing models for predicting turnover intention, and in Sect. 5 we studied the driving features behind the two models. Now we want to assess whether a specific theme T has a causal effect on the target variable, written \(T \rightarrow Y\), given the trained model b (as in black-box) and the contextual attributes in Table 1. We use \(T^*\) to denote the set of remaining themes and \(\tau \) to denote the set of all themes, such that \(\tau = \{T\} \cup T^*\). Establishing evidence for a direct causal link between T and Y would allow our model b to answer intervention-policy questions related to the theme scores. Given our focus on T, in this section we work only with the theme dataset.
We divide all contextual attributes into three distinct groups based on their level of specificity: individual-specific attributes, I, where we include attributes such as Age and Gender; work-specific attributes, W, where we include attributes such as Work Status and Industry; and geography-specific attributes, G, where we include the attribute Country.Footnote 17 We summarize the causal relationships across the contextual attributes, a given theme’s score T, the remaining themes \(T^*\), and the target variable Y using the causal graph \({\mathcal {G}}\) in Fig. 10. The nodes on the graph represent groupings of random variables, while the edges represent causal claims across the variable groupings. Within each of these contextual nodes, we picture the corresponding variables as their own individual nodes independent from each other but with the same causal effects with respect to the other groupings.Footnote 18

Causal graph \({\mathcal {G}}\) showing the three groups of contextual attributes (individual I, geographic G, and working W), the collection of themes (\(\tau \)) and the target variable Y. We are interested in the edge going from \(\tau \) into Y

A more detailed look into \(\tau \) (dashed black-rectangle) where we can see the distinct edges going from T and \(T^*\) into Y. The three incoming edges represent the information flow from W, G, and I into \(\tau \). Here, for illustrative purposes, we have ignored those same edges going into Y
Notice that in Fig. 10 two edges go from \(\tau \) to Y. This is because we have defined \(\tau = \{T\} \cup T^*\) and are interested in identifying the edge between T and Y (marked in red), while controlling for the edges from \(T^*\) to Y (marked in black as the rest). This becomes clearer in Fig. 11 where we detailed the internal structure of \(\tau \). Here, we assume independence between whatever theme is chosen as T and the remaining themes in \(T^*\).Footnote 19 Further, as with the contextual nodes representing the variable groupings, \(T^*\) represents the grouping of all themes in \(\tau \) but T where each theme is its own node and independent of each other while have the same inward and outward causal effects.Footnote 20
Under \({\mathcal {G}}\), all three contextual attribute groups act as confounders between T and Y and thus need to be controlled for along with \(T^*\) to be able to identify the causal effect of T on Y. Otherwise, for example, observing a change in Y cannot be attributed to changes in T as G (or, similarly, I or W) could have influenced both simultaneously, resulting in an observed association that is not rooted on a causal relationship. Therefore, controlling for G, as for the rest of the contextual attributes insures the identification of \(T \rightarrow Y\). This is formalized by the back-door adjustment formula [47], where \(X_{C} = I \cup W \cup G \cup T^*\) is the set for all contextual attributes:
In (1), the term \(P(X_{C}=x_{C})\) is thus shorthand for \(P(I=i, W=w, G=g, T^*=t^*)\). The set \(X_{C}\) satisfies the back-door criterion as none of its nodes are descendants of T and it blocks all back-door paths between T and Y [47]. Given \(X_{C}\), under the back-door criterion, the direct causal effect \(T \rightarrow Y\) is identifiable. Further, (1) represents the joint distribution of the nodes in Fig. 10 after a t intervention on T, which is illustrated by the \( do \)-operator. If T has a causal effect on Y, then the original distribution P(Y) and the new distribution \(P(Y| do (T:=t))\) should differ over different values of t. The goal of such interventions is to mimic what would happen to the system if we were to intervene it in practice. For example, consider a European-wide initiative to improve confidence among colleagues, such as providing subsidies to team-building courses at companies. Then the objective of this action would be to improve the Trust theme’s score to a level t with the hopes of affecting Y.

Pairwise Conover-Iman post hoc test p-value for Trust theme vs Country in a clustered map. The map clusters together countries whose score distributions are similar
The structure of the causal graph \({\mathcal {G}}\) in Fig. 10 is motivated both from the data and from expert knowledge. Here we argue that I, W, and G are potential confounders of T and Y. For instance, consider the Country attribute, which belongs to G. It is sensible to picture that Country affects T as employees from different cultures can have different views on the same theme. Similarly, Country can affect Y as different countries have different labor laws that could make some labor markets more dynamic (reflected in the form of higher turnover rates) than others. We also observe this in the data. In particular, the Country attribute is correlated to each of the themes: the nonparametric Kruskal–Wallis H test [32] shows a p-value close to 0 for all themes, which means that we reject the null hypothesis that the scores of a theme in all countries originate from the same distribution. Consider the Trust theme. To understand which pair of countries have similar/different Trust score distributions, we run the Conover-Iman post hoc test pairwise. The p-values are shown in the clustered map of Fig. 12. The groups of countries highlightedFootnote 21 by dark colors (e.g., Switzerland, Latvia, Finland, Slovenia) are similar among them in the distribution of Trust scores, and dissimilar from the countries not in the group. Such clustering shows that the societal environment of a specific country has some effect on the respondents’ scores of the Trust theme. Similar conclusions hold for all other themes.
Further, both G and I have a direct effect also on W. We argue that country-specific traits, from location to internal politics, will affect the type of industries that developed nationally. For example, countries with limited natural resources will prioritize non-commodity-intensive industries. Similarly, individual-specific attributes will determine the type of work that an individual can perform. For example, individuals with higher education, where education is among the attributes in I, can apply to a wider range of industries than an individual with lower levels of educational attainment.
To summarize thus far, our goal in this section is to test the claim that a given T causes Y given our model b and our theme dataset. To do so we have defined the causal graph \({\mathcal {G}}\) in Fig. 10 and defined the corresponding set \(X_{C}\) that satisfies the back-door criterion that would allow us to test \(T \rightarrow Y\) using (1). What we are missing then is a procedure for estimating (1) over our sample to test our causal claim.
For estimating (1) we follow the procedure in [63] and use the partial dependence plot (PDP) [22] to test visually the causal claim. The PDP is a model-agnostic XAI method that shows the marginal effect one feature has on the predicted outcomes generated by the model [43]. If changing the former leads to changes in the latter, then we have evidence of a partial dependency between the feature of interest and the outcome variable that is manifested through the model output.Footnote 22 We define formally the partial dependence of feature T on the outcome variable Y given the model b and the complementary set \(X_C\) as:
If there exist a partial dependence between T and Y, then \(b_{T}(t)\) should vary over different values of T, which could be visually inspected by plotting the values via the PDP. If \(X_C\) satisfies the back-door criterion, [63] argues, then (2) is equivalent to (1),Footnote 23 and we can use the PDP to check visually our causal claim. Under this scenario, the PDP would have a stronger claim than partial dependence between T and Y, as it would also allow for causal claims of the sort \(T \rightarrow Y\).Footnote 24 Therefore, we could assess the claim \(T \rightarrow Y\) by estimating (2) over our sample of n respondents using:
Using (3), we can now visually assess the causal effect of T on Y by plotting \({\hat{b}}_T\) against values of T. If \({\hat{b}}_T\) varies across values of t, i.e. \({\hat{b}}_T\) is indeed a function of t, then we have evidence for \(T \rightarrow Y\) [63].
However, before turning to the estimation of (3), we address the issue of representativeness (or lack thereof) in our dataset. One implicit assumption used in (3) is that any j element in \(X_C^{(j)}\) is equiprobable.Footnote 25 This is often assumed because we expect random sampling (or, in practice, proper sampling techniques) when creating our dataset. For example, the probability of sampling a German worker and a Belgian worker would be same. This is a very strong assumption (and one that is hard to prove or disprove), which can become an issue if we were to deploy the trained model b as it may suffer from selection bias and could hinder the policy maker’s decisions.
To account for this potential issue, one approach is to estimate \(P(X_C=x_c)\) from other data sources such as official statistics. This is why, for example, we created the country weighted versions of the theme and item datasets back in Sect. 4. Here it would be better to do the same not just for country, but to weight across the entirety of the complementary set.Footnote 26 However, this was not possible. The main complication we found for estimating the weight of the complementary set was that there is no one-to-one match between the categories used in the survey and the EU official statistics. Therefore, it is important to keep this in mind when interpreting the results beyond the context of the paper. By using the (country-)weighted theme dataset, we can rewrite (3) as a country-specific weighted average:
where \(\alpha _j\) is the weight assigned to j’s country, and \(\alpha = \sum _{j=1}^n \alpha ^{(j)}\). Under this approach, we are still using the causal graph \({\mathcal {G}}\) in Fig. 10.
We proceed by estimating the PDP using (4). We define as T our top feature from the LGBM model in the weighted theme dataset, which was the Motivation theme as seen in Fig. 8. We then use the corresponding top LGBM hyper-parameters and retrain the classifier on the entire dataset.Footnote 27 Finally, we compute the PDP for Motivation theme as shown in Fig. 13. We do the same for the LR model for comparison.

PDP for the Motivation theme for both LGBM and LR models using the weighted theme dataset
From Fig. 13, under the causal graph \({\mathcal {G}}\), we can conclude that there is evidence for the causal claim \(T \rightarrow Y\) for the Motivation theme. For the LGBM model, the theme score (x-axis), which ranges from 0 to 10, as it increases the corresponding predicted probabilities of employee turnover decrease, meaning that a higher motivation score leads to a lower employee turnover intention. We see a similar, though smoother, behaviour with the LR model. This is expected as the LGBM can capture non-linear relationships between the variables better than the LR.

PDP for the Adaptability theme for both LGBM and LR models using the weighted theme dataset
We repeat the procedure on a non-top-ranked theme for both models, namely the Adaptability theme (the capability to adapt to changes), to see how the PDPs compare. The results are shown in Fig. 14. In the case of the LGBM, the PDP is essentially flat and implies a potential non-causal relationship between this theme and employee turnover intention. For the LR, however, we see a non-flat yet narrower PDP, which also seems to support a potential non-causal link. This might be due again to the non-linearity in the data, where the more flexible model (LGBM) can better capture the effects in the changes of T than the less flexible one (LR) that can tend to overestimate them.
To summarize this approach for all themes, we calculate the change in PDP, which we define as:
and do this for all themes across the LGBM and LR models. The results are shown in Table 6. Themes are ordered based on the LGBM’s deltas. We note that the deltas across models tend to agree: the signs (and for some themes like Motivation even the magnitudes) coincide. This is inline with previous results in other sections where the LR’s behaviour is comparable to the LGBM’s. Further, comparing the ordering of the themes in Table 6 with the feature rankings in Fig. 6 and 8 , we note that some of the theme’s with the largest deltas (such as Sustainable Emp. and Employership) are also among the top-ranked features. Although there is no clear one-to-one relationship between the two approaches, it is comforting to see the top-ranked themes also having the higher causal impact on employee turnover as it implies some potential shared underlying mechanism.
Table 6 also provides a view on how each theme causally affects employee turnover, where themes with a positive delta cause a decrease in employee turnover. As the theme’s score increases, the probability of turnover decreases. The reverse holds for negative deltas. We recognize that some of these results are not fully aligned with findings by other papers, mainly from the managerial and human resources fields. For example, we find Role Clarity to cause employee turnover to increase, which is the opposite effect found in other studies [29]. These other claims, we note, are not causal. Moreover, such discrepancies are possible already by taking into account that those findings are based on US data while ours on European data. As we argued when motivating Fig. 10, we believe the interaction between geographical and work variables (such as in the form of country-specific labor laws or the health of its economy) affect employee turnover. Hence, the transportability of these previous results into a European context was not expected.
Overall, Table 6 along with both Fig. 13 and Fig. 14 can be very useful to inform a policy maker as they can serve as evidence for justifying a specific policy intervention. For example, here we would advised for prioritizing policies that foster employee motivation over policies that focus on employee and organization adaptability. Overall, this is a relatively simple XAI method that could be used also by practitioners to go beyond claims on correlation between variables of interest in their models.
7 Conclusions
We had the opportunity to analyze a unique cross-national survey of employee turnover intention, covering 30 European countries. The analytical methodologies adopted followed three perspectives. The first perspective is from the human resource predictive analytics, and it consisted of the comparison of state-of-the-art machine learning predictive models. Logistic Regression (LR) and LightGBM (LGBM) resulted the top performing models. The second perspective is from the eXplainable AI (XAI), consisting in the ranking of the determinants (themes and items) of turnover intention by resorting to feature importance of the predictive models. Moreover, a novel composition of feature importance rankings from repeated cross-validation was devised, consisting of critical difference diagrams. The output of the analysis showed that the themes Sustainable Employability, Employership, and Attendance Stability are within the top-five determinants for both LR and LGBM. From the XAI strand of research, we also adopted partial dependency plots, but with a stronger conclusion than correlation/importance. The third perspective, in fact, is a novel causal approach in support of policy interventions which is rooted in causal structural models. The output confirms those from the second perspective, where highly ranked themes showed PDPs with higher variability than lower ranked themes. The value added from the third perspective here is that we quantify the magnitude and direction for the causal claim \(T \rightarrow Y\).
Three limitations of the conclusions of our analysis should be highlighted. The first one is concerned with comparison with related work. Due to the specific set of questions and the target respondents of the GEEI survey, it is difficult to compare our results with related works that use other survey data, which cover a different set of questions and/or respondents. The second limitation of our results consists of a weighting of datasets, to overcome selection bias, which is limited to country-specific workforce. Either the dataset under analysis should be representative of the workforce, or a more granular weighting should be used to account for country, gender, industry, and any other contextual feature. The final and third limitation of our results concern the causal claims. Our analysis is based on a specific and by far non-unique causal view of the problem of turnover intention where, for example, variables such as Gender and Education level that belong to the same group node I are considered independent. The interventions carried out to test the causal claim are reliant on the specified causal graph, which limits our results within Fig. 10.
To conclude, we believe that further interdisciplinary research like this paper can be beneficial for tackling employee turnover. One possible extension would be to collect country’s national statistics to avoid selection bias in survey data or, alternatively, to align the weights of the data to a finer granularity level. Another extension would be to carry out the causal claim tests using a causal graph derived entirely from the data using causal discovery algorithms. In fact, an interesting combination of these two extensions would be to use methods for causal discovery that can account for shifts in the distribution of the data (see, e.g., [41] and [44]). All of these we consider for future work.
Notes
Consider, for example, the recent wave of workers quitting their jobs during the pandemic due to burn-out. See “Quitting Your Job Never Looked So Fun” and “Why The 2021 ‘Turnover Tsunami’ Is Happening And What Business Leaders Can Do To Prepare”.
Two items belonging to a same theme are highly correlated (convergence), whilst two items from different themes are almost uncorrelated (discrimination). See https://en.wikipedia.org/wiki/Construct_validity
As a consequence of construct validity, each item belongs to one and only one theme.
We also experimented with a dataset with both themes and items scores, whose predictive performances were close to the items dataset. This is not surprising, since a theme’s score is an aggregation over a subset of items.
Tests performed on a PC with Intel 8 cores-16 threads i7-6900K at 3.7 GHz, 128 Gb RAM, and Windows Server 2016 OS. Python version 3.8.5.
Notice that the implementations of DT and LR are single-threaded, while the ones of RF, XGB, LGBM, and TABNET are multi-threaded.
Given that we focus only on European countries, the attribute Continent is fixed and thus controlled for. We can exclude it from G.
For example, under the causal graph \({\mathcal {G}}\), \(I \rightarrow W\) implies the causal relationships \(Age \rightarrow Industry\), \(Gender \rightarrow Industry\), \(Age \rightarrow Work \; Status\), \(Gender \rightarrow Work \; Status\), but not \(Age \rightarrow Gender\) nor \(Gender \rightarrow Age\).
We recognize that this is a strong assumption, but the alternative would be to drop all themes except T and fit b on that subset of the data, which would have considerable risks of overestimating the effect of T on Y.
To use the proper causal terminology, all themes have the same parents (the incoming edges from the variables in I, G, and W) and the same child (Y). No given theme is the parent or child of any other theme in \(\tau \).
The clustered map adopts a hierarchical clustering. Therefore, groups can be identified at different levels of granularity.
This under the assumption that the model that is generating the predicted outcomes approximates the “true” relationship between the feature of interest and the outcome variable. This is way [63] emphasizes the importance of having a good performing model for applying this approach.
Here, again, under the assumption that b approximates the “true” where \(b(T) \rightarrow {\hat{Y}}\) contains relevant information concerning \(T \rightarrow Y\).
Under this assumption, we can apply a simple average.
For example, by estimating the (joint) probability of being a German worker who is also female and has a college degree.
References
Akiba, T., Sano, S., Yanase, T., Ohta, T., Koyama, M.: Optuna: A next-generation hyperparameter optimization framework. In: KDD, pp. 2623–2631. ACM (2019)
Alduayj, S.S., Rajpoot, K.: Predicting employee attrition using machine learning. In: IIT, pp. 93–98. IEEE (2018)
Allen, D.G., Hancock, J.I., Vardaman, J.M., Mckee, D.N.: Analytical mindsets in turnover research. J. Org Behav 35(S1), S61–S86 (2014)
Allen, D.G., Shanock, L.R.: Perceived organizational support and embeddedness as key mechanisms connecting socialization tactics to commitment and turnover among new employees. J. Org. Behav. 34(3), 350–369 (2013)
Angrist, J.D., Pischke, J.S.: Mostly Harmless Econometrics. Princeton University Press (2008)
Arik, S.Ö., Pfister, T.: Tabnet: Attentive interpretable tabular learning. In: AAAI, pp. 6679–6687. AAAI Press (2021)
Borisov, V., Leemann, T., Seßler, K., Haug, J., Pawelczyk, M., Kasneci, G.: Deep neural networks and tabular data: A survey. CoRR abs/2110.01889 (2021)
Boyd, K., Eng, K.H., Jr., C.D.P.: Area under the precision-recall curve: Point estimates and confidence intervals. In: ECML/PKDD (3), LNCS, vol. 8190, pp. 451–466. Springer (2013)
Branco, P., Torgo, L., Ribeiro, R.P.: A survey of predictive modeling on imbalanced domains. ACM Comput. Surv. 49(2), 31:1-50 (2016)
Breiman, L.: Random forests. Mach. Learn. 45(1), 5–32 (2001)
Breiman, L., Friedman, J.H., Olshen, R.A., Stone, C.J.: Classification and Regression Trees. Wadsworth (1984)
Chen, T., Guestrin, C.: Xgboost: A scalable tree boosting system. In: KDD, pp. 785–794. ACM (2016)
Cohen, G., Blake, R.S., Goodman, D.: Does turnover intention matter? Evaluating the usefulness of turnover intention rate as a predictor of actual turnover rate. Rev. Pub. Person. Adm. 36(3), 240–263 (2016)
Commission, E.: Joint employment report 2021. https://ec.europa.eu/social/BlobServlet?docId=23156 &langId=en (2021)
Davis, J., Goadrich, M.: The relationship between precision-recall and ROC curves. In: ICML, ACM International Conference Proceeding Series, vol. 148, pp. 233–240. ACM (2006)
Delgado, M.F., Cernadas, E., Barro, S., Amorim, D.G.: Do we need hundreds of classifiers to solve real world classification problems? J. Mach. Learn. Res. 15(1), 3133–3181 (2014)
Demsar, J.: Statistical comparisons of classifiers over multiple data sets. J. Mach. Learn. Res. 7, 1–30 (2006)
DeVellis, R.F.: Scale development: Theory and applications. Sage (2016)
Dietterich, T.: Approximate statistical tests for comparing supervised classification learning algorithms. Neural Comput. 10, 31895–1923 (1998)
Fallucchi, F., Coladangelo, M., Giuliano, R., Luca, E.W.D.: Predicting employee attrition using machine learning techniques. Computer 9(4), 86 (2020)
Firth, L., Mellor, D.J., Moore, K.A., Loquet, C.: How can managers reduce employee intention to quit? J. Manag. Psychol. pp. 170–187 (2004)
Friedman, J.H.: Greedy function approximation: A gradient boosting machine. Ann. Stat. 29(5), 1189–1232 (2001)
Friedman, J.H.: Stochastic gradient boosting. Comput. Stat. Data Anal. 38(4), 367–378 (2002)
Gabrani, G., Kwatra, A.: Machine learning based predictive model for risk assessment of employee attrition. In: ICCSA (4), Lecture Notes in Computer Science, vol. 10963, pp. 189–201. Springer (2018)
Goodman, A., Mensch, J.M., Jay, M., French, K.E., Mitchell, M.F., Fritz, S.L.: Retention and attrition factors for female certified athletic trainers in the national collegiate athletic association division I football bowl subdivision setting. J. Athl. Train. 45(3), 287–298 (2010)
Griffeth, R., Hom, P.: Retaining Valued Employees. Sage (2001)
Griffeth, R.W., Hom, P.W., Gaertner, S.: A meta-analysis of antecedents and correlates of employee turnover: Update, moderator tests, and research implications for the next millennium. J. Manag. 26(3), 463–488 (2000)
Guidotti, R., Monreale, A., Ruggieri, S., Turini, F., Giannotti, F., Pedreschi, D.: A survey of methods for explaining black box models. ACM Comput. Surv. 51(5), 93:1–93 (2019)
Hassan, S.: The importance of role clarification in workgroups: Effects on perceived role clarity, work satisfaction, and turnover rates. Public Adm. Rev. 73(5), 716–725 (2013)
Heneman, H.G., Judge, T.A., Kammeyer-Mueller, J.: Staffing organizations, 9 edn. McGraw-Hill Higher Education (2018)
Hoffman, M., Tadelis, S.: People management skills, employee attrition, and manager rewards: An empirical analysis. J. Polit. Econ. 129(1), 243–285 (2021)
Hollander, M., Wolfe, D.A., Chicken, E.: Nonparametric Statistical Methods, 3 edn. Wiley (2014)
Holtom, B.C., Mitchell, T.R., Lee, T.W., Eberly, M.B.: Turnover and retention research: a glance at the past, a closer review of the present, and a venture into the future. Acad. Manag. Ann. 2(1), 231–274 (2008)
Hom, P., Lee, T., Shaw, J., Hausknecht, J.: One hundred years of employee turnover theory and research. J. Appl. Psychol. 102, 530 (2017)
Hosmer, D.W., Lemeshow, S.: Applied Logistic Regression, 2 edn. Wiley (2000)
Jain, N., Tomar, A., Jana, P.K.: A novel scheme for employee churn problem using multi-attribute decision making approach and machine learning. J. Intell. Inf. Syst. 56(2), 279–302 (2021)
Ke, G., Meng, Q., Finley, T., Wang, T., Chen, W., Ma, W., Ye, Q., Liu, T.: LightGBM: A highly efficient gradient boosting decision tree. In: NIPS, pp. 3146–3154 (2017)
Keilwagen, J., Grosse, I., Grau, J.: Area under precision-recall curves for weighted and unweighted data. PLoS ONE 9(3), 1–13 (2014)
Kim, J.H.: Estimating classification error rate: repeated cross-validation, repeated hold-out and bootstrap. Comput. Stat. Data Anal. 53(11), 3735–3745 (2009)
Kohavi, R.: A study of cross-validation and bootstrap for accuracy estimation and model selection. In: IJCAI, pp. 1137–1145. Morgan Kaufmann (1995)
Magliacane, S., van Ommen, T., Claassen, T., Bongers, S., Versteeg, P., Mooij, J.M.: Causal transfer learning. CoRR abs/1707.06422 (2017)
Mitchell, T.R., Holtom, B.C., Lee, T.W., Sablynski, C.J., Erez, M.: Why people stay: using job embeddedness to predict voluntary turnover. Acad. Manag. J. 44(6), 1102–1121 (2001)
Molnar, C.: Interpretable Machine Learning (2019). https://christophm.github.io/interpretable-ml-book/
Mooij, J.M., Magliacane, S., Claassen, T.: Joint causal inference from multiple contexts. J. Mach. Learn. Res. 21, 99:1–99:108 (2020)
Ngo-Henha, P.E.: A review of existing turnover intention theories. Int J Econ. Manag. Eng. 11, 2760–2767 (2017)
Nijjer, S., Raj, S.: Predictive analytics in human resource management: a hands-on approach. Routledge India (2020)
Pearl, J.: Causality, 2 edn. Cambridge University Press (2009)
Price, J.L.: Reflections on the determinants of voluntary turnover. Int. J. Manpower 22(7), 600–624 (2001)
Sahakyan, M., Aung, Z., Rahwan, T.: Explainable artificial intelligence for tabular data: A survey. IEEE Access 9, 135392–135422 (2021)
Salzberger, T., Koller, M.: The direction of the response scale matters - accounting for the unit of measurement. Eur. J. Mark. 53(5), 871–891 (2019)
Sato, T., Rehmsmeier, M.: Precision-recall plot is more informative than the ROC plot when evaluating binary classifiers on imbalanced datasets. PLoS ONE 10(3), e0118432 (2015)
Schuurmans, J., Frasincar, F., Cambria, E.: Intent classification for dialogue utterances. IEEE Intell. Syst. 35(1), 82–88 (2020)
Seidl, T.: Nearest neighbor classification. In: Encyclopedia of Database Systems, pp. 1885–1890. Springer (2009)
Shu, K., Mukherjee, S., Zheng, G., Awadallah, A.H., Shokouhi, M., Dumais, S.T.: Learning with weak supervision for email intent detection. In: SIGIR, pp. 1051–1060. ACM (2020)
Simmons, R.G., Browning, B., Zhang, Y., Sadekar, V.: Learning to predict driver route and destination intent. In: ITSC, pp. 127–132. IEEE (2006)
Sousa-Poza, A., Henneberger, F.: Analyzing job mobility with job turnover intentions: an international comparative study. J. Econ. Issues 38(1), 113–137 (2004)
Tanova, C., Holtom, B.C.: Using job embeddedness factors to explain voluntary turnover in four European countries. Int. J. Human Res. Manag. 19, 1553–1568 (2008)
Wang, S., Hu, L., Wang, Y., Sheng, Q.Z., Orgun, M.A., Cao, L.: Intention nets: Psychology-inspired user choice behavior modeling for next-basket prediction. In: AAAI, pp. 6259–6266. AAAI Press (2020)
Wang, S., Hu, L., Wang, Y., Sheng, Q.Z., Orgun, M.A., Cao, L.: Intention2basket: A neural intention-driven approach for dynamic next-basket planning. In: IJCAI, pp. 2333–2339. ijcai.org (2020)
William Lee, T., Burch, T.C., Mitchell, T.R.: The story of why we stay: A review of job embeddedness. Annu. Rev. Organ. Psych. Organ. Behav. 1(1), 199–216 (2014)
Wunder, R.S., Dougherty, T.W., Welsh, M.A.: A casual model of role stress and employee turnover. In: Academy of Management Proceedings, vol. 1982, pp. 297–301 (1982)
Wynen, J., Dooren, W.V., Mattijs, J., Deschamps, C.: Linking turnover to organizational performance: the role of process conformance. Public Manag. Rev. 21(5), 669–685 (2019)
Zhao, Q., Hastie, T.: Causal interpretations of black-box models. J. Bus. Econ. Stat. 39(1), 272–281 (2021)
Acknowledgements
The work of J. M. Alvarez and S. Ruggieri has received funding from the European Union’s Horizon 2020 research and innovation programme under Marie Sklodowska-Curie Actions (grant agreement number 860630) for the project “NoBIAS - Artificial Intelligence without Bias”. This work reflects only the authors’ views and the European Research Executive Agency (REA) is not responsible for any use that may be made of the information it contains.
Funding
Open access funding provided by Università di Pisa within the CRUI-CARE Agreement.
Author information
Authors and Affiliations
Corresponding author
Ethics declarations
Conflict of interest
M. Lazzari declares that she is an employee of Effectory Global. J. M. Alvarez and S. Ruggieri declare that they have no conflict of interest.
Additional information
Publisher's Note
Springer Nature remains neutral with regard to jurisdictional claims in published maps and institutional affiliations.
Rights and permissions
Open Access This article is licensed under a Creative Commons Attribution 4.0 International License, which permits use, sharing, adaptation, distribution and reproduction in any medium or format, as long as you give appropriate credit to the original author(s) and the source, provide a link to the Creative Commons licence, and indicate if changes were made. The images or other third party material in this article are included in the article’s Creative Commons licence, unless indicated otherwise in a credit line to the material. If material is not included in the article’s Creative Commons licence and your intended use is not permitted by statutory regulation or exceeds the permitted use, you will need to obtain permission directly from the copyright holder. To view a copy of this licence, visit http://creativecommons.org/licenses/by/4.0/.
About this article

Cite this article
Lazzari, M., Alvarez, J.M. & Ruggieri, S. Predicting and explaining employee turnover intention. Int J Data Sci Anal 14, 279–292 (2022). https://doi.org/10.1007/s41060-022-00329-w
Received:
Accepted:
Published:
Issue Date:
DOI: https://doi.org/10.1007/s41060-022-00329-w