
Abstract
The current study focuses on the development of a predictive model for assessing the fatigue life of welded joints based on measured weld geometry and applied load. Two different materials (S355 and S960) and two different material thicknesses (2 mm and 8 mm) were considered. Experiments on cruciform joints were conducted to evaluate the fatigue performance for different types of weld geometries. A computational model based on FEM and linear elastic fracture mechanics was developed and adapted to fit the experimental results using optimization and surrogate models.
It is observed that the general fatigue behavior differs for the different materials for the same variation in geometry. The fatigue performance depends on a combination of geometrical parameters. The use of FAT curves according to the weld quality systems, e.g., ISO 5817, is insufficient to describe fatigue properties for welds in thin high strength steel, and different geometries within different weld quality levels can give the same fatigue behavior. It is also concluded that the developed computational model is suitable for further development of weld quality systems.
1 Introduction
Many industries are currently making the transition to high strength steel (HSS) in their applications due to the many advantages with its high strength to weight ratio. These materials allow for lightweight designs with high strength while simultaneously keeping the material consumption to a minimum. The fatigue properties do, however, show a high dependency of the weld quality in structural applications manufactured using HSS which requires extensive quality control. This is a problem since recent studies show a weak relation between quality classifications and fatigue properties in the current international standard for weld quality assurance, ISO 5817 [1,2,3,4,5,6]. The amount of various weld defects, and the equipment needed to correctly measure them, in the current standard also makes the quality assessment highly inefficient in practice. To allow the introduction of thin HSS in structural applications, a new standard for weld quality assurance is needed which accurately comprises the fatigue aspect. The standard must also be designed to allow for simpler and more efficient means of quality assessment to improve the communication between design and production departments.
The objective of this study is to develop and assess a method for predicting fatigue life in welded joints based on measured weld geometry and applied load. This involves creating a computational model based on finite element methods which is verified with fatigue testing on welded specimens with various defects in steel of different grades and thickness. The paper also aims to reduce the number of evaluated weld defects needed to simplify the quality assessment procedure in a production environment. The developed method is then used to benchmark the international standard along with other corporate standards for fatigue in thin HSS to create a foundation for further development of a new weld quality standard.
2 Weld quality
The quality of a welded joint is quantified as its durability in static or cyclic loading. According to Stenberg [2], the fatigue strength of a welded joint is mainly governed by process-induced residual stresses and geometrical imperfections/defects which introduces stress concentrations near the weld.
By examination of existing weld fatigue data, the existence of scatter is obvious even for visually indistinguishable test specimens. This discrepancy is the result of variations in the local weld geometry, weld penetration, inclusion density, and residual stresses [3, 5]. Beyond weld throat thickness and ductility in the HAZ, which are important features for static strength, the fatigue properties are strongly influenced by seven additional geometry features [5]. These features comprise weld penetration, cold lap size, inner lack of fusion, weld toe transition radius, undercut size, joint misalignment, and porosity [2]. Figure 1 presents the characterization of a fillet weld used by IIW.
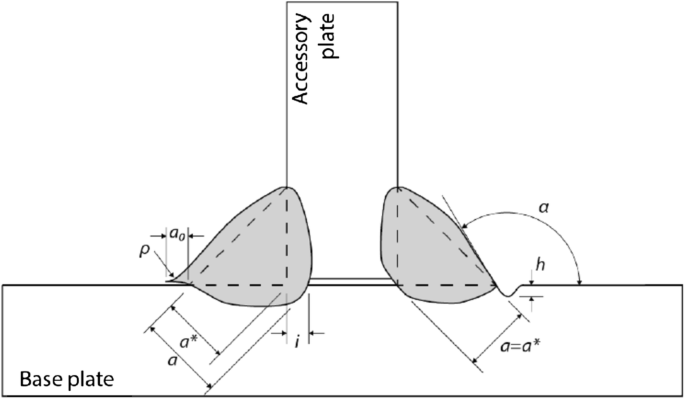
Fillet weld geometry features which significantly influence fatigue strength. a—throat thickness, a*—fillet size, h—depth of undercut, i—weld penetration, ρ—weld toe radius, a0—cold lap length, and α—weld angle
Although it is known that the earlier mentioned geometrical features have the most impact on the fatigue life of welds, their mutual influence is different. Further, their relative difference in influence on the fatigue strength is depending on the type of loading, and thus, virtually similar welds do perform differently in separate structures [3, 5].
2.1 Weld quality systems
The current weld quality system available is the international standard, ISO 5817 [2], which defines a set of quality classes based on acceptance limits for different weld geometry features. A weld can then be assigned a specific quality level based on the weld geometry. ISO 5817 identifies the quality classes as D, C, and B where a weld with the high-quality level B is equated with a higher performance compared to a weld from the D and C class.
A more updated version of weld quality systems was developed by Volvo Group [1, 7]. This system captures the link between weld quality levels and acceptance criteria and the fatigue strength of the welded joints [1]. This new system only considered imperfections which had an influence on the fatigue strength, and the weld quality is divided into the classes VD, VC, and VB (additional classes were added; VS and VE). The classes are defined, respectively, as normal weld quality, high weld quality, and post weld improved quality. Example of acceptance limits for different discontinuities in STD 181-0004 is given in Table 1. The quality system has two practical advantages:
All types of weld imperfections within a weld quality level results in the same fatigue life
By shifting to a level with higher weld quality the resulting fatigue strength is increased with 25%. This roughly corresponds to a doubling of the fatigue life.
An annex with further requirements for welds subjected to fatigue have recently been incorporated ISO 5817 which adjusts the imperfection limits for weld class C and B to conform with the general fatigue classes FAT-63 and FAT-90, respectively. These quality classes are referred to as C63 and B90 [2].
2.2 Digitalized weld quality measurement
The quality of a welded joint has historically been assessed manually using simple mechanical gauges to evaluate the local geometry at discrete points along a weld bead [8].
Recently, more sophisticated assessment procedures have been developed allowing for faster geometry readings with higher accuracy. Stenberg et al. [9] developed a method based on a visual system using the stripe light projection method to measure the local weld geometry. Further, they developed a numerical evaluation algorithm to allow for stable and objective geometry assessments. This concept is now incorporated in the software Winteria® [10] which carries the practice of weld quality assessment into the digital era giving fast and reliable access to the weld information needed for fatigue life assessment of welded structures [8].
3 Experimental setup
3.1 Test specimens
The fatigue experiments are carried out on non-load-carrying cruciform joints, presented with dimensions in Fig. 2.

Non-load carrying cruciform specimens
The aim of the fatigue testing is to obtain an understanding of how the weld fatigue strength is varied with different sets of imperfections in the weld geometry. The weld defects are held constant within a series but varied between them. It is desirable to vary the series enough to cover the imperfection span stated in the current standards to avoid extrapolation issues in later analysis. Table 2 presents the specimen batches and series used in the fatigue testing along with the mean value of measured geometry parameters over the actual series. The study is limited to high-cycle fatigue and the loading is bound to stress ranges corresponding to failure in the life range of 5e4 to 1.2e6 cycles. Specimen failures outside these limits are rejected for further analysis. In total, 153 specimens were fatigue tested. Figure 3 shows examples of the macro geometry of the different setups.

Examples of the macro geometry of the different setups
3.2 Test specimens
The local weld geometry is determined using Winteria ® [10] which scans and evaluates the weld surface. The laser (scanner) is mounted on the weld robot to record the weld geometry cross section while continuously traveling along the entire width of weld bead. Figure 4 presents the setup with the system, and Fig. 5 presents an example of an evaluated weld bead structured with a set of discretized cross sections.

Laser setup for geometry evaluation

Weld geometry representation with discretized cross sections
The geometry data is further processed in Winteria ® where the weld geometry parameters are evaluated in every cross section. This allows for mapping of each parameter and its variation along the entire weld bead. Figure 6 presents an example of the evaluated toe radius variation along an actual weld used in this study. The parameter variation is reduced to one single characterizing value later used in the 2D finite element analysis. For this study, the mean values along the weld bead are used as the characterizing representation of the actual weld, as presented in Table 2 for the different batches.

Example of geometry variation along the weld bead (toe radius)
3.3 Residual stress measurement
The peening effect of sandblasting is known to induce compressive stresses in metallic materials which in turn could affect the fatigue life of the specimens. The first experiment aims to determine the level of induced residual stresses from sandblasting while the second experiment determines the relaxation behavior due to cyclic loading. X-ray diffraction technique was used to measure the residual stresses on the surface with Stresstech G3 Xtronic. The residual stress is measured close to the weld toe before and after cyclic loading. The cyclic count is chosen to the relatively low value of 1e4 cycles to allow for the conclusion that, if there is induced residual stresses, the stresses are relaxed after such an early stage that the effect on the fatigue life can be neglected. The load levels are chosen to 110 MPa which corresponds to the low region of recorded fatigue failures to make the above reasoning applicable to all fatigue specimens. This is done for both untreated and sandblasted welds for batches S355 2 mm and S960 2 mm.
4 Computational fatigue model
4.1 Finite element analysis
The fatigue specimens are modeled as solids in 2D assuming plane strain and utilizing symmetry along the center line of the accessory plates. Further, the opposing half of the specimen is modeled as a beam connected to the solid part using nodal constraint equations, see Fig. 7. The solid part is meshed using quadratic and triangular solid elements with quadratic displacements. The mesh density is increased around the weld toe transition for increased accuracy, see Fig. 7. The beam is meshed using linear Timoshenko beam elements. The analyses are solved as static with linear material and geometric behavior using Young’s modulus E = 200 GPa and Poisson’s ratio ν = 0.3.

Finite element model, boundary condition, axial and bending load cases
The complete computational algorithm is built up in two segments where the first segment solves the model to extract and save the position of the largest principal stress. The geometry is then rebuilt in the second segment with an introduced crack at the position of the largest principal stress. The second segment is looped over a pre-determined set of crack depths, and information needed to obtain the stress intensity factor is exported for every iteration. By benchmarking the obtained stress intensity factor against an analytical solution of a fracture mechanics problem, with similar characteristics, the mesh size is determined with consideration of the tradeoff between computational time and accuracy.
The heat induced by the weld procedure during the manufacturing of the specimens may result in residual bending deformation of the base plate. This initial curvature will induce additional bending stress in the specimen when straightened out under axial loading and must be accounted for in the analysis. This bending contribution is not possible to model with the symmetric model, hence the introduction of the auxiliary beam section.
The model is solved in two separate load cases where load case one is simple axial loading of the symmetric solid section and the beam acts as an unloaded appendage. The second load case is modeled with a displacement at one end which corresponds to straightening out the bent plate during axial loading. Since linear behavior is assumed, the displacement fields from the two load cases can be superimposed to create one coherent solution.
4.2 Crack propagation modeling
The second segment of the computational algorithm is the crack propagation modeling. The specimen is remodeled with a crack at the location of the highest principal stress from the previous segment and solved using the same method with superposition of load cases. The mesh is gradually refined around the crack tip, see Fig. 8. The model is used to compute the stress intensity factor △KI for the current crack depth. The second segment of the algorithm is looped over a set of prescribed crack depths to determine △KI as a discretized function of crack depth a.

FE fracture mechanical model
The stable crack growth region in Paris law [11] can be expressed in the following way:
where C6 and ΔK6 are used instead of the constant C to properly handle the dimensions of the expression. Finally, the fatigue life N can be obtained by rearranging Eq. 1 and integrating over the crack length a:
The critical crack length acr corresponds to the crack length where the stress intensity factor reaches the materials fracture toughness and immediate failure occurs.
With further rearrangement, Eq. 2 can be written on the following form:
which is analogous to the linearized relationship in a S-N curve where:
This coupling between the S-N fatigue data and the fracture mechanics approach is enough to experimentally determine the unknown parameters needed to perform fatigue life calculations with a computational model based on fracture mechanics. The unknown parameters are a0, β, ΔK6, and f(a, geometry).
4.3 Calibration
The computational model is calibrated with the experimental S-N data by finding and assigning optimal values for the unknown Paris’s law parameters a0, β, and ΔK6 to match the computed and experimental fatigue life. This is done separately for each specimen, and the dependency of weld geometry is obtained. The model is calibrated separately for each specimen batch. For simplicity, ΔK6 is set to the representative values of \( 75\ \mathrm{MPa}\sqrt{m} \) and \( 85\ \mathrm{MPa}\sqrt{m} \), for the steel grades S355 and S960 respectively, which reduces the number of unknown parameters. β must be chosen to represent a slope in the S-N diagram. The natural approach is to assign one β to each specimen series in a batch where the slope is already obtained by linear fitting of the S-N data. The weld geometry parameters assigned to each β is set to the mean values over the respective series.
4.3.1 Determination of a0
a0 is determined separately for each specimen using an optimization algorithm. By minimizing the objective function
where Nexp is the experimentally determined fatigue life and Ncomp is the fatigue life evaluated with the computational model, while satisfying the constraint conditions
and
For every specimen, the parameter a0 is obtained with such a precision that the difference between the computed and experimental fatigue life is virtually zero. Every obtained value of a0 is assigned with the geometry parameters for respective specimen.
4.3.2 Multivariate polynomial interpolation
To allow for fatigue life evaluation of an arbitrary weld geometry, the parameters a0 and β must be expressed as functions of the weld parameters. This is done using the polynomial interpolation approach where a0 and β are used as the function values in Eq. 8.
If i number of function values yi is known in n number of independent variables \( \left({x}_i^1,{x}_i^2\dots {x}_i^n\right) \), a set of linear equations can be stated as:
where c0 is a constant and c is a vector containing the n coefficients for the linear terms. H is a symmetric matrix containing the n2 number of coefficients for the quadratic terms. The parameters c and H are presented in Eqs. 9 and 10 respectively.
The obtained linear equation system can be written on the matrix form Ax = B which is solved for the unknown polynomial coefficients. A least-square solution is returned if the number of sample points is larger than the number of unknown coefficients, i.e., if the system is overdetermined [12].
With the associated geometry parameters set as the independent variables, a set of linear equations is obtained and the coefficients of the polynomial expressions can be determined. The geometry parameters are assumed to be independent of each other since the dependency is unknown.
The minimum number of linear equations needed to fit a quadratic polynomial in four variables (TR = toe radius, U = undercut, TS = throat size, and AD = angular deviation) is 21. By accepting the polynomial order one, the number of equations needed is reduced to five. By excluding the dependency of toe radius and angular deviation, the number is further reduced to three which is covered by the experiment scope. Hence, β can be expressed as the following:
The number of equations obtained for a0 is equal to the number of individual specimens which is sufficient for a quadratic polynomial fit. However, since the variable space covered by the experiments is relatively narrow compared to the variable space established in the quality systems, a linear polynomial is used to retain stability during extrapolation. The dependency of all geometry variable is kept, giving the following polynomial expression:
4.3.3 Computational model – flow chart
A flow chart describing the process regarding the computational model is presented in Fig. 9.

Flow chart of the computational model
4.4 Benchmark of weld quality systems
The acceptance limits for geometry parameters applicable to the computational model are extracted from the ISO 5817 and STD 181-0004 quality system, see Tables 3 and 4. A parameter range, covering all weld quality levels, is defined for each discontinuity allowing for a parameter sweep in the three variables, toe radius, undercut, and throat deviation. Throat deviation is substituted for throat size in the parameter sweep to simplify the modeling process. The parameter ranges are presented in Table 5 assuming the nominal throat size is 2 mm and 4.5 mm for plate thickness of 2 mm and 8 mm respectively. Due to the lack of acceptance limits for toe radius in ISO 5817, the fixed values of 1 mm and 4 mm will be assigned in the benchmarking process, representing C63 and B90 respectively. Further, the fatigue response is not examined for discontinuities defined in STD 181-0004 weld quality level VB, since this refers to post-weld treatment quality and is not applicable.
The first approach is to define discontinuity domains with acceptance limits corresponding to each weld quality level. For example, the discontinuity domain for weld class VD ranges from its lower acceptance limits up to the acceptance limits for the next class, VC. By computing the fatigue performance for different sets of parameter values within a weld class, and present it on a S-N diagram, it is possible to map weld geometries from a discontinuity domain to a fatigue performance domain. By comparing the fatigue performance domains for all weld classes with its corresponding FAT value [13], conclusions can be made on the applicability of the quality systems. The second approach is to determine the fatigue strength corresponding to failure at 1e5 cycles for different sets of weld geometry parameters. These are presented in a diagram which represents the fatigue performance for different variations of geometry parameters.
5 Results
5.1 Fatigue test
The results from the fatigue experiments are presented separately for each material batch in Figs. 10, 11, 12, and 13. The fatigue data is presented in the S-N curves with fitted median curves for each series. The natural slope for each fit is presented in the legends. The diagrams presenting the results from the 2-mm batches are supplemented with FAT curves representing the median fatigue curve for each weld quality class from both STD 181-0004 and ISO 5817.

Fatigue test data for S355 8 mm

S-N diagram, S355 2 mm

S-N diagram, S960 8 mm

S-N diagram, S960 2 mm

Nexp-Ncomp diagram, S355 8 mm
5.2 Residual stress relaxation
Table 6 presents the results from the residual stress measurements conducted on the fatigue specimens before and after loading at 110 MPa for 1e4 cycles. The residual stress is presented in both the direction of loading and along the weld bead for both the untreated and sandblasted specimen.

Nexp-Ncomp diagram, S355 2 mm
The results show no indication of relaxation due to cyclic loading for either material batch. It also shows a difference in compressive stress in the untreated specimens between the two steel grades. Further, the sandblasting influence on compressive stresses in the weld toe is much more significant for the S960 steel.
5.3 Verification of computational model
Figures 14, 15, 16, and 17 show Nexp vs. Ncomp for each material grade illustrating the capability of the computational model. The dashed lines represent 50% deviation in computed fatigue life. The Nexp-Ncomp diagrams for 8 mm plate thickness and both material grades show a relatively low difference between computed and experimental fatigue life. The increased scatter of data points for higher fatigue life indicates a loss in performance at higher cycle counts. However, the largest deviation between experimental and computed fatigue life is roughly 50%.
The results for both 2-mm batches show great scatter over the whole experimental range reaching a factor of ten in the difference between experimental and computed fatigue life. This indicates a poor model performance for thin plates.
5.4 Benchmarking of weld quality systems
The benchmarking of the weld quality systems is only conducted for 8-mm steel thickness since the computational model showed a poor performance for the 2-mm specimens.
Figure 18-19 shows the fatigue performance domains corresponding to discontinuities within each weld quality level for STD 181-0004 for the steel grades S355 and S960 respectively.

Nexp-Ncomp diagram, S960 8 mm

Nexp-Ncomp diagram, S960 2 mm

Range of fatigue strength within weld quality levels, STD 181-0004, S355 8 mm

Range of fatigue strength within weld quality levels, STD 181-0004, S960 8 mm

Range of fatigue strength within weld quality levels, ISO 5817 S355 8 mm

Range of fatigue strength within weld quality levels, ISO 5817, S960 8 mm

Parametric study of influence from undercut and toe radius on fatigue strength corresponding to 1e5 cycles, S355 8 mm

Parametric study of influence from undercut and toe radius on fatigue strength corresponding to 1e5 cycles, S960 8 mm
The results show a large performance span within each quality level for both steel grades and a trend of increased fatigue strength for levels with higher weld quality. The results also show a tendency of overlapping performance between quality levels. Further, the S960 steel grade show better performance at higher load levels but a rapid decline with decreased load levels. By inspection of the fatigue strength at the lower bounds of the quality classes VD and VC, an increase in fatigue strength of roughly 20–30% is found for S355 and 10–25% for S960. The difference varies with the load level. This finding causes an overestimation of life for higher load levels as well as an underestimation of life for lower load levels.
Figures 20 and 21 show the fatigue performance domains corresponding to discontinuities within each weld class from ISO 5817 for the steel grades S355 and S960 respectively.
The results show wide performance spans for both steel grades with some overlapping between the weld classes C63 and B90. By once again comparing the fatigue strength corresponding to the lower bounds of classes C63 and B90, an increase in fatigue strength of 50–60% is found for S355 and 15–60% for steel grade S960.
Figures 22 and 23 show the influence from undercut and toe radius on the fatigue strength corresponding to failure at 1e5 cycles for the two steel grades S355 and S960 respectively. Both diagrams also show the span in variation of the toe radius which the experimental data covers. The colored areas correspond to quality levels within STD 181-0004.
The results from the parametric study shows that the fatigue strength for the S355 material is increasing with larger weld toe radius; it also shows that a larger undercut gives lower fatigue strength. The general behavior for the S960 material is partly different showing a lesser influence on the fatigue strength due to change in the toe radius compared to the S355 material. The behavior in fatigue strength for the two materials is very similar for a small toe radius.
6 Conclusions
The current study focusses on the development of a computational fatigue model for assessing the fatigue life of welded joints based on measured weld geometry and applied load. This work can be concluded with the following points.
The developed computational fatigue model is considered to be validated for fillet welded joints with 8-mm thickness and could be used as a tool for benchmarking of different weld quality systems and further development and upgrades these systems.
The residual stress shows no relaxation at a nominal stress range of 110 MPa for both material grades, S355 and S960. It is also observed that the sandblasting influence on compressive stresses in the weld toe is much more significant for the S960 steel.
The developed model does not describe the fatigue behavior for the fillet welds with 2-mm plate thickness. The ASTM condition [14, 15] for the validity of linear elastic fracture mechanics is not fully satisfied since the crack length is too large in comparison to the thickness of the plates used for the specimens. This tells that the plastic zone near the crack may be relatively large compared to the dimensions of the load carrying area at the weld. This can be one of the reasons for the poor model behavior for the 2-mm-thick plates.
Fatigue performance depends on a combination of the geometry parameters. The general fatigue behavior due to a change in the geometry parameters and weld quality is different for the fillet welds in S355 and the S960 materials.
Different geometries within different weld quality classes can give the same fatigue behavior. The results show that the fatigue performance for the weld quality levels spans over a large range and that there is overlap between the quality levels. The overlap essentially means that one specimen geometry within one of the quality levels can give the same fatigue performance as a different geometry within a different quality level.
References
Volvo Group Standard (2013) BSTD181-BST0004
ISO/TC 44/SC 10 (2011) ISO 5817:2007, Welding - fusion-welded joints in steel, nickel, titanium and their alloys - quality levels for imperfections
Barsoum Z, Samuelsson J, Jonsson B, Björkblad A (2012) Fatigue design of lightweight welded vehicle structures: influence of material and production procedures. J Eng Manuf 226(10):1736–1744
Barsoum Z, Jonsson B (2011) Influence of weld quality on the fatigue strength in seam welds. Eng Fail Anal 18(10):971–979
Jonsson B, Samuelsson J, Marquis G (2012) Development of weld quality criteria based on fatigue performance. Welding in the World 56(11):153–169
Barsoum Z, Samuelsson J (2006) Fatigue assessment of cruciform joints welded with different methods. Steel Research International 77(12):882–888
Karlsson N, Lennander P-H (2005) Analysis of fatigue life in two weld class systems. Master thesis, Linköping
Stenberg T, Barsoum Z, Åstrand E, Ericson Öberg A, Schneider C, Hedegård J (2017) Quality control and assurance in fabrication of welded structures subjected to fatigue loading. Welding in the World 56(5):1–13
Stenberg T, Lindgren E, Barsoum Z (2012) Development of an algorithm for quality inspection of welded structures. J Eng Manuf 226(6):1033–1041
www.winteria.se
Andersson T.L, Fracture mechanics – fundamentals and applications (1995), 2nd Edition, ISBN: 0-8493-8974-7
MathWorks, MATLAB Online, https://www.mathworks.com
Hobbacher A. (2016), Recommendation for fatigue design of welded joints and components. Springer international publishing: ISBN:978-3-319- 23756-5
E739-10 ASTM (2015) Standard practice for statistical analysis of linear linearized stress-life and strain-life fatigue data, West Conshohocken. In: PA
Ljustell P (2013) Fatigue crack growth experiments and analyses - from small scale to large scale yielding at constant and variable amplitude loading. KTH School of Engineering Sciences, PhD thesis, Stockholm
Acknowledgements
Open access funding provided by Royal Institute of Technology. SCANIA CV is acknowledged for the financial support of this work. Swerea KIMAB is acknowledged for manufacturing the specimens.
Author information
Authors and Affiliations
Corresponding author
Additional information
Publisher’s note
Springer Nature remains neutral with regard to jurisdictional claims in published maps and institutional affiliations.
Recommended for publication by Commission XIII - Fatigue of Welded Components and Structures
Rights and permissions
Open Access This article is distributed under the terms of the Creative Commons Attribution 4.0 International License (http://creativecommons.org/licenses/by/4.0/), which permits unrestricted use, distribution, and reproduction in any medium, provided you give appropriate credit to the original author(s) and the source, provide a link to the Creative Commons license, and indicate if changes were made.
About this article

Cite this article
Stenberg, T., Barsoum, Z., Hedlund, J. et al. Development of a computational fatigue model for evaluation of weld quality. Weld World 63, 1771–1785 (2019). https://doi.org/10.1007/s40194-019-00777-2
Received:
Accepted:
Published:
Issue Date:
DOI: https://doi.org/10.1007/s40194-019-00777-2