
Abstract
The current seismic risk assessment is based on two discrete approaches, actual and probable, validating afterwards the produced results. In the first part of this research, the seismic risk is evaluated from the available data regarding the mean statistical repair/strengthening or replacement cost for the total number of damaged structures (180,427 buildings) after the 7/9/1999 Parnitha (Athens) earthquake. The actual evaluated seismic risk is afterwards compared to the estimated probable structural losses, which is presented in the second part of the paper, based on a damage scenario in the referring earthquake. The applied damage scenario is based on recently developed damage probability matrices (DPMs) from Athens (Greece) damage database. The seismic risk estimation refers to 750,085 buildings situated in the extended urban region of Athens. The building exposure is categorized in five typical structural types and represents 18.80 % of the entire building stock in Greece. The last information is provided by the National Statistics Service of Greece (NSSG) according to the 2000–2001 census. The seismic input is characterized by the ratio, a g/a o, where a g is the regional peak ground acceleration (PGA) which is evaluated from the earlier estimated research macroseismic intensities, and a o is the PGA according to the hazard map of the 2003 Greek Seismic Code. Finally, the collected investigated financial data derived from different National Services responsible for the post-earthquake crisis management concerning the repair/strengthening or replacement costs or other categories of costs for the rehabilitation of earthquake victims (construction and function of settlements for earthquake homeless, rent supports, demolitions, shorings) are used to determine the final total seismic risk factor.
Introduction
The destructive results of a strong earthquake in urban centres with densely concentrated population and buildings, such as Parnitha’s earthquake in 7/9/1999, constitute valuable data for the efficient seismic risk assessment in two levels: in individual level regarding the structural losses of each existing building type, and in general level regarding the total losses of the referring earthquake. The efficient earthquake resistance policy of urban planning poses as priority the seismic strengthening (rehabilitation) of vulnerable structures and equivalently demands the reliable seismic risk assessment. The seismic risk can be described as the probability of loss at a given site and is obtained through the convolution of three parameters: exposure, vulnerability and seismic hazard. A fourth parameter may then be added through which the seismic risk can be related to a social or economic loss; several studies have been developed internationally aiming at the urban seismic risk assessment (Costa et al. 2010; Crowley et al. 2009, 2010a; Erdik et al. 2003, 2006; Lantada et al. 2009; Marulanda et al. 2013; RADIUS 1999; RISK-UE 2001–2004; Rivas-Medina et al. 2013; Salgado-Gálvez et al. 2015; Silva et al. 2015; SYNER-G 2009–2011; Vicente et al. 2010; Carreño 2012; Crowley et al. 2010b). The seismic vulnerability and risk assessment of distinguished building classes, representative of the Southern Europe building stock and the development of damage scenarios for estimating structural losses due to a probable future earthquake concentrate during the past decades intense research interest [Baltzopoulou et al. 2012; Eleftheriadou and Karabinis 2011, 2013; Kappos et al. 2007; Karabinis and Baltzopoulou 2006; National Policy for the Strengthening of Existing Structures (EPANTIK)—Technical Champer of Greece (TCG) 2001, 2005; Pitilakis et al. 2006; Sarris et al. 2009] aiming at the rational management and mitigation of seismic risk. As mentioned, components of seismic risk assessment are (1) the seismic hazard; (2) the “exposure” that is under the seismic risk, such as the density of population, the structural inventory (number and types of buildings); and (3) the seismic vulnerability analysis of existing buildings. The term seismic risk includes all the probable losses in the affected area after the occurrence of a future seismic event taking into account human losses, injuries, domestic losses, loss of stored material, pause of work, loss of income, cost for the temporary accommodation of earthquake victims, repair/strengthening or replacement cost, etc.
Parnitha’s earthquake on 7/9/1999 with magnitude M = 5.9 and small focal-depth (<20 km) occurred at a small epicentral distance (18 km) from the historical centre of the city of Athens in Greece, a densely populated area. The maximum macroseismic intensity in Modified Mercalli Scale, reported in the meizoseismal area, was recorded equal to 9 (Eleftheriadou and Karabinis 2011, 2013). Among the devastating impacts of the earthquake were included 143 casualties in 27 collapsed buildings, about 1600 injuries and 1,80,945 buildings which developed different degrees of damage in the affected area which is constructed with a total number of 7,50,085 buildings according to the 2000 national census, an information provided by the National Statistical Service of Greece (NSSG) (2000). Among 180,427 damaged buildings with reported characterization of the seismic damage in the post-earthquake surveys, (a) 2716 structures were characterised as under demolition—collapse (label damage: black) (representing the 1.51 % of the total damaged population of buildings), (b) 6423 structures developed extensive non-repairable damages (label damage: red) in the structural system (representing the 3.56 %), (c) 56,533 structures were reported with moderate (label damage: yellow) repairable damages (representing the 31.33 %) and (d) 114,755 structures developed light (label damage: green), also repairable damages (representing the 63.60 %). The last mentioned information is collected from a recently created damage database (Eleftheriadou and Karabinis 2011, 2013). The building label—damage calibration, is based on instructions provided by earthquake planning and protection organization (EPPO 1997) using the method of rapid visual screening (RVS) during the conduct of post-earthquake surveys in Greece. The last is based on a macroscopic inspection of the building to define whether the building’s seismic resistance is adequate against future expected seismic forces, as follows:
-
(a)
Green building appropriate for use, without or with slight damage, or building without reduced seismic resistance. It develops hairline non-diagonal cracks of horizontal structural elements in the reinforced concrete structural systems or minor cracking in partitions, infills and ceiling.
-
(b)
Yellow building temporarily non appropriate for use, with moderate damage and reduced seismic resistance. It develops light or moderate damages in the structural system and infills.
-
(c)
Red building non appropriate for use, with very heavy damage. It develops severe joint damages and some structural elements have reached ultimate capacity with permanent drift. There is the possibility of a sudden collapse.
-
(d)
Black building that has partially or totally collapsed or is under demolition.
The current seismic risk assessment is based on two discrete approaches, actual and probable, validating afterwards the produced results. In the first part of the research the seismic risk is evaluated taking into account the structural system and the non structural elements (statistical repair/strengthening or replacement cost) for the total number of the damaged buildings in the referring earthquake. Available data regarding the mean compatible cost (€/m2) and the mean constructed area (m2/building) per damage level have been used. The total number of the structures with available the damage characterization (1,80,427 buildings) derived from earlier research has been taken into consideration for the seismic vulnerability assessment. The information about the damage level was available for 1,78,058 damaged buildings and they were discriminated into structural types along with the level of macroseismic intensity (Eleftheriadou and Karabinis 2011, 2013). The mean compatible repair cost (€/m2) and the mean constructed area per building according to the damage level were evaluated based on information derived from the Post Earthquake Crisis Management Division of Aharnes (Karabinis and Baltzopoulou 2006) and Ano Liosia (Kappos et al. 2007) region and referred in replacement of collapsed (black) or heavily damaged buildings (red) and repair/strengthening of buildings with moderate damages (yellow) or just repairs of light (green) damages. Note that, depending on the type and the extent of damage, local or general, there were respective provisions for local repair or general repair/strengthening of the building (Karabinis and Baltzopoulou 2006). The seismic risk assessment based on statistical data regarding the compatible (budget approved according to the ministry’s provisions) repair/strengthening or replacement cost taking into account the total number of damaged buildings (1,80,427) in Attica is, afterwards, compared to the seismic risk estimated for the entire constructed area (7,50,085 buildings) according to the structural losses of a damage scenario in the referring earthquake (in terms of equivalent area for replacement) which is presented in the second part of the paper. The seismic risk assessment of buildings in Attica according to a damage scenario, based on information about the building stock which was obtained both from the National Statistics Service of Greece (NSSG) and pilot earlier studies (National Policy of Seismic Strengthening of Existing Structures (EPANTIK)–Technical Champer of Greece (TCG) 2005, 2005) in the city of Xanthi (Karabinis et al. 2008), (National Technical Chamber of Greece 2006) (National Policy of Seismic Strengthening of Existing Structures–EPANTIK 2005). The seismic input is characterized by the ratios of a g/a o, where a g is the PGA of Athens earthquake which has been evaluated from the estimated in earlier research macroseismic intensities (Eleftheriadou and Karabinis 2011, 2013) and ao is the unique value of the design PGA according to the hazard map of the 2003 Seismic Code. The mean damage loss estimation of buildings based on the evaluated a g/a o ratios and on recently developed damage probability matrices—DPMs and vulnerability curves for five discrete structural building types (Eleftheriadou and Karabinis 2011, 2013). Finally, the collected investigated financial data derived from different National Services responsible for the post-earthquake crisis management regarding the repair/strengthening or replacement costs or other categories of costs for the rehabilitation of earthquake victims (construction and function of settlements for earthquake homeless, rent supports, demolitions, shorings) determine the final total seismic risk factor.
Seismic risk assessment based on repair cost data
Published data regarding the vulnerability/structural damages of buildings in Attica Region in Greece (Eleftheriadou and Karabinis 2011, 2013) have been used for the seismic risk assessment derived from post-earthquake surveys conducted in the extended urban area of Athens after Parnitha’s (7/9/1999) earthquake wherein are included reports from the first or the second phase of inspections and the “collapse” or “under demolition” files. The earlier created research damage database contains details regarding1,80,427 buildings with the characterization of damage (Eleftheriadou and Karabinis 2013). Among them, information was available for 1,78,578 buildings to be classified in structural types along with the level of macroseismic intensity, as presented in Table 1. The total number of buildings distributed in each region according to the macroseismic intensity is also presented in the same Table based on the information of the 2000 national census, information provided by the National Statistical Service of Greece (2000). The label, damage calibration, is according to the damage characterization in the post-earthquake surveys (light damage—green, moderate damage—yellow, heavy damage—red, collapse—black) based on provisions of the Earthquake Planning and Protection Organization in Greece.
Data regarding the mean compatible cost (€/m2) and the mean constructed area (m2/building), derived from relative studies (Karabinis and Baltzopoulou 2006; Kappos et al. 2007) and evaluated from available data regarding repairs/strengthenings or replacements of buildings from the post earthquake crisis management division of Aharnes (Karabinis and Baltzopoulou 2006) and Ano Liosia (Kappos et al. 2007) region after Parnitha’s earthquake, per damage level, have been used for the seismic risk assessment, as presented in Table 2. An additional process includes the results of the total data of both studies (Karabinis and Baltzopoulou 2006; Kappos et al. 2007) presented in the same Table. In particular, data derived from the study of Aharnes(1) region refer to (a) repairs of 51 buildings with light damage—green corresponding to 12,610 m2 total constructed area and 4,14,427 € approved compatible repair budget; (b) repair/strengthening of 1586 buildings with moderate damage—yellow corresponding to 452,658 m2 total constructed area and 28,190,433 € approved compatible repair budget and (c) replacement of 919 buildings with heavy damage or under demolition—red corresponding to 174,906 m2 total constructed area and 51,904,399 € approved compatible repair budget. Respectively, data derived from the study of Ano Liosia region refer to: (a) repair of 403 buildings with light damages—green corresponding to 59,547 m2 total constructed area and 2,113,919 € approved compatible repair budget; (b) repair/strengthening of 350 buildings with moderate damages—yellow corresponding to 61871 m2 total constructed are and 5,716,880 € approved compatible repair budget; and (c) replacement of 230 buildings with heavy damages or under demolition—red corresponding to 25,974 m2 total constructed area and 9,379,211 € approved compatible repair budget.
The compatible (budget approved according to the ministry’s provisions) repair cost (Table 3) has been evaluated from the total number of structures (180,427 buildings) which developed different degree, type and extent of damage after Parnitha’s earthquake according to the mean compatible repair cost (€/m2) and the mean constructed area (m2/building) per damage level of the previous studies. Note that, in Table 3, there is discrimination between heavily damaged buildings (red) and collapses (black). The equivalent replacement area in Km2 has been evaluated from the ratio of the compatible repair cost (Μ€) divided by the mean compatible replacement cost (297, 361 and 305 €/m2) according to the data of TAS of Aharnes and Ano Liosia and the total number of the previous data (3539 structures). The total compatible repair cost and the equivalent replacement area have been evaluated as follows: (a) 2450.020 Μ€ and 8.249 Κm2, from Aharnes study; (b) 1887.821 Μ€ and 5.229 Κm2, from Ano Liosia study; and (c) 2118.899 Μ€ and 6.947 Κm2, regarding both studies (3539 buildings). The results are presented analytically in Table 3. In addition, the actual repair cost has been evaluated from the compatible cost by multiplying it with the numerical factors 1.78, 1.46 and 1.73 which represent the ratio of the considered in Attica, at that period of time, actual replacement cost of 528 €/m2 divided to the compatible replacement cost, as it has been evaluated in the previously mentioned studies, 297, 361 and 305 €/m2, respectively (Table 3).
The seismic risk has also been evaluated after the distribution of structures (178,578 structural buildings) in damage levels and levels of the macroseismic intensity with the use of the mean compatible repair cost and the constructed area per damage level (Table 4). The results for the total compatible repair cost fluctuate from 1869.72 to 2419.708 Μ€, whereas the values for the total equivalent replacement area fluctuate from 5.179 to 8.147 Κm2. Moreover, Table 5 presents the total compatible repair cost (2095.224 Μ€) regarding the information of both studies (Karabinis and Baltzopoulou 2006; Kappos et al. 2007) distributed in damage levels and levels of macroseismic intensity for the 178,578 structural buildings. According to the results, in meizoseismal areas with IX macroseismic intensity the total compatible repair cost was estimated at 424.781 Μ€, representing 20.27 % of the total cost, and details regarding 27,089 damaged buildings were recorded (15.17 % out of the 178,578 total damaged Attica’s buildings) in an area with a total of 32,574 buildings (4.40 % out of the 740,315 total building population in Attica). The last information was derived from the the reports of National Statistics Service of Greece (Tables 1, 5). The 54.49 % of the total repair cost was evaluated in regions with VII and VII+ macroseismic intensities where most of the damaged buildings were found (percentage 58.31 % out of the 178,578 total damaged Attica’s buildings). The evaluated compatible cost per damage level and the level of macroseismic intensity is presented in Table 5, based on the data derived from the previous studies, regarding 3539 structures.
Methodology of estimated seismic risk
The estimated structural losses in monetary terms included the total existing building stock of the extended urban region of Athens (Greece) according to the National Statistics Service of Greece and based on a damage scenario in the referring earthquake and on information collected from earlier studies (EPANTIK-TCG 2005). The applied damage scenario is based on recently developed DPMs from the extended urban region of Athens created damage database (Eleftheriadou et al. 2009, Eleftheriadou and Karabinis 2011, 2013). The seismic risk estimation refers to 750,085 buildings situated in municipalities of the region of Attica (National Statistical Service of Greece 2000). The building exposure is categorized into five typical structural types and represents 18.80 % of the entire building stock in Greece. The last information is provided by the National Statistical Service of Greece (NSSG) according to the 2000–2001 census. The seismic input is characterized by the ratio, a g/a o, where a g is the regional peak ground acceleration (PGA) which is evaluated from the earlier estimated research macroseismic intensities, and a o is the PGA according to the hazard map of the 2003 Greek Seismic Code.
Vulnerability curves
The building inventory of each municipality in Attica was classified in five structural types, as described in Table 6, according to the applied damage scenario. The last was developed from correlating the degree of the developed structural damages with the mean damage factors—MDF (in monetary loss). Table 6 presents the MDFs for the selected building types and the seismic demand characterized from the ratio a g/a o = 1, where a g is the earthquake PGA and a o is the design PGA of the 2003 Seismic Code. In addition, Fig. 1 presents the vulnerability curves for different levels of seismic input in ratios of a g/a o regarding the structural type (Eleftheriadou 2009; Eleftheriadou and Karabinis 2011, 2013). The level of seismic design and detailing in Greece, could generally be discriminated in four subclasses: (1) Without Seismic Code (or pre-seismic code: year of construction before 1959): RC buildings with practically very low level of seismic design or no seismic design, and poor quality of detailing; (2) The 1st Greek Seismic Code of 1959 (year of construction 1959–1985): RC buildings with low level of seismic design (corresponding approximately to pre-1980 codes in Southern Europe); (3) The 1st Greek Seismic Code of 1959 with the 1985 Supplement Clauses (construction between 1985 and 1995): RC buildings with medium level of seismic design (corresponding approximately to post-1980 codes in S. Europe) and reasonable seismic detailing of RC members; (4) The New Greek Seismic Codes (construction after 1995) RC buildings with adequate level of seismic design according to the new generation of seismic codes (similar to Eurocode 8) and ductile seismic detailing of RC members including sufficient descriptions for detailing and anchorage.

Seismic input
The seismic input is characterized by the ratio, α g/a o, where α g is the regional PGA (122 studied sub-regions of Attica) which is evaluated using simple expressions from the earlier estimated research macroseismic intensities in the Modified Mercalli Intensity Scale-MMI, and a o is the PGA by which each municipality of Attica is characterized according to the hazard map of the 2003 Seismic Code (Eleftheriadou and Karabinis 2011, 2013; Baltzopoulou et al. 2012). The estimated intensity values vary from III to IX (Table 7). The Peak Ground Acceleration, a g in cm/s2, is evaluated from the macroseismic intensity using the empirical relationship (Koliopoulos et al. 1998) of Eq. (1) for the area studied:
Seismic loss factors
The structural damage factor is connected to the loss of the building’s capacity to undertake the loads, usually expressed in the inelastic behaviour by the diagram of base shear versus the displacement at the top of the building. Similarly, the economic damage factor (DF) is connected to the building’s loss R c in € (equal to the repair/strengthening cost of damages) to the replacement cost (C RB) of the building (without damages), as expressed in Eq. (2):
The replacement cost (C RB) of the building (without damages) is evaluated by multiplying the total area A of the building (in m2) with the compatible replacement cost c per unit area (€/m2), according to Eq. (3).
The seismic loss factor (in monetary terms) is calculated according to the economic mean damage factor % (MDFi) for each building type (1) by evaluating the mean ratio of repair/strengthening (regarding minor/moderate damage) or replacement (regarding heavy damage/total collapse) cost (Rc) to the replacement cost (C RB) of the building with the application of Eq. (4):
where n is the total number of buildings belonging to the building type i, Rc is the repair/strengthening or replacement cost of the building (€), C RB is the replacement cost of the building (€), A is the total area of the building (m2) and c is the compatible replacement cost per unit area (€/m2).
The seismic loss factors, and, therefore, the estimation of seismic risk, are calculated for every structural type regarding the extended urban study area. The seismic risk loss factor R i signifies the economic losses for repair/strengthening of damages (where R c is the repair/strengthening cost of damages) as the equivalent area for replacement in m2 (R ci = R i × c) and is estimated from the application of Eq. (5). The seismic risk loss factors have been both estimated for every single municipality and the total extended urban region of Athens according to Eq. (6) for the five structural types (i = 1–5).
The normalized seismic risk ratio r (%) regarding the total number of buildings is estimated from the numerical value R divided to the total area of the buildings situated in the total region of Attica, as presented in Eq. (7). The seismic risk ratio regarding the total population of buildings in Greece, V (‰) is estimated according to Eq. (8) from the numerical value R divided to the total area of the building stock (Α c), respectively. The pre-mentioned seismic risk factors are equal to the predictable economic loss regarding the building inventory of the studied area and the entire country, respectively. It is considered that the building exposure of Greece (in 2000) refers to 3,990,970 buildings with 6,635,860 floors and estimated mean area per floor 100 m2.
Seismic loss factors have also been estimated in a municipality (OTA) level (R ΟΤΑ, r ΟΤΑ, V ΟΤΑ) for every single sub-region for the planning of appropriate and cost-effective earthquake mitigation measures and also for prioritizing emergency plans. In addition, the seismic loss factor r′ (%) of every municipality is estimated from R ΟΤΑ divided by the area of the building exposure situated in the specific municipality from the application of Eq. (9). Finally, the seismic loss estimation (in monetary terms) R c (€) is estimated from the equivalent area for replacement in m2 multiplied by the compatible replacement cost per unit area c (€/m2) according to Eq. (10):
Note that the estimated monetary loss does not include indirect loss (casualties, injuries, interruption of jobs, etc.). In addition, in the current research, the approved budgets according to the ministry’s provisions have been investigated regarding settlements for the earthquake victims, rent supports, demolitions, shorings, etc.
Building inventory in the extended urban region of Athens
The information about the building inventory of the studied area has been provided by the National Statistics Service of Greece (NSSG) according to the results of the 2000–2001 census. The collected data per municipality (Table 8) comprise (a) the total number of buildings; (b) the number of buildings categorized according to the construction materials (reinforced concrete, masonry, metal or wood or stone or other), in accordance with the applied damage scenario; (c) the number of buildings categorized according to the construction materials combined with the year of construction (Seismic Code); (d) the number of buildings categorized according to the construction materials and the period of construction combined with the height (number of floors: one floor; two floors; three-to-five floors; more than five floors).
According to the results of analysis of buildings constructed in entire Attica region (750,085 buildings),
-
The majority (75.4 %) refer to RC structures (565,583 buildings), 15.7 % of the total number represent masonry (117,481 buildings) and 8.9 % (67,021 buildings) have been constructed with metal, wood, stone or other structural material (Fig. 2).
Fig. 2 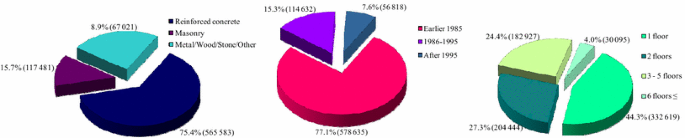
Structural type, period of construction (seismic code) and number of floors for 750,085 buildings in Attica
-
The devastating majority of buildings (77.1 %) have been constructed earlier than 1985 (without or with low seismic code—578,635 buildings): 15.3 % constructed during the period 1986–1995 (moderate seismic code—114,362 buildings) and only the 7.6 % (56,818 buildings) have been constructed with the contemporary provisions (high level of seismic code) (Fig. 2). In addition, among the buildings with structural system of reinforced concrete (Fig. 3), 74.3 % have been constructed earlier than 1985, 17.4 % constructed during the period 1986–1995 and the 8.4 % after 1995.
Fig. 3 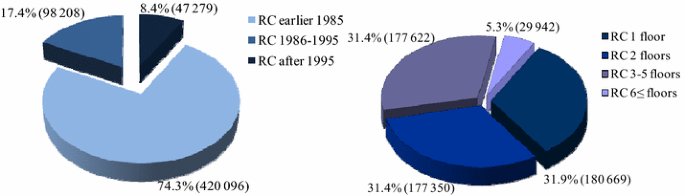
Period of construction (seismic code) and number of floors for reinforced concrete buildings in Attica (565,583 buildings)
-
As far as RC buildings are concerned, 63.3 % are of low height (up to 2 floors), 31.4 % are of moderate height (3–5 floors) and only 5.3 % are considered high structures (Fig. 3) as per the construction practices of Greece and generally of Southern Europe.
-
Finally, the 85.9 % of structural type of masonry or metal/wood/stone/other has been constructed earlier than 1985 and 97.1 % of these buildings are of low height (up to 2 floors) as presented in Fig. 4.
Fig. 4 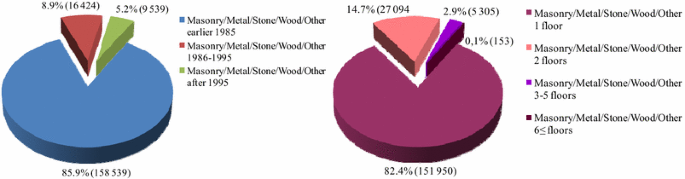
Period of construction (seismic code) and number of floors for buildings with structural system of masonry, stone, wood, metal or other material in Attica (184,502 buildings)


Pilot studies of the National Programme for Earthquake Management of Existing Buildings (National Policy for the Strengthening of Existing Structures (EPANTIK)–Technical Champer of Greece (TCG) 2001, 2005), that have been conducted in three Greek cities (Xanthi, Tripoli, Corfu), were used to define the mean constructed area per floor and structural type and the distribution of the number of buildings with more than two floors (3–5 floors and 6 ≤floors). The total data referred to 1368 buildings deriving from the case studies of Xanthi (698 buildings), Tripoli (508 buildings) and Corfu (162 buildings). After the process it is concluded that (1) RC buildings constructed earlier than 1985 are distributed as follows: 47 % with 3 floors, 38.6 % with 4 floors and 14.4 % with 5 floors. (2) RC buildings constructed during the period 1986 up to 1995 are distributed as follows: 39.1 % with 3 floors, 27.6 % with 4 floors and 33.3 % with 5 floors. (3) RC buildings constructed after 1995 are distributed as follows: 54.5 % with 3 floors, 25.5 % with 4 floors and 20.0 % with 5 floors. (4) Masonry structures have 3 floors. (5) All buildings with height of more than 6 floors have practically 6 floors. (6) The ground floor area for RC buildings is considered equal to 150, 133 and 180 m2 regarding the three construction periods (earlier than 1985, 1986–1995, after 1995), respectively. (7) The ground floor area for the rest structural systems (masonry/metal/wood/stone/other) is considered equal to 74 m2.
Seismic risk assessment of buildings based on a damage scenario
After the classification of the building inventory of Attica into five structural types, the seismic risk factors R (m2), r (%) and V (‰) are estimated based on the 7/9/1999 Athens earthquake (Table 9). An additional loss scenario for the numerical value of the ratio a g/a o = 1 has also been examined (Table 4) according to the hazard map of the 2003 Seismic Code.
According to the results, the total mean predicted losses due to Parnitha’s earthquake in terms of equivalent area for replacement arise in R = 8.8477 Κm2 and the normalized seismic risk ratio r = 4 % regarding the total number of buildings of entire Attica in a region with total constructed area of 222.749 Κm2. 74.5 % of the predicted losses refer to RC buildings constructed earlier than 1985, a structural type which constitutes 67.8 % of the total constructed area (Table 10; Fig. 5). The highest values of the Mean Damage Factors-MDF according to the applied damage scenario refer to masonry and the structural system of stone, wood, metal or other which cumulatively constitute 7.4 % of the total constructed area in the region with 13.3 % of the total seismic risk (R).

Distribution of the number of buildings, floors, constructed area and the predicted seismic risk in Attica (a g according to the 7/9/1999 Parnitha earthquake) per structural type
The distribution of the number of buildings in Attica (750,085 buildings) per structural type according to the macroseismic intensity is presented in Fig. 6. The respective ratio α g/a o has also been evaluated, where α g is the regional PGA (122 studied regions of Attica) from the earlier estimated research macroseismic intensities in the Modified Mercalli Intensity Scale-MMI after Parnitha’s earthquake and a o is the PGA by which each municipality of Attica is characterized according to the hazard map of the 2003 Seismic Code.

Distribution of total number of buildings in Attica (750,085 buildings) categorized into structural types according to the intensity level of the 7/9/1999 Parnitha earthquake
The seismic risk has been estimated according to structural type and the level of the seismic input of Parnitha’s earthquake in terms of macroseismic intensity and also of the respective ratio α g/a o (Table 11). As observed (Table 11), 9.9 % (74,250/750,085) of the total population of Attica buildings are constructed in the meizoseismal regions wherein the macroseismic intensity values were recorded equal to VIII (α g/a o = 1.63) and IX (α g/a o = 2.44 and α g/a o = 3.42). Among these buildings (Fig. 7) 49.9 % (37,085/74,250) are reinforced concrete buildings constructed earlier than 1985 and 24.5 % (18,160/74,250) have structural system of masonry or other structural material (stone, wood, metal, other). Furthermore, in meizoseismal regions the constructed area constitutes 8.8 % of the total constructed area in Attica and the estimated seismic risk represents 25.8 % of the total risk R (Table 11; Fig. 7). Finally, the seismic risk factors have also been estimated per municipality (OTA) for entire Attica. Table 12 and Fig. 8 present the values of estimated risk factors in the meizoseismal regions.

Seismic risk R for entire Attica per level of seismic input according to the damage scenario

Seismic risk R and r′ per municipality in the meizoseismal area
Correlation analysis of the seismic risk assessment derived from the probable estimated damage was based on the 7/9/1999 earthquake and the statistical repair costs
The seismic risk for the referring earthquake has been estimated at 8.8477 Km2 structural losses, as described in the second part of the study, based on a structural damage loss scenario for five building types regarding the total number of structures in Attica (750,085 buildings). The respective structural losses in monetary terms based on the replacement costs of Post Earthquake Crisis Management Divisions (297, 361, 305 €/m2 according to studies of Karabinis and Baltzopoulou (2006) and Kappos et al. (2007) and the total data of the studies have been estimated equal to 2627.77, 3194.02 and 2698.55 Μ€ (Table 13), noticing an increase of 7.2, 69.2 and 27.4 % in comparison with the structural losses which have been evaluated according to the compatible repair costs per damage level for the total number of damaged structures (180,427 buildings).
In case that the evaluated risk, regarding the total number of buildings (180,427) that developed damage, is based on data with 2556 buildings derived from the sub-region of Aharnes, it presents a satisfactory correlation (2450.02 Μ€) to the estimated seismic risk value (2627.77 Μ€) which is based on the structural damage loss scenario according to damage data of the referring earthquake.
The herein presented research constitutes a supplementary study in earlier researches for the seismic risk assessment (Baltzopoulou et al. 2012; Eleftheriadou et al. 2014). The results of the 1st (Volos) and 2nd (ITSAK-AUTH) damage scenarios are close, the 3rd (ARISTION) differs overestimating seismic risk while the 4th presented herein (Eleftheriadou 2009) scenario (R 4 = 8.8477 Κm2) presents the lower values due to the fact that the vulnerability models have been derived from the actual response of the exposed building stock to the referring earthquake. The differences in MDFs of the different scenarios have as a result different estimated values of the structural losses in constructed area per structural type and of the predicted seismic risk.
Table 14 and Fig. 9 present the investigation for several categories of the collected financial data up to 2001 derived from different National Services responsible for the post-earthquake crisis management regarding the repair/strengthening or replacement costs or other categories of costs for the rehabilitation of earthquake victims (construction and function of settlements for earthquake homeless, rent supports, demolitions, shorings) which determine the final total seismic risk factor (904.769 Μ€). A significant amount (49.7 %) of the total expenses has been spent in construction and function of settlements for earthquake homeless, rent supports, technical support of earthquake victims, contacts of post-earthquake surveys, etc. (449.890 Μ€). The repair/replacement cost of habitants, schools, hospitals, monuments, demolitions or temporary supports constitute 50.3 % of the total earthquake cost. The compatible replacement cost raised in 143.8 Μ€ for 3200 under demolition buildings (red) with mean replacement cost 44,938 €/building. The compatible repair/strengthening cost for 9525 moderately damaged buildings (yellow- damage characterization in the 2nd round of inspection) raised in 146.735 Μ€ with mean repair cost 15,405 €/building. In addition, the approved budget for the design of repair/strengthening or replacement cost was estimated according to approved work invoices by the Ministry. One-third of the budget was state donation and two-thirds was given as loan without interest to earthquake victims. There were also set upper values for repair/strengthening and replacement cost equal to 191 €/m2 and 382 €/m2, respectively, for habitants up to 120 m2. Note that the referred costs in the National Service for the Rehabilitation of Earthquake Victims do not include an important number of cases with costs of repaired damages that were executed without national relief either because the budget was not approved for subsidy or because they were not declared referring basically in light/minor damages or because the buildings were insured. Finally, the compatible replacement cost referred only to constructed area up to 120 m2 per property. In general, the total seismic risk assessment should include the losses in monetary terms of all private and public structures, the temporary accommodation of earthquake victims, domestic losses, stored material, income, injuries, human losses, etc.

Categories of costs 2 years after the 7/9/1999 (Ministry of Public Works/EPPO 2001) earthquake (Ministry of Public Works/EPPO 2001)
Conclusions
The current seismic risk assessment is based on two discrete approaches, actual and probable, validating afterwards the produced results. In the first part of the research the seismic risk is evaluated taking into account the structural system and the non structural elements (statistical repair/strengthening or replacement cost) for the total number of the damaged buildings in the referring earthquake. Available data regarding the mean compatible cost (€/m2) and the mean constructed area (m2/building) per damage level have been used. The total number of the damaged structures (180,427 buildings) derived from earlier research has been taken into consideration for the seismic vulnerability assessment. For 178,058 damaged buildings was available the information about the damage level and they were categorized into structural types along with the level of macroseismic intensity. The mean compatible repair cost (€/m2) and the mean constructed area per building according to the damage level were evaluated based on information derived from the Post Earthquake Crisis Management Division—TAS of Aharnes and Ano Liosia region and referred in replacement of collapsed or under demolition buildings (red) and repair/strengthening of buildings with moderate damages (yellow) or just repairs of light (green) damages. Note that, depending on the type and the extent of damage, local or general, there were respective provisions for local repair or general repair/strengthening of the building. The structural losses in monetary terms for the total number of damaged structures (180,427 buildings) are evaluated equal to 2450.0, 1887.8 and 2118.9 Μ€ based on the previously mentioned statistical seismic risk data. The seismic risk assessment based on statistical data regarding the compatible (budget approved according to the ministry’s provisions) repair/strengthening or replacement cost taking into account the total number of damaged buildings (180,427) in Attica is, afterwards, compared to the seismic risk estimated for the entire constructed area (750,085 buildings) according to the structural losses of a damage scenario in the referring earthquake (in terms of equivalent area for replacement) which is presented in the second part of the paper. The seismic risk assessment of buildings in Attica, according to a damage scenario, was based on information about the building stock which was obtained both from the National Statistical Service of Greece (NSSG) and earlier pilot studies (Xanthi 2005, 2007; National Technical Chamber of Greece 2006) of the National Policy of Seismic Strengthening of Existing Structures. The seismic input is characterized by the ratios of a g/a o, where a g is the PGA of Athens earthquake which has been evaluated from the estimated in earlier research macroseismic intensities and ao is the unique value of the design PGA according to the hazard map of the 2003 Seismic Code. The intensity values that were estimated vary from III to IX for the 122 studied municipalities of Attica. The mean damage loss estimation of buildings was based on the evaluated a g/a o ratios and on recently developed Damage Probability Matrices—DPMs and vulnerability curves for five discrete structural building types. The numerical values of the seismic risk factors after the application of the described methodology are estimated as follows: (1) R = 8.8477 Κm2 and r = 4.0 %, for a g according to the Parnitha’s earthquake; (2) R = 9.6542 Κm2 and r = 4.3 %, for a g according to the 2003 Greek Seismic Code. The estimated seismic losses (8.8477 Κm2) refer to 74.4 % RC buildings constructed before 1985 and represent 67.8 % of the total constructed area. In regions where observed high-intensity levels VIII and IX it is found that the buildings represent (1) 9.9 % of the total number of buildings in Attica, (2) 8.8 % of the total constructed area and (3) 25.8 % of the total estimated seismic risk (8.8477 Κm2). Finally, in regions where observed intensity levels ΙΙΙ to VI found that the buildings represent the: (1) 50.3 % of the total number of buildings in Attica, (2) 42.3 % of the total constructed area and (3) 13.2 % of the total estimated seismic risk.
A correlation analysis is performed between the actual and probable estimated seismic risk validating the produced results. The respective structural losses in monetary terms based on the replacements costs of Post Earthquake Crisis Management Divisions—TAS have been estimated equal to 2627.77, 3194.02, and 2698.55 Μ€, noticing an increase of 7.2, 69.2 and 27.4 % in comparison with the structural losses which have been evaluated according to the compatible repair costs per damage level for the total number of damaged structures (180,427 buildings). The actual repair cost has been evaluated from the compatible cost by multiplying it with the numerical factors 1.78, 1.46 and 1.73 which represent the ratio of the considered in Attica at that period of time (1999) actual replacement cost (according to the information of the National Policy of Seismic Strengthening of Existing Structures—EPANTIK programme by the Earthquake Planning and Protection Organization—EPPO and Technical Chamber of Greece) of 528€/m2 to the compatible replacement cost as evaluated in the previously mentioned the studies, 297€/m2, 361 €/m2 and 305 €/m2. In case that the evaluated risk, regarding the total number of buildings (180,427) that developed damage, is based on data with 2556 buildings derived from the TAS of Aharnes it presents a satisfactory correlation (2450.02 ΜЄ) to the estimated seismic risk value (2627.77 ΜЄ) which is based on the structural damage loss scenario according to damage data of the referring earthquake.
Finally, the collected investigated financial data derived from different National Services responsible for the post-earthquake crisis management regarding the repair/strengthening or replacement costs or other categories of costs for the rehabilitation of earthquake victims (construction and function of settlements for earthquake homeless, rent supports, demolitions, shorings) determine the final total seismic risk factor. It is concluded, according to the investigation of collected financial data concerning several categories of public costs until September 2001, that in the total evaluated cost of 904.769 Μ€ the compatible repair damage cost for private and utility structures constitutes only the 50.3 %. The previously mentioned data are derived from the reports of different National Services responsible for the post-earthquake crisis management regarding the repair/strengthening or replacement costs or other categories of costs for the rehabilitation of earthquake victims (demolitions, rehabilitations). An important percentage (49.7 %) of the total cost refers to other actions like construction and function of settlements for earthquake homeless, rent supports, conducting of surveys and autopsies, technical/management support and immediate measures for the financial relief or earthquake victims (449.890 Μ€).
References
Baltzopoulou AD, Eleftheriadou AK, Karabinis AI (2012) Seismic vulnerability and risk assessment of the building stock of Attica (Greece) and correlation to the actual repair cost. In: Proceedings of the 15th World Conference on Earthquake Engineering, Lisbon, Portugal
Carreño ML, Cardona OD, Barbat AH (2012) New methodology for urban seismic risk assessment from a holistic perspective. Bull Earthq Eng 10(2):547–565. doi:10.1007/s10518-011-9302-2
Costa AC, Sousa ML, Carvalho A, Coelho E (2010) Evaluation of seismic risk and mitigation strategies for the existing building stock: application of LNECLoss to the metropolitan area of Lisbon. Bull Earthq Eng 8:119–134. doi:10.1007/s10518-009-9160-3
Crowley H, Colombi M, Borzi B, Faravelli M, Onida M, Lopez M, Polli D, Meroni F, Pinho R (2009) Comparison of seismic risk maps for Italy. Bull Earthq Eng 7(1):149–180. doi:10.1007/s10518-008-9100-7
Crowley H, Colombi M, Crempien J, Erduran E, Lopez M, Liu H, Mayfield M, Milanesi M (2010a) GEM1 seismic risk report: part 1, GEM Technical Report 2010-2015. GEM Foundation, Pavia, Italy
Crowley H, Cerisara A, Jaiswal K, Keller N, Luco N, Pagani M, Porter K, Silva V, Wald D, Wyss B (2010b) GEM1 seismic risk report: part 2, GEM Technical Report 2010-5. GEM Foundation, Pavia, Italy
Earthquake Planning and Protection Organization (EPPO) (1997) Guidelines and forms for immediate post-earthquake screening of the buildings appropriateness for use (in Greek). Athens, Greece
Eleftheriadou AK (2009) Contribution to the seismic vulnerability assessment of reinforced concrete structures (in Greek). PhD Thesis, Democritus University of Thrace (D.U.Th.), Department of Civil Engineering, Sector of Engineering Structures, Laboratory of Reinforced Concrete, Xanthi, Greece
Eleftheriadou AK, Karabinis AI (2011) Development of damage probability matrices based on Greek earthquake damage data. J Earthq Eng Eng Vibr Springer 10(1):129–141. doi:10.1007/s11803-011-0052-6
Eleftheriadou AK, Karabinis AI (2013) Evaluation of damage probability matrices from observational seismic damage data. Int J Earthq Struct Techno Press 4(3):299–324
Eleftheriadou AK, Baltzopoulou AD, Karabinis AI (2014) Seismic vulnerability and risk assessment of buildings in the area struck by the (7-9-1999) Parnitha’s earthquake and comparison with the actual repair cost. Open J Earthq Res Sci Res 3:115–134
Erdik M, Fahjan Y (2006) Damage scenarios and damage evaluation in ‘assessing and managing earthquake risk’. In: Oliveira CS, Roca A, Goula X (eds) Assessing and managing earthquake risk. Springer, Netherlands, pp 213–237
Erdik M, Aydinoglu N, Fahjan Y, Sesetyan K, Demircioglu M, Siyahi B, Durukal E, Ozbey C, Biro Y, Akman H, Yuzugullu O (2003) Earthquake risk assessment for Istanbul metropolitan area. J Earthq Eng Eng Vibr Springer 2(1):1–25
Kappos AJ, Lekidis V, Panagopoulos G, Sous I, Theodulidis N, Karakostas Ch, Anastasiadis T, Salonikios T, Margaris B (2007) Analytical estimation of economic loss for buildings in the area struck by the 1999 Athens earthquake and comparison with statistical repair costs. Earthq Spectra 23(2):333–355
Karabinis AI, Baltzopoulou AD (2006) Correlation of damage factor and repair cost in structures damaged after the 7th-9-1999 Athens earthquake (in Greek). In: Proceedings of 15th Greek Concrete Conference Vol B3, pp 294–304
Karabinis A, Baltzopoulou A, Plesias A, Vlahos S, Papakonstantinou K (2008) Supplementary information of seismic risk in a pilot study in Xanthi. Technical Champer of Greece, Research report, Xanthi
Koliopoulos PK, Margaris BN, Klimis NS (1998) Duration and energy characteristics of Greek strong motion records. J Earthq Eng 2(3):391–417
Lantada N, Pujades LG, Barbat AH (2009) Vulnerability index and capacity spectrum based methods for urban seismic risk evaluation. A comparison. Nat Hazards 51(3):501–524
Marulanda MC, Carreño ML, Cardona OD, Ordaz MG, Barbat AH (2013) Probabilistic earthquake risk assessment using CAPRA: application to the city of Barcelona, Spain. Bull Earthq Eng 69:59–84
Ministry of Public Works—Earthquake Planning and Protection Organization (2001) The 7th of September 1999 Earthquake: Rehabilitation of earthquake victims. Report of measures and actions, Athens, Greece
National Policy of Seismic Strengthening of Existing Structures (EPANTIK)—Technical Champer of Greece (TCG) (2001), Vulnerability assessment of buildings (in Greek). Final report, Technical Team No.I.2, Athens, Greece
National Policy of Seismic Strengthening of Existing Structures (EPANTIK)—Technical Champer of Greece (TCG) (2005) Existing buildings inventory and estimation of seismic vulnerability and risk of buildings in Xanthi (Greece). EPANTIK project
National Statistical Service of Greece (2000) Buildings census of the 1st of December 2000. Greece, Athens
National Technical Chamber of Greece (2006) Pre-Earthquake Reinforcement of Existing Buildings (in Greek), National programme for earthquake management of existing buildings, Athens, Greece
Pitilakis K, Alexoudi M, Argyroudis S, Anastasiadis A (2006) Seismic risk scenarios for an efficient risk management: The case of Thessaloniki (Greece). In: Wasti ST, Ozcebe G (eds) Advances in earthquake engineering for urban risk reduction, Springer, pp 229–244
RADIUS project (1999) Risk Assessment Tools for Diagnosis of Urban Areas Against Seismic Disasters. Villes impliquées: Tijuana-Mexico, Guyaquil-Ecuador, Antofagasta-Chile, Skopje-FYROM, IzmirTurkey, Addis Ababa-Ethiopia, Tachkent-Ouzbekistan, Bandung-Indonesia, Zigong-China. Report: United Nations Initiative towards Earthquake Safe Cities, Website: http://www.geohaz.org/radius/
RISK-UE project (2001–2004) An advanced approach to earthquake risk scenarios, with applications to different European cities. Website: http://www.risk-ue.net
Rivas-Medina A, Gaspar-Escribano JM, Benito B, Bernabé MA (2013) The role of GIS in urban seismic risk studies: application to the city of Almería (southern Spain). Nat Hazards Earth Syst Sci 13:2717–2725
Salgado-Gálvez MA, Cardona OD, Carreño ML, Barbat AH (2015) Probabilistic seismic hazard and risk assessment in Spain. Book. Monografías de Ingeniería Sísmica. CIMNE, MIS69, ISBN: 978-84-993307-7-3. doi:10.13140/2.1.3976.7366
Sarris A, Loupasakis C, Soupios P, Trigkas V, Vallianatos F (2009) Earthquake vulnerability and seismic risk assessment of urban areas in high seismic regions: application to Chania City, Crete Island, Greece. Nat Hazards 54(2):395–412
Silva V, Crowley H, Varum H, Pinho R (2015) Seismic risk assessment for mainland Portugal. Bull Earthq Eng 13(2):429–457
SYNER-G (2009–2011) Systemic Seismic Vulnerability and Risk Analysis for Buildings, Lifeline Networks and Infrastructures Safety Gain. Research Project, European Commission, 7th Framework Programme, Contract Number: 244061
Vicente R, Parodi S, Lagomarsino S, Varum H, Mendes Silva J (2010) Seismic vulnerability and risk assessment: case study of the historic city centre of Coimbra, Portugal. Bull Earthq Eng 9(4):1067–1096. doi:10.1007/s10518-010-9233-3
Author information
Authors and Affiliations
Corresponding author
Rights and permissions
Open Access This article is distributed under the terms of the Creative Commons Attribution 4.0 International License (http://creativecommons.org/licenses/by/4.0/), which permits unrestricted use, distribution, and reproduction in any medium, provided you give appropriate credit to the original author(s) and the source, provide a link to the Creative Commons license, and indicate if changes were made.
About this article

Cite this article
Eleftheriadou, A.K., Baltzopoulou, A.D. & Karabinis, A.I. Urban seismic risk assessment: statistical repair cost data and probable structural losses based on damage scenario—correlation analysis. Int J Adv Struct Eng 8, 133–150 (2016). https://doi.org/10.1007/s40091-016-0118-9
Received:
Accepted:
Published:
Issue Date:
DOI: https://doi.org/10.1007/s40091-016-0118-9