
Abstract
In this exploratory descriptive study, changes in one cohort’s responses to an authentic statistical investigation at the commencement of years 3 and 4 were analysed. Forty-four students made predictions by interpreting a data table of historical monthly temperatures, represented these data and explained their reasoning. An Awareness of Mathematical Pattern and Structure (AMPS) framework was extended to analyse students’ responses at five increasing levels of predictive reasoning. More developed predictive reasoning was observed in year 4 than for year 3, as well as large individual differences in both years. Most year 4 students (87%) made predictions within the historical range, relative to half the same cohort in year 3 (54%). More year 4 students (79%) made predictions based on extraction, clustering and aggregation of these data than those in year 3 (51%). Year 4 students noticed patterns such as seasonal trends and variability in these data and observed measures of central tendency. By year 4, 57% of students’ representations demonstrated transnumeration using extracted data from the table, including pictorial, column and line graphs. However, most students’ representations and explanations of these data lagged behind their predictions at both year levels.
Introduction
While formal statistical practices are not generally accessible to students in the primary years, the principles underpinning statistical concepts and reasoning—the ability to interpret and represent data, to make inferences and to develop an understanding of probability and variability—are critical to mathematical reasoning and statistical literacy (Lehrer & English, 2018; Makar & Rubin, 2018; Pfannkuch, 2018; Watson, 2018; Watson et al., 2020). The foundations of statistics essentially begin with data exploration whereby students engage in authentic problems using self-collected or real data, decide what is worth noticing (i.e., identifying attributes of the phenomena) and organise, structure, visualise and represent data (Lehrer & Schauble, 2000; Makar, 2014, 2016). Such learning can commence in the early years of schooling and should be promoted within and beyond mathematics curricula (Ben-Zvi et al., 2018). Understanding data is often described in mathematics curricula under Statistics and Probability (Australian Curriculum and Reporting Authority, [ACARA], 2022). In the first 3 years of schooling, outcomes typically address simple probabilities of the likelihood of events such as: “Identify outcomes of familiar events involving chance and describe them using everyday language such as will happen, won’t happen or might happen” (ACARA, 2022, [Year 1, ACMSP262]). Year 3 students are expected to create, interpret and compare displays and recognise simple variation in results. By year 4, they “construct suitable data displays from given data including tables and graphs” and “evaluate the effectiveness of different displays in illustrating data features including variability” (ACARA, 2022, [Year 4, ACMSPO97]). These expectations create new conceptual and pedagogical challenges for students and educators.
Predictions are an everyday occurrence, where chance events may be interpreted in the context of underlying causal (deterministic) or random variation (uncertainty). While different meanings can be attributed to the term ‘variation’, students’ interpretation of real data in context is fundamentally about ‘change’ or ‘scatter’ in data (Watson et al., 2022, p. 3). In making predictions, the data context as well as content knowledge and expectation of the individual making the predictions will influence the accuracy of the predictions (Ben-Zvi & Aridor-Berger, 2016; Frischemeier & Schnell, 2021). Students may often overemphasise determinism and ignore chance, or alternatively overemphasise chance overlooking the possibility of making reliable predictions (Lehrer & Schauble, 2017). One of the challenges is determining how students use an understanding of variation to reason about their predictions. Acknowledging students’ pre-existing beliefs is central to this problem (Frischemeier & Schnell, 2021).
One of the aims of early mathematics and statistics education is to support students in making predictions that have a high probability of being accurate (Watson, 2006), while acknowledging that ‘real-world’ experiences are uncertain, and multiple alternatives are often reasonable. Many studies have confirmed that even young children can understand the likelihood of chance (Burrill & Biehler, 2011; Supply et al., 2020). Watson (2006) describes the term ‘chance’ as a ‘precursor to probability’ which is less formal and more intuitive than probability (p. 127). The concept of probability underpins predictive reasoning: ‘Probability can quantify the likelihood of something happening based on existing data. Prediction on the other hand, is about determining an outcome based on existing data, without necessarily quantifying the likelihood or determining why’ (Kinnear & Clark, 2014, p. 335). Predictive reasoning moves beyond the concept of chance alone to determine why, often based on an emerging understanding of generalisation and variability. Students may form generalisations about a dataset by viewing data holistically, finding patterns and relationships between values and noticing variation between individual data points.
Although there are emerging studies of young students’ statistical concepts, these do not yet provide a coherent picture of the early development of statistical reasoning, including an emerging understanding of variability. The description and progression of such early development is not well articulated in current curricula or pedagogical programs (ACARA, 2022). For example, do concepts such as distribution, aggregation, predictive and inferential reasoning, variability and generalisation emerge simultaneously or in sequence? There is increasing evidence that young students can develop informal inferential reasoning (IIR) (Makar, 2016). However, Watson et al. (2022) raise the issue that more research ‘is needed to illustrate the way in which students engage with data-learning experiences and to provide evidence of the way in which student learning about variation is fostered within multi-curricula/discipline learning contexts’ (p. 2). In order to advance the field, we need to distinguish young students’ informal statistical thinking—influenced by their contextual knowledge, intuitions or idiosyncratic beliefs—from decision-making based on reasoning about real data. Thus, the main aim of our research is to investigate how primary students apply their awareness of structure to developing statistical concepts and meta-representational competence within real-data contexts. From there, we can develop targeted pedagogical strategies or frameworks to embed statistical concepts in early mathematics and Science, Technology, Engineering and Mathematics (STEM) learning. Moreover, our research contributes to a more coherent understanding of the role of pattern-seeking, abstraction and generalisation in mathematics learning.
An exploratory, descriptive 3-year longitudinal design study of students from year 3 through to year 5 investigated their predictive reasoning from a ‘real-world’ dataset. In phase 1 of the study, year 3 students were found frequently to ignore the data, instead favouring idiosyncratic predictions (Oslington et al., 2020). However, some students who used predictive reasoning demonstrated concepts of aggregation, variation and generalisation. In phase 2 reported here, we describe shifts in the students’ predictive reasoning from years 3 to 4. We also looked for any evidence of emerging notions of variability and generalisation. Two research questions were addressed:
-
1.
How did students’ interpretation of structural features of the data support their predictive reasoning?
-
2.
How did students’ predictions, representations and explanations of their predictions shift from year 3 to year 4?
Literature review
A range of studies conducted over recent years has provided substantial evidence of primary students’ engagement in informal statistical reasoning not usually considered accessible to young students (Ben-Zvi et al., 2018; Leavy et al., 2018; Suh et al., 2021). Chick et al. (2018) explored students’ emerging ideas of variation, while Frischemeier and Schnell (2021) investigated year 4 students’ reasoning when comparing groups using modal clumps, medians and hat plots. In another study of year 3 students (Makar, 2014), participants developed a concept of average, which included middle or representative values as well as outliers, the construction of a reference population and considered variability between samples. Year 5 students have also been found to use repeated sampling to infer aggregate properties of a population (Aridor & Ben-Zvi, 2017). Further studies explore young students’ emerging concepts such as inferential reasoning (diSessa, 2004; Makar & Rubin, 2009; Watson, 2018; Watson et al., 2022) and predictive reasoning (English, 2012; Kinnear & Clark, 2014; Oslington et al., 2020, 2021).
Studies focused on young students’ data representations provide rich evidence of the importance of transnumeration in making sense of data. Estrella (2018) described 5- to 7-year-olds’ ability to extract, organise and represent data in a variety of ways. In another study on representation of data with high-ability year 1 students, Mulligan (2015) observed transnumeration of temperature data representing early forms of bivariate graphing. Students’ initial representations consisted of a series of vertical bars or lines, with more advanced examples joined at the apex of the bars creating simple line graphs. The representations included five common structural components—sequences, structured counting, shape and alignment, equal spacing and partitioning. Mulligan (2015) indicated that students who had ‘learnt to construct number lines and rectangular grids accurately in Kindergarten seemed to intuitively construct appropriate graphical representations and focused on coordinating vertical and horizontal axes’ (p. 662).
A limited number of studies have focused explicitly on students’ interpretation, construction and representations of data tables (e.g. English, 2012; Guimarães et al., 2021; Kinnear, 2018). Using a familiar context, English (2012) found that 6-year-olds could recognise common values and total values across rows and notice high and low values. Similarly, Kinnear (2018, in press) found that 5-year-olds could explain and spontaneously read zero as a data value of interest based on the context of a storybook. In another study of high-ability year 2 students, Oslington (2018) described students not only making reasonable predictions from a complex data table, but also justifying their predictions using relevant data features such as maximum and minimum values and data range. Few studies have documented elementary students’ construction and interpretation of data tables, noticing patterns in data, making predictions and constructing graphical representations. In a recent study, Guimarães et al. (2021) analysed 325 first to fifth graders’ understanding of representations embedded in tables. Students demonstrated progression with each grade level, with table construction lagging behind their capacity to interpret the tables of others. While grade 1 students could construct tables using a single variable, tables with two variables proved to be very difficult to construct even for the oldest students. In all grades, the students had difficulties in making decisions based on the data and interpreting representations within the table. This may be due to the absence of teaching practices that focused on using and reasoning with data tables.
Predictive reasoning, representation and transnumeration
Much of the research with primary students on probability and prediction focuses on deterministic experiments using devices such as random draws of balls (e.g. Supply et al., 2020) or lollies (Reading & Shaughnessy, 2004; Watson, 2009). These tasks are helpful for investigating and promoting student reasoning because they reduce the number of sources of variation under consideration (Biehler et al., 2018). However, predictive reasoning requires accounting for variability in contexts where both random and causal forces together determine probable outcomes (Burrill & Biehler, 2011; Wild & Pfannkuch, 1999). Designing predictive tasks that include both causal and random variation may therefore have the potential to explore some of the big ideas about probability and variation, such as distribution, expectation and randomness, and inference and sampling (Callingham et al., 2019). The development of predictive reasoning can be considered an informal stage prior to more sophisticated predictive modelling in statistics. ‘Applied statistics is about making predictions, seeking explanations, finding causes, and learning in the context sphere’ (Pfannkuch & Wild, 2004, p. 18). Predictive modelling develops from learning about features of data to make predictions for likely future outcomes (Fergusson & Pfannkuch, 2022).
Data representation is essential for making sense of data as it allows students to visualise and display the structure of their data. Early data representation relies on connecting and organising objects in one-to-one correspondence and translating these to more structured representations such as tables, picture, bar and line graphs (English, 2012; Guimarães et al., 2021; Leavy, 2008; Mulligan, 2015; Oslington et al., 2020; Watson, 2018). Konold distinguishes the interpretation of ‘case-data’ tables that display a set of raw data using the column-row structure but are not structured to notice patterns or trends (Konold et al., 2017). Transnumeration, in turn, is the process of forming and refining one’s data representation to understand these data better (Wild & Pfannkuch, 1999). It is an important sense-making process for young students engaging in data prediction (Makar, 2014, 2016), data tracking (Leavy & Hourigan, 2018; Makar, 2018) and distinguishing variables (Estrella, 2018). For example, graphing, a spatial form of transnumeration, is closely aligned to students’ meaning through drawing in the early years (Cartwright et al., 2021; English, 2012; Mulligan, 2015). An understanding of graphing conventions emerges gradually throughout the primary years, with the development of structural components such as collinearity, equal spacing, data sequencing and coordination of bivariate data (Mulligan, 2015; Oslington et al., 2020). With this development also comes the organisation of other transnumerative steps that may precede graphing, including collating data frequencies, calculating means or constructing data tables (Chick, 2003).
In light of these studies, it would be expected that students become increasingly able to compare and classify data, identify patterns and engage in data transnumeration (Jeannotte & Kieran, 2017). Pattern-seeking might include noticing the frequency of repeated values or clumped distributions (Frischemeier & Snell, 2021) and the spatial arrangement (collinearity) of a table. Structural features might include noticing the range of data, clustering and aggregation of values, ideas of centre and coordination of data within the grid structure of the table. Through pedagogical approaches to support data exploration, Lehrer et al. (2007) highlight the ‘challenges of imposing structure on data, choosing displays to highlight aspects of structure, and making judgements about phenomena in light of variability and uncertainty’ (p. 196).
The structure of observed learning outcomes
Studies describing students’ acquisition of statistical concepts have developed hierarchical scaffolds that describe levels or progressions of structural development (Jones et al., 2004; Leavy, 2008; Oslington et al., 2020; Watson et al., 1995). These models can be traced to the Structure of Observed Learning Outcomes (SOLO) model (Biggs & Collis, 1982; Callingham & Watson, 2017). The SOLO model centres on two interrelated aspects of structure: five modes of increasing abstractness (sensorimotor, ikonic [IK], concrete-symbolic [CS], formal-1 and formal-2) and five increasing levels of structural development in each mode (pre-structural [P], unistructural [U], multi-structural [M], relational [R] and extended abstract [EA]). The transition from IK to CS mode is a complex and critical process in the early development of mathematical representation, abstraction and generalisation. From birth, sensorimotor development is essentially tacit knowledge; IK is more intuitive and uses imagistic thinking, a necessary progression to CS mode where language and symbols are developed. Inadequate development through IK and CS modes may cause inconsistencies in conceptual development and impede more formal abstract thinking.
SOLO analysis has been applied to studies of students’ structural development of statistical concepts and meta-representational competence. Watson and colleagues have applied the SOLO model to studies about chance (e.g. Watson & Kelly, 2005; Watson & Moritz, 1999), sampling (Watson & Moritz, 2001), surveys (Watson et al., 2003) and distributions (Watson, 2009). More recently, the SOLO framework has been extended to year 3 students’ understanding of data (Watson & Fitzallen, 2021), introducing statistical variation in STEM contexts (Watson et al., 2020) and to year 6 students’ understanding of variation (Watson et al., 2022). Further studies have adapted the SOLO framework to analyse 10- and 11-year-old students’ understanding of sampling and probability (Groth et al., 2021).
The interrelationships between various structural elements have been analysed to gain a more coherent picture of the complexities of mathematical concept development. Early studies of the application of SOLO to young students’ concepts of multiplication and division (Mulligan & Watson, 1998) and early fraction learning (Watson et al., 1993) focused on students’ awareness of structural characteristics and representations such as composite units and partitioning. In further studies, the SOLO model was adapted to interpret young students’ responses to a range of mathematical concepts through interview-based tasks (Mulligan & Mitchelmore, 2009; Mulligan et al., 2020a). Students’ concept development was inextricably linked with their modes of representation and emerging mathematical structures. In this relationship, the joint development of meta-representational and conceptual competence occurs (diSessa, 2004). While SOLO levels could be applied or adapted to describe students’ increasing abstraction of mathematical concepts and representations (modes), a more fine-grained analysis of students’ representations needed to be integrated with, and more explicitly articulated, in terms of SOLO structural levels. In further studies adapting SOLO structures and modes, an Awareness of Mathematical Pattern and Structure (AMPS) model was formulated, consisting of one progression of five integrated structural levels applied to a range of mathematical concepts and representations: pre-structural, emergent, partial, structural and advanced structural (Mulligan & Mitchelmore, 2009). One of the initial objectives was to develop an analytical and pedagogical tool that could be applied to the interpretation of students’ structural development in a similar way to levels of counting, base ten or multiplicative knowledge.
AMPS
The conceptual basis of the AMPS model was informed by SOLO and evaluated in a series of studies where young students spontaneously searched for mathematical patterns and noticed structural features (Mulligan & Mitchelmore, 2009; Mulligan et al., 2020a). Through identifying similarities and differences between mathematical quantities, objects or relationships, students demonstrated an understanding of emerging generality. These students could think relationally and noticed common structural and spatial features. Given these findings, a theoretical perspective focused on pattern and structure was adopted. It can be traced to the work of Mason and colleagues where ‘seeking pattern and structure directs attention to the general properties within the data set, which can be expressed through relationships between the elements or subsets of the data set’ (Mason et al., 2009, p. 1). Thus, as an approach promoting generality even in its emerging forms, AMPS describes two interdependent components: one cognitive—a knowledge of structure, and one meta-cognitive—a tendency to seek and analyse patterns (Mulligan & Mitchelmore, 2009). The initial studies centred on reliably measuring and describing the relationship between pattern and structure and mathematical development. Students who engaged in pattern-seeking behaviours such as seeking similarities and differences were found to understand the mathematical concepts inherent within these patterns, while those who did not notice patterns focused on idiosyncratic or non-mathematical features. The authors proposed that AMPS is a salient underlying process common to concept development. The early acquisition of AMPS may then reveal young students’ emerging mathematical abstraction and generalisation.
The AMPS framework has been applied to a range of mathematical concepts across the primary years and including pre-schoolers (Papic et al., 2011), Kindergarten (Mulligan et al., 2020a), year 1 (Mulligan, 2015) and year 3 and 4 students (Mulligan et al., 2020b ). An AMPS’ pedagogical program evaluated with students in Kindergarten revealed students’ emerging abilities to abstract and generalise mathematical concepts (Mulligan et al., 2020a). When applied to a study of year 1 students’ data modelling, their AMPS levels were aligned with their interpretation, representation and explanation of data and connections with other mathematical ideas (Mulligan, 2015). In the present longitudinal study, the AMPS model was applied as an analytical tool to describe year 3 students’ predictions, representations and explanations of a table of real data (Oslington et al., 2020) and modified for the year 4 study (see “Data analysis” following).
Methodology
Research design
The present study comprises phase 2 of a 3-year longitudinal design study (Bakker, 2018; Cobb et al., 2003), investigating predictive reasoning in students from year 3 through to year 5. In this report, we analyse shifts in year 3 students’ responses to the same tasks in year 4. The investigation was replicated at the end of year 4 and year 5, but these analyses are beyond the scope of this paper. In phase 1 of the longitudinal study reported in this paper, 46 year 3 students made predictions from a table of temperature data and represented and explained their reasoning (Oslington et al., 2020). We found 54% of students noticed patterns and used this reasoning to make predictions broadly within the data range. However, when asked to explain their reasoning, only 20% of students noticed aggregate properties of the data and few demonstrated understanding of variability. Moreover, only 5% represented these data using a conventional graphical representation. While students with ‘aggregate views’ (Konold et al., 2015) could use the data table for making predictions and integrated these data with personal knowledge, others used the table in an inconsistent and distracting way.
Using an interpretative approach, we compare AMPS levels across the same cohort and examine more closely the influence of response type at each data-collection point. Our interpretation of data focuses on evidence that students can make accurate predictions before they develop predictive reasoning, and that their reasoning and representational capabilities may co-evolve.
Participants
Phase 2 of the study retained a cohort of 44 year 4 students: 20 female and 24 male (aged from 8 years 8 months to 9 years 10 months). The first author engaged students in the same predictive reasoning tasks, conducted interviews and recorded data, consistent with the procedures utilised for the students in year 3. Ethical consent was obtained from teachers, students and caregivers for collection of student work samples and digital recordings of interviews. Students’ backgrounds indicated a high index of community socio-economic advantage (ICSEA), with 75% of families above the Australian average. The students were also mathematically competent. For example, in a standardised mathematics test (Stephanou & Lindsey, 2013) taken by the cohort in year 4, 93% of students’ scores were over the 50th percentile relative to other Australian year 4 students.
Prior learning experiences
Some learning experiences during year 3 may have contributed to students’ progress in statistical reasoning by the beginning of year 4, but instruction on statistical concepts was limited. Year 3 lessons followed the state mathematics syllabus (NSW Education Standards Authority [NESA], 2019) for Statistics and Probability. A content analysis of year 3 teaching programs (by the first author) revealed that of the 190 mathematics lessons implemented over the entire school year, only 14 were allocated to this strand, and these were limited to chance and data. Typically, these lessons were dominated by textbook-based examples such as recognising categories of data and counting simple frequencies in a pictogram, filling in a single-entry table with tally marks, colouring a simple bar graph to represent frequencies and responding to simple interpretative questions such as ‘what is the most popular type of sport?’ More relevant learning experiences included lessons on the seasons, and those using technology such as creating a pie chart using Excel™. Year 3 students also benefitted from expert guidance with problem-based learning and interpreting graphs in science. However, the year 3 and 4 teachers did not provide any instruction in predictive reasoning or interpretation of data tables, or expose the students to the predictive tasks presented in this study. Moreover, we considered that either natural progression and/or students’ experiences with mathematics and science investigations would have enhanced year 4 students’ data interpretation and meta-representational competence.
Data collection process
Students were withdrawn from class in small convenience groups of 9 to 12, with each student participating in a single 60-min period. The data-collection period was conducted over five consecutive days. Students were seated individually and completed the tasks independently. The sequence replicated the data-collection process and procedures from year 3 (Oslington et al., 2020), orienting students to the task, predicting values from the data table, responding to a written prompt, creating a representation and participating in an individual interview.
Predictive tasks
While the predictive tasks used in year 3 were replicated, the data table was updated for 2018 temperature values (Fig. 1).
-
1.
Use the data table to complete the missing temperatures (for 2018).
-
2.
Respond to a written prompt “Write down anything you notice about the numbers” (any numbers in the table).
-
3.
Construct a representation following a written prompt ‘Show how the numbers might look on a graph’.Footnote 1

Highest monthly temperature table for Sydney 2010–2017 used by year 4 students to predict maximum monthly temperatures for 2018 (Australian Government, 2019)
The teacher (first author) discussed the meaning of the terms ‘maximum’ and ‘monthly’ temperatures in the context of the table and ensured students could read these data in rows and columns. Year 4 students did not have their original year 3 responses visible, and their previous attempts were not discussed.
Student’s explanations of their predictive strategies and representations were captured at interview. Interview duration increased from 0:44–3:39 min (Year 3) to 2:15–7:54 min (year 4). The questions posed during the year 3 interview were replicated:
-
1.
“What is your graph showing?”
-
2.
“What did you notice about the data table?”
-
3.
“How did you choose your numbers?”
Students were encouraged to expand and elaborate on their initial responses. Interviews were digitally recorded using a hand-held iPad and conducted by the first author in an adjacent observation room isolated from other students.
Data analysis
The AMPS approach was modified and extended to accommodate students’ more sophisticated thinking in year 4 than shown in year 3. A tentative coding scheme was formulated (Tables 1 and 2) at five levels as follows:
-
1.
Pre-structural: Students focus upon idiosyncratic features largely irrelevant to the data table.
-
2.
Emergent: Students recognise some relevant features of the data table; however, each data value is interpreted independently from its context. Students’ representations lack structure and graphical sophistication.
-
3.
Partial structural: Students recognise some key structural features of the data, although representations and explanations are partially formed.
-
4.
Structural: Students use aggregation, describe patterns and represent data graphically; ideas of variation are linked to seasonal change.
-
5.
Advanced structural: Students view the data holistically, describe patterns and relationships between values, represent data graphically and show understanding of emergent generalisation and variability.
Students’ predictions recorded in the table and their hand-drawn representations were coded separately by the first author using revised coding descriptors for the three response types (see Tables 1 and 2). Following this process, all 44 digital recordings of interviews (explanations) were manually transcribed and analysed by the first author for evidence of students’ pattern-seeking strategies and causal reasoning. Each student’s explanations were coded from the interview transcripts supported by digital video data of the interview. The coding process was moderated by the other authors before being re-coded independently by a trained research assistant. The coders reached 98%, 95% and 91% level of agreement for each of the three response types: predictions, explanations and representations, respectively.
Table 1 provides coding descriptors for predictive reasoning strategies aligned with five increasing levels of abstraction and generalisation (AMPS). Temperature predictions were coded for each student as ‘reasonable’ if they fell between the 5th and 95th percentiles of the historically recorded temperatures for the month. Employing historical data temperatures rather than relying solely on the data table as a reference avoided arbitrarily dismissing a prediction if it fell slightly out of range yet was still feasibly within a reasonable range for the month. While predictions alone were important, the strategies and reasoning that underpinned these predictions remained implicit. Students’ explanations provided evidence of their pattern-seeking strategies and an emerging understanding of causal variation.
Table 2 illustrates students’ representations coded for AMPS structural levels: pre-structural focused on irrelevant aspects; emergent was reproductions of part of the data table; partial showed some transnumeration without relevant data extraction and structural showed relevant transnumeration by construction of a new table or graph. Advanced structural representations reflected accurate coordination of bivariate data by demonstrating a relationship between the variables of time and temperature. These representations reflected students’ emerging understanding of generalisation beyond a single to a representative data set and their interpretation of the aggregate and variable properties of these data.
Results
Descriptive data analysis of the shifts in students’ AMPS levels for predictions, explanations and representations are presented in Fig. 2. Excerpts of interview transcripts supported our interpretation of students’ responses. Figures 3 and 4 illustrate students’ representations at different structural levels. An analysis of individuals who are typical of students with similar levels of response including ‘high-gain’ and ‘low-gain’ students is then described (Figs. 5, 6, 7, 8, 9 and 10).

Percentage of student predictions, explanations and representations at years 3 and 4 by level (n = 44)
Predictions
Figure 2 indicates a marked shift in the reasonableness of predictions from year 3 to year 4. Eighty-seven per cent of student predictions (n = 38) contained at least 10 values within the historical temperature range. In contrast, just 54% (n = 24) showed this level of accuracy in year 3. For almost half the year 4 cohort (48%), advanced structural thinking was demonstrated when all 12 monthly values were within the historical range. Limited interpretation of the data (i.e. at pre-structural, emergent or partial levels) was uncommon in year 4 representing only 14% (n = 6) of the cohort relative to 45% (n = 20) in year 3.
Explanations
Gains in students’ inferential reading of the data were demonstrated in their explanations. By year 4, 79% (n = 35) of the cohort described some relevant aspects of the data table when explaining their predictive strategies, relative to 50% (n = 22) in year 3. However, some pre-structural explanations were present in both years. Pre-structural or emergent strategies were reported by 48% (n = 21) of students in year 3 but just 20% (n = 9) in year 4. Pre-structural strategies included ‘guessing’, selecting ‘favourite numbers’ or another form of idiosyncratic number selection. Emergent strategies included a reference to at least part of the historical data set; however, students’ justifications revealed some misconceptions. While engaging in pattern-seeking, these students’ beliefs about these data conflicted with the values in the table. Examples included believing that the start of the year was ‘hot’ and the end ‘cold’, or that global warming was causing temperatures above 60 °C. At higher levels of response, students not only identified patterns—and so were able to predict with accuracy—but also recognised causal variation implicit in these data. Lower level responses, which at times included relatively accurate predictions, were not accompanied by explanations of why temperatures changed across the year.
Approximately one-third of the year 3 and year 4 cohorts (34% and 36% respectively) elicited explanations at the partial level. These responses often reflected awareness of the similarities in values or other patterns in the column structure of the table alone but were not coordinated with seasonality implicit in the row structure. Other strategies included matching the tens’ digits by describing the numbers in the column as ‘in the 30 s or 20 s’ by looking at the highest or lowest value in each column.
Structural responses successfully integrated seasonal knowledge and changes in temperature with yearly trends by coordination of vertical and horizontal data values. Such responses were more common in year 4 (36%) than in year 3 (15%). LucaFootnote 2 for example first described observing the range of values in columns and noticed that some values were more frequent than others, implying an expectation of a clumped distribution (structural reasoning strategy). He then explained that the previous two July temperatures were the hottest of the July values and predicted a similarly hot value for July 2018. In the excerpt below, Luca specifically links causal variation to temperature change by explaining cold temperatures are usually associated with winter (see Table 1, AMPS structural level).
Luca: I noticed that January, the numbers are quite high, because it is more around the start of the year, then when you come up to about May, the numbers get colder, but you come up to July that is part of the coldest because it is during the middle of the year, and it is also winter.
R: It sure is, isn’t it?
Luca: And then it gets hotter from August.
Sophisticated reasoning at the advanced structural level was uncommon, observed for only three year 4 students. These explanations indicated students’ emerging ideas of generalisation and variability—for example, warmer months having wider temperature ranges than cooler months—as well as the cyclic and predictable influence of seasonal change. Explanations focused on the whole data table, with student observations of multiple interrelated features. Advanced structural explanations included an understanding of central tendency. Stuart (advanced structural reasoning) highlighted the data range for each column, noting it varied between 16 °C for January and 3 °C for June. He then linked this observation to climate change:
Stuart: In the winter, say June, there was a more stable range, like from 20 to 23, but in the summer months there was 30 to 46 which was 16 apart.
R: So, there is more variability in the summer?
Stuart: Yeah. I thought it was because in the summer, global warming affects it a bit more.
Stuart’s prediction strategies included starting with the winter months indicating less variability, followed by predicting adjacent months.
Stuart: Like I said before, the average was easy to guess in the winter, so I started in the winter.
R: You started in the middle, did you? Which one did you start with?
Stuart: In June. I then went to July and August, the winter months. Well June is colder than July because June’s in the middle of the year. So, it would be about 5 [degrees] up.
Representations
Eighty-one per cent of year 3 students produced representations at either pre-structural or emergent levels compared with only 29% in year 4 (Fig. 2). Invented number tables were drawn by 11 year 3 students (25%) but just four year 4 students (9%). Fewer year 4 students (20%) copied the data table (emergent) than year 3 students (36%). In year 4 (14%), a relatively small number of students constructed representations at the partial structural level by rearranging the table without extracting values or graphing.
Figure 3a-d illustrate four varying AMPS levels of students’ representations. The transnumeration apparent in Fig. 3b was constructed as a time sequence on the x-axis prior to stacking the monthly temperature values on the y-axis. In the excerpt below, Ewan described the process. He attempted a bar graph but then resorted to including all temperature values as he was unable to extract a sub-section of the data.
R: Why did you decide to swap them [the axes] over?
Ewan: Because at first, I forgot to add the… I was going to do a bar graph and write at, like the little lines for the numbers. But I can’t because I have to add the months in, so I decided to change, and to do that.

Four individual student representations by structural levels: a pre-structural: seasonal pictures — Violet, year 3; b partial: copy of the original data table with axes inverted — Ewan, year 3; c structural: column graph of highest temperature for each month — Hannah, year 4; d advanced structural: line graph of 3 years of temperatures — Claire, year 4
By year 4, more than half of the students created representations that were categorised at the structural (45%) or advanced structural levels (12%) (Fig. 2). These students were able to organise their data in a new way, distinct from the original data table either by sorting (e.g., listing years as hottest to coldest), aggregating the original data to make inferences (e.g., determining hottest temperature for each month), or by focusing on central tendency such as the median value. While some students produced abridged tables or lists, 39% of year 4 students were able to coordinate two sets of variables and create bar graphs (23%), line graphs and scatterplots (16%). Only 7% of students in year 3 were able to do the same. Figure 3c and d highlight structural elements such as approximate equal spacing for intervals, limiting the scale on the y-axis of the temperature values, correct sequencing of months, and coordination of bivariate data.
Graphing required students to select and then represent sections of the data table, rather than focusing on all data values equally. Student choices included their own predictions, the highest value in each month or year or another sequence of interest such as the previous year, or their birth year. Students focusing upon the row structure of the table frequently selected the hottest values in each year. However, a focus on the column structure of the table which included monthly maximum values highlighted the seasonality implicit in the data set (Fig. 4).

Two structural examples by year 4 students Lacey (left) and Ida (right). Lacey’s example contains the hottest values in each year, while Ida’s contains the hottest values in each month
Meta-representational competence increased markedly between year 3 and year 4 where collinearity was a feature of all but the most iconic of representations. Even those with pre-structural and idiosyncratic predictions in year 3 often reproduced some form of a grid structure in year 4, indicating an awareness of the table’s gridlines prior to engaging with data values. Year 3 students’ replications of the data table often focused on individual table cells, in contrast to the construction of grid lines.
With few exceptions, students made some progress in one or more of the three response types. Even when a student did not increase by an entire AMPS level, there was typically a shift within the level. For example, the two partial representations drawn by Lewis attempted to reorder the temperature table from hottest to coldest (Fig. 5). In the second attempt, Lewis constructed the table using ruled lines, highlighted differences between years (describing the year 2012 as ‘very cool’) and simplified the task, enabling task completion. However, Lewis neither extracted nor graphed any sequence of temperatures. For other students, predictions remained at the pre-structural level with values substantially outside the monthly range of the data table for both years, but their year 4 attempts included fewer extreme values, indicating more reasonable temperatures.

Year 3 and year 4 representations from Lewis. Both representations are partial, although his year 4 representation contains more structure than the earlier example
Inconsistencies between students’ levels of structure
Individual profiles were compiled for every student across the three response types at year 3 and year 4. An initial analysis attempted to find common patterns of response for individuals using the AMPS coding scheme. However, there were almost as many different individual patterns of response across the cohort as there were students. Thus, a descriptive analysis of AMPS structural levels for individuals was conducted. Given that most students elicited structured accurate predictions at the year 4 data-collection point, their predictions in year 3 were used as a reference point for comparing shifts in their thinking (see Fig. 2). Two groups of students were compared: 20 students whose first set of predictions were pre-structural, emergent or partial, and the remaining 24 students whose predictions were structural or advanced. By examining how the less-advanced group of 20 students progressed, two clusters were identified when reassessed in year 4, as ‘low-gain’ and ‘high-gain’.
Students with predictions at pre-structural, emergent or partial level in year 3 (n = 20)
-
1.
‘Low-gain’ students (n = 5) progressed to the next AMPS level or remained at the same level for two or more of the types of response. While students in this group showed modest improvements, their data predictions (the easiest of the tasks) remained at best partial (and usually below)in their year 4 responses. In the example in Fig. 6, Kane’s predictions and explanations improved from pre-structural to emergent, while his representations remained at pre-structural level.
Fig. 6 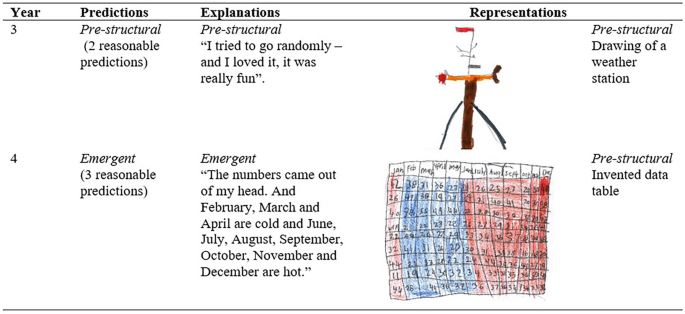
Predictions, explanations and representations from Kane, a ‘low-gain’ student

-
2.
‘High-gain’ students (n = 15) shifted from pre-structural, emergent or partial AMPS levels of response to structural or advanced structural for any of the three types of response (n = 15). These students showed transnumeration, viewed the data holistically and used statistical reasoning. However, not all high-gain students responded consistently. Five students made significant improvement in predictions, but with explanations and representations remaining at partial level or below. A further five students produced structural representations while their explanations remained at partial or below. For the remaining five students, predictions, explanations and representations were consistently structural. Hattie, for example, predicted and represented at emergent level in year 3 and progressed to structural level in both response types by year 4 (Fig. 7).
Fig. 7 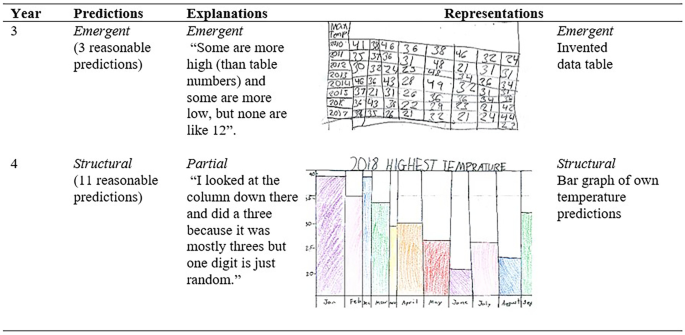
Predictions, explanations and representations in from Hattie, a ‘high-gain’ student

Students with predictions at structural or advanced structural levels in year 3 (n = 24)
Twenty-four students (just over half) predicted at a structural or advanced structural level in year 3, but their explanations and representations were inconsistent. In year 4, all but three reached at least structural level for their explanations (n = 7), their representations (n = 3) or for both (n = 6). The remaining five students were already responding at structural level, and some advanced to explanations focused on variability.
The 24 more advanced students fell into five clusters described below. (Representative examples of clusters 2, 3 and 5 are presented in Figs. 8, 9 and 10 respectively).
-
1.
‘Low-gain’ students (n = 3). Representations remained partial or below, and explanations were unstable and below structural level. For these students, in both year 3 and 4, reasoning alternated between structural and emergent, for example, describing authentic seasonal relationships as well as invented patterns.
-
2.
Growth in explanations (n = 7). Representations remained partial or below. However, the explanations progressed to structural, as for Andrea (Fig. 8). Year 4 explanations shifted from partial to structural, while representations remained emergent.
Fig. 8 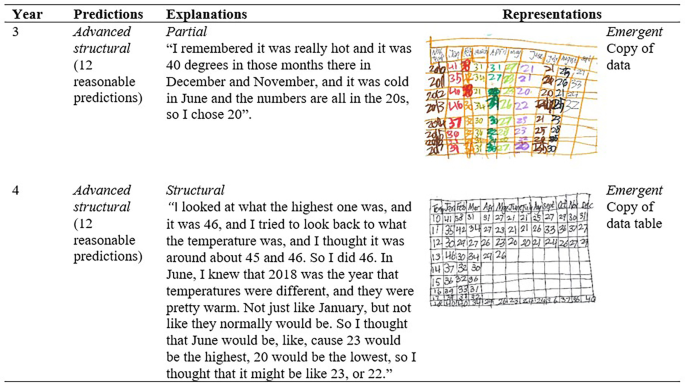
Predictions, explanations and representations from Andrea

-
3.
Growth in representations (n = 3). Representations shifted to structural, while explanations remained emergent (n = 3). For Lanni, for example, her year 4 representations shifted from emergent to structural, while her explanations remained emergent (Fig. 9).
-
4.
Growth in both explanations and representations (n = 6). Representations shifted to structural, similar to the example in Fig. 9, as did explanations similar to the example in Fig. 8.
Fig. 9 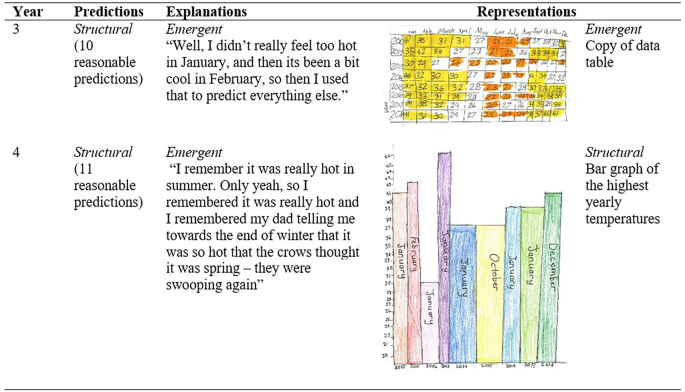
Predictions, explanations and representations from Lanni
-
5.
Growth in students already at structural level (n = 5). Students with structural (or advanced structural) predictions, explanations and representations in year 3 demonstrated further progress by year 4. In Fig. 10, Rhys represented his own predictions in year 3, but by year 4 observed the whole data table and extracted the highest monthly values. Similarly, in year 3, he made accurate predictions by drawing on seasonal knowledge, and then in year 4 extended his explanations to include an early understanding of mean.
Fig. 10 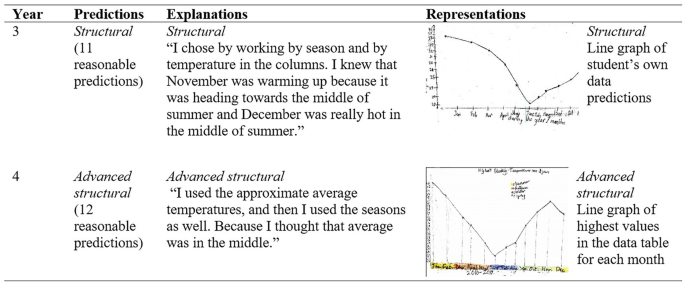
Predictions, explanations and representations from Rhys, a high-performing student


Discussion
The study extends current research in early mathematics education by developing an integrated descriptive framework for analysing developmental aspects of predictive reasoning in primary students. The first research question considered how students’ interpretation of structural features of data supported their predictive reasoning. AMPS was fundamental to students’ interpretation and representation of the data set, enabling an appreciation of how the variables of time and temperature could be related and organised. Students coordinated bivariate data and represented these data using collinearity, a key feature of the AMPS framework. For example, students were frequently able to identify the base-ten structure of values in columns, notice the repeated data values and identify variations and similarities in data range. Advanced students recognised patterns and structural features of data as they developed deeper statistical thinking. Students who demonstrated structural or advanced structural AMPS features viewed the data as aggregate, understood the idea of central tendency and could generalise about simple relationships within these data. In all cases, the increase in accuracy of data prediction preceded or co-emerged with increased sophistication in students’ representations and/or explanations. However, predictions alone cannot be taken as confirmation of statistical reasoning. It may be that students were able to accurately predict or improve in their predictions based on patterns in the temperature table, but could not explain why. This raises the question of whether our data analysis could examine more holistically the dynamic interplay between predictions, explanations and representations on a case-by-case basis.
While students looked for patterns in the data, not all pattern-seeking behaviour was effective. Ineffective strategies included the assumption that temperatures always went from ‘cold to hot’ or that the goal was to ‘find missing numbers’. Students’ tendency to seek missing (or unused) numbers in distributions has been previously reported (Watson & Moritz, 2001) and may be linked to a perception of ‘fairness’ whereby variation is controlled by even allocation across groups (Reading & Shaughnessy, 2004). When describing the predictions of year 2 students, for example, Ben-Zvi and Sharett-Amir (2005) noted that students appeared to conceive the data as a flat distribution with all values equally likely.
The second research question investigated shifts in students’ predictions, representations and explanations from year 3 to year 4. We suggest that a tentative progression of statistical thinking can be described based on our evidence. Students showed a shift from thinking focused upon the general idea of weather to noticing the structure and features of the table including grid lines. This was followed by undifferentiated attention to some or all of these data without any systematic interpretation. The spatial structure of the grid required the students to conceptualise the table structure as containing column and row composites. Following this, students appeared to pay attention to the column structure of the table, often followed by the row structure with attempts to coordinate (collinearity), and then identified similarities and clusters in these data. This occurred prior to viewing the table as one whole data set with aggregate and variable properties. However, we found large individual differences in students’ predictions, explanations and representations of data within each year level. In earlier research, English (2013) questioned whether constructing representations prior to a student developing conceptual understanding supports or hinders understanding, or if the concept and representation develop in tandem. Watson and Moritz (2001) found that student explanations lagged behind representations (pictograms) although the representational activity used in that study was more scaffolded than in the present case. In the present study, making reasonable predictions was clearly easier for the students than either explaining their predictions or representing these data. Many students responded at different structural levels simultaneously. Perhaps not surprisingly therefore, lags in explanatory and representational skills appeared to narrow between year 3 and year 4.
By year 4, many students’ explanations of their predictions reflected an understanding of variability (Shaughnessy, 2007). Students noticed variability in data values including extremes and outliers, as range (annual or monthly), associated variability with seasonality and as a distribution through recognising the modal value. Our findings, however, need to be considered as tentative as we do not claim or speculate that our data provide conclusive evidence that young students can grapple with all forms of variability. To demonstrate a sound understanding of variability, students must be able to describe and represent relationships between different variables within a data set (Biehler et al., 2018).
Our findings complemented studies with primary students on variation in causal distributions (e.g., Ben-Zvi & Sharett-Amir, 2005) and reasoning about representations (English, 2012; Watson & Moritz, 2001). The real data set selected for this study reflected underlying causal variation due to seasonal change, which was inferred from students’ responses at the structural and advanced structural levels. In each case, students were able to explain causal variation in patterns of data and use it to make their own predictions and representations. The variables of time and temperature could also be interpreted and organised in several ways each giving a different grasp of the distribution (Gattuso & Ottaviani, 2011). If a student selected the temperature as the dependent variable, the independent variable could be either month or year (Fig. 4). Selection of month as the independent variable emphasised the relationship between months and temperatures, provided they were organised in calendar order (e.g., the bar graph in Fig. 7 is inconsistent here). This made it easier for students to read beyond the data (Makar & Rubin, 2018) and generalise about all other years. For some students, drawing their own graphs to illustrate their (structural) predictions clarified this relationship in a way that simply viewing the temperature table could not. This became apparent at interview when students were asked to justify and explain their responses. Students who selected the year as the independent variable demonstrated coordination of bivariate data, but their resulting graph lacked the relational component apparent when months were selected. This was because, at least on the timescale used, these data showed no clear trend across years and temperatures. Using the year as the independent variable provided less opportunity for inference, as interpretation was limited to noticing, for example, the hottest or coldest year from the limited range.
Implications and limitations
The study was limited to a single task on predictive reasoning with one cohort from a relatively high socio-economic background, albeit advantageous to report longitudinal progress. Such findings do not permit immediate generalisation to other populations and contexts. Thus, it is important that future research be extended to examine predictive reasoning across the early childhood and primary school years in a range of contexts and in more diverse populations.
Our findings have implications for the design and inclusion of statistical learning experiences in early primary. Even year 3 students demonstrated a capacity to predict and to make relevant observations, prior to formal statistical instruction, suggesting a readiness to approach more difficult statistical tasks, understand measures of central tendency and explore variability. Another implication of this study is that learning to represent with meaningful data can be applied to other contexts such as science and geography, as can the process of interpreting and generalising from data tables used in many domains.
Further research could include a range of statistical tasks and pedagogical strategies that can be replicated and refined in classroom settings, and that employ more inclusive approaches. The advantage of longitudinal studies which observe learning over time and cross-sectional studies permitting comparison of developmental levels can advance this emerging field in new ways. The practical implementation of the AMPS framework or an alternative focusing on structural levels to articulate fine-grained steps in students’ statistical reasoning is perhaps the next step in the application of this research. This would necessitate more frequent data-collection points and a broader range of tasks in authentic contexts. Such observations would assist the observation of developmental changes in students’ statistical reasoning more explicitly. Further research adapting AMPS to assess statistical reasoning in the early childhood and primary years—such as is available in middle grades (Callingham & Watson, 2017)—is essential for tracking developmental progression.
Concluding remarks
Engagement in predictive reasoning and advanced representational challenges is not traditionally expected of primary students. However, our students made predictions and representations based on real data, made inferences about those predictions and developed notions of variability. Clearly, there was progression in students’ structural development and representation of statistical concepts from year 3 to year 4, but with wide variation in individual patterns of responses. Explanations often lagged behind students’ predictions, i.e., students could not always reason about their predictions. This exploratory study prompts the need to make explicit the complex development of statistical concepts including aggregation, pattern-seeking, transnumeration, and variability. Such research may provoke further reform in mathematics curriculum and promote pedagogy beyond ‘chance’ activities and procedural approaches when working with data. Taken together, the findings of this study highlight the feasibility of challenging young students to engage with real data as well as self-constructed data sets, prior to formal instruction in statistical concepts. The study contributes to a growing body of research in mathematics and statistics education fuelled by the need to engage young students in data-driven learning and statistical literacy. Evidence of this research direction is exemplified in volumes such as Suh et al. (2021) and the forthcoming special issues of the Statistics Education Research Journal (SERJ) and the Mathematics Education Research Journal (MERJ).
Notes
Depending on the type of representation, ‘drawing’ or ‘table’ were sometimes substituted for “graph”.
Pseudonyms for all students.
References
Aridor, K., & Ben-Zvi, D. (2017). The co-emergence of aggregate and modelling reasoning. Statistics Education Research Journal, 16(2), 38–63. https://doi.org/10.52041/serj.v16i2.184
Australian Curriculum and Assessment Reporting Authority [ACARA]. (2022). Statistics and probability foundation to year 10. https://www.australiancurriculum.edu.au/f-10-curriculum/mathematics/
Australian Government. (2019). Bureau of Meteorology. Retrieved January 20, 2019, from Climate Data Online monthly mean maximum temperatures Sydney (Observatory Hill): http://www.bom.gov.au
Bakker, A. (2018). Design research in education a practical guide for early career researchers. Routledge. https://doi.org/10.4324/9780203701010
Ben-Zvi, D., & Aridor-Berger, K. (2016). Children's wonder how to wander between data and context. In D. Ben-Zvi, & K. Makar (Eds.), The teaching and learning of statistics: International perspectives (pp. 25–36). Springer. https://doi.org/10.1007/s11858-012-0420-3
Ben-Zvi, D., Makar, K., Garfield, J. (Eds.). (2018). International handbook of research in statistics education. Springer. https://doi.org/10.1007/978-3-319-66195-7
Ben-Zvi, D., & Sharett-Amir, Y. (2005). How do primary school students begin to reason about distributions? Proceedings of the Fourth International Research Forum for Statistical Reasoning, Thinking and Literacy (SRTL–4) University of Auckland (New Zealand). Brisbane: University of Queensland. https://www.academia.edu/976792/
Biehler, R., Frischemeier, D., Reading, C., & Shaughnessy, J. M. (2018). Reasoning about data. In D. Ben-Zvi, K. Makar, & J. Garfield, (Eds.), International handbook of research in statistics education (pp. 139–192). Springer. https://doi.org/10.1007/978-3-319-66195-7_5
Biggs, J. B., & Collis, K. F. (1982). Evaluating the quality of learning: The SOLO taxonomy. Academic Press.
Burrill, G., & Biehler, R. (2011). Fundamental statistical ideas in the school curriculum and in training teachers. In C. Batanero, G. Burrill, & C. Reading (Eds.), Teaching statistics in school mathematics – challenges for teaching and teacher education (pp. 57–69). Springer. https://doi.org/10.1007/978-94-007-1131-0_10
Callingham, R., & Watson, J. (2017). The development of statistical literacy at school. Statistics Education Research Journal, 16(1), 181–201. https://doi.org/10.52041/serj.v16i1.223
Callingham, R., Watson, J., & Oates, G. (2019). Statistics and probability: from research to the classroom. In D. Siemon, T. Barkatsas, & R. Seah (Eds.), Researching and using progressions (trajectories) in mathematics education (pp. 181–204). Brill Sense. https://doi.org/10.1163/9789004396449_009
Cartwright, K., Bobis, J., & Way, J. (2021). Investigating students' drawings as a representational mode of mathematical fluency. In Y. H. Leong, B. Kaur, B. H. Choy, J. B. Yeo, & S. L. Chin (Eds.), Excellence in mathematics education: Foundations and pathways. Proceedings of the 43rd annual conference of the Mathematics Education Research Group of Australasia (pp. 114–117). MERGA.
Chick, H. (2003). Tools for transnumeration: early stages in the art of data representation. In L. Bragg, C. Campbell, G. Herbert, & J. Mousley (Eds.), Mathematics education research: Innovation, networking, opportunity. Proceedings of the 26th Annual Conference of the Mathematics Education Research Group of Australasia (pp. 167–174). MERGA.
Chick, H., Watson, J., & Fitzallen, N. (2018). “Plot 1 is all spread out and Plot 2 is all squished together”: exemplifying statistical variation with young students. In J. Hunter, P. Perger, & L. Darragh, (Eds.), Making waves, opening spaces. Proceedings of the 41st Annual Conference of the Mathematics Education Research Group of Australasia (pp. 218–225). MERGA.
Cobb, P., Confrey, J., diSessa, A., Lehrer, R., & Schauble, L. (2003). Design experiments in educational research. Educational Researcher, 32(1), 9–13. http://www.jstor.org/stable/3699928
diSessa, A. (2004). Metarepresentation: Native competence and targets for instruction. Cognition and Instruction, 22(3), 293–331. https://doi.org/10.1207/s1532690xci2203_2
English, L. (2012). Data modelling with first-grade students. Educational Studies in Mathematics, 81(1), 15–30. https://doi.org/10.1007/s10649-011-9377-3
English, L. (2013). Reconceptualizing statistical learning in the early years. In L. English, & J. Mulligan (Eds.), Reconceptualizing early mathematics learning (pp. 67–82). Springer. https://doi.org/10.1007/2F978-94-007-6440-8_5
Estrella, S. (2018). Data representations in early statistics: data sense, meta-representational competence and transnumeration. In A. Leavy, M. Meletiou-Mavrotheris, & E. Paparistodemou (Eds.), Statistics in early childhood and primary education (pp. 239–256). Springer. https://doi.org/10.1007/978-981-13-1044-7_14
Fergusson, A., & Pfannkuch, M. (2022). Introducing high school statistics teachers to predictive modelling and APIs using code-driven tools. Statistics Education Research Journal, 21(2), 1–25. https://doi.org/10.52041/serj.v21i2.49
Frischemeier, D., & Schnell, S. (2021). Statistical investigations in primary school – the role of contextual expectation for data analysis. Mathematics Education Research Journal. https://doi.org/10.1007/s13394-021-00396-5
Gattuso, L., & Ottaviani, M. G. (2011). Complementing mathematical thinking and statistical thinking in school mathematics. In C. Batanero, G. Burrill, & C. Reading (Eds.), Teaching statistics in school mathematics–challenges for teaching and teacher education A joint ICMI/IASE Study (pp. 212–132). Springer. https://doi.org/10.1007/978-94-007-1131-0_15
Groth, R. E., Austin, J. W., Naumann, M., & Rickards, M. (2021). Toward a theoretical structure to characterize early probabilistic thinking. Mathematics Education Research Journal, 33(2), 241–261. https://doi.org/10.1007/s13394-019-00287-w
Guimarães, G., Evangelista, B., & Oliveira, I. (2021). What students in the first grades of elementary school know about tables. Statistics Education Research Journal, 20(2), 1–17. https://doi.org/10.52041/serj.v20i2.358
Jeannotte, D., & Kieran, C. (2017). A conceptual model of mathematical reasoning for school mathematics. Educational Studies in Mathematics, 96(1), 1–16. https://doi.org/10.1007/s10649-017-9761-8
Jones, G., Langrall, C. W., Mooney, E. S., & Thornton, C. A. (2004). Models of development in statistical reasoning. In D. Ben-Zvi, & J. Garfield (Eds.), The challenge of developing statistical literacy, reasoning and thinking (pp. 97–117). Kluwer Academic Press. https://doi.org/10.1007/1-4020-2278-6_5
Kinnear, V. (in press). The role of context in young children's interpretation of a data table. Statistics Education Research Journal.
Kinnear, V. (2018). Initiating interest in statistical problems: the role of picture story books. In A. Leavy, M. Meletiou-Mavrotheris, & E. Paparistodemou (Eds.), Statistics in early childhood and primary education (pp. 182–200). Springer. https://doi.org/10.1007/978-981-13-1044-7_11
Kinnear, V., & Clark, J. (2014). Probabilistic reasoning and prediction with young children. In J. Anderson, M. Cavanagh, & A. Prescott (Eds.), Curriculum in focus: Research guided practice. Proceedings of the 37th Annual Conference of the Mathematics Education Research Group of Australasia (pp. 335–342). MERGA.
Konold, C., Finzer, W., & Kreetong, K. (2017). Modeling as a core component of structuring data. Statistics Education Research Journal, 16(2), 191–212. https://doi.org/10.52041/serj.v16i2.190
Konold, C., Higgins, T., Russell, S. J., & Khalil, K. (2015). Data seen through different lenses. Educational Studies in Mathematics, 88(3), 305–325. https://doi.org/10.1007/s10649-013-9529-8
Leavy, A. (2008). An examination of the role of statistical investigation in supporting the development of young children’s statistical reasoning. In O. N. Saracho & B. Spodek (Eds.), Contemporary perspectives on mathematics in early childhood education (pp. 215–232). Information Age Publishing.
Leavy, A., & Hourigan, M. (2018). Inscriptional capacities and representations of young children engaged in data collection during a statistical investigation. In A. Leavy, M. Meletiou-Mavrotheris & E. Paparistodemou (Eds.), Statistics in early childhood and primary education (pp. 89–108). Springer. https://doi.org/10.1007/978-981-13-1044-7_6
Leavy, A., Meletiou-Mavrotheris, M., & Paparistodemou, E. (Eds.) (2018). Statistics in Early Childhood and Primary Education. Springer. https://doi.org/10.1007/978-981-13-1044-7
Lehrer, R., & English, L. (2018). Introducing children to modeling variability. In D. Ben-Zvi, K. Makar, & J. Garfield, J. (Eds.), International handbook of research in statistics education (pp. 229–260). Springer. https://doi.org/10.1007/978-3-319-66195-7_5
Lehrer, R., & Schauble, L. (2000). Inventing data structures for representational purposes: Elementary grade students’ classification models. Mathematical Thinking and Learning, 2(1–2), 51–74. https://doi.org/10.1207/S15327833MTL0202_3
Lehrer, R., & Schauble, L. (2017). Children’s conceptions of sampling in local ecosystems investigations. Science Education, 101(6), 968–984. https://doi.org/10.1002/sce.21297
Lehrer, R., Kim, M. -J., & Schauble, L. (2007). Supporting the development of concepts in statistics by engaging students in measuring and modelling variability. International Journal of Computers for Mathematical Learning, 12, 195–216. https://doi.org/10.1007/s10758-007-9122-2
Makar, K. (2014). Young children’s explorations of average through informal inferential reasoning. Educational Studies in Mathematics, 86(1), 61–78. https://doi.org/10.1007/s10649-013-9526-y
Makar, K. (2016). Developing young children’s emergent inferential practices in statistics. Mathematical Thinking and Learning, 18(1), 1–24. https://doi.org/10.1080/10986065.2016.1107820
Makar, K. (2018). Theorising links between context and structure to introduce powerful statistical ideas in the early years. In A. Leavy, M. Meletiou-Mavrotheris, & E. Paparistodemou (Eds.), Statistics in early childhood and primary education: Supporting early statistical and probabilistic thinking (pp. 3–20). Springer. https://doi.org/10.1007/978-981-13-1044-7_1
Makar, K., & Rubin, A. (2009). A framework for thinking about informal statistical inference. Statistics Education Research Journal, 8(1), 82–105. https://doi.org/10.52041/serj.v8i1.457
Makar, K., & Rubin, A. (2018). Learning about statistical inference. In D. Ben-Zvi, K. Makar, & J. Garfield (Eds.), The international handbook of research in statistics education (pp. 261–294). Springer. https://doi.org/10.1007/978-3-319-66195-7_8
Mason, J., Stephens, M., & Watson, A. (2009). Appreciating mathematical structure for all. Mathematics Education Research Journal, 21(2), 10–32. https://doi.org/10.1007/BF03217543
Mulligan, J. (2015). Moving beyond basic numeracy: data modeling in the early years of schooling. ZDM – Mathematics Education, 47(4), 653–663. https://doi.org/10.1007/s11858-015-0687-2
Mulligan, J., & Mitchelmore, M. (2009). Awareness of pattern and structure in early mathematical development. Mathematics Education Research Journal, 21(2), 33–49. https://doi.org/10.1007/BF03217544
Mulligan, J., Oslington, G., & English, L. (2020a). Supporting early mathematical development through a 'pattern and structure' intervention program. ZDM – Mathematics Education, 52(4), 663–676. https://doi.org/10.1007/s11858-020-01147-9
Mulligan, J., & Watson, J. (1998). A developmental multimodal model for multiplication and division. Mathematics Education Research Journal, 10(2), 61–86. https://doi.org/10.1007/BF03217343
Mulligan, J., Woolcott, G., Mitchelmore, M., Busatto, S., Lai, J., & Davis, B. (2020b). Evaluating the impact of a Spatial Reasoning Mathematics Program (SRMP) intervention in the primary school. Mathematics Education Research Journal, 32(2), 285–305. https://doi.org/10.1007/s13394-020-00324-z
NSW Education Standards Authority. (2019). Mathematics in Kindergarten to Year 10. https://educationstandards.nsw.edu.au/wps/portal/nesa/k-10/learning-areas/mathematics
Oslington, G. (2018). Second-graders' predictive reasoning strategies. In E. Bergqvist, M. Osterholm, C. Granberg, & L. Sumpter (Ed.), Proceeding of the 42nd Conference of the International Group for the Psychology of Mathematics Education. 3, pp. 435–442. Umeå, Sweden: PME.
Oslington, G., Mulligan, J., & Van Bergen, P. (2020). Third-graders’ predictive reasoning strategies. Educational Studies in Mathematics, 104(1), 5–24. https://doi.org/10.1007/s10649-020-09949-0
Oslington, G., Mulligan, J., & Van Bergen, P. (2021). The development of predictive reasoning in Grades 3 through 4. In Y. H. Leong, B. Kaur, B. H. Choy, S. L. Chin, & J. B. Yeo (Ed.), Excellence in Mathematics Education: Foundations and Pathways (Proceedings of the 43rd annual conference of the Mathematics Education Research Group of Australasia), (pp. 305–312). MERGA.
Papic, M., Mulligan, J., & Mitchelmore, M. (2011). Assessing the development of preschoolers’ mathematical patterning. Journal for Research in Mathematics Education, 42(3), 237–269. https://doi.org/10.5951/jresematheduc.42.3.0237
Pfannkuch, M. (2018). Reimagining curriculum approaches. In D. Ben-Zvi, K. Makar & J. Garfield (Eds.) International Handbook of Research in Statistics Education (pp. 387–412). Springer. https://doi.org/10.1007/978-3-319-66195-7_12
Pfannkuch, M., & Wild, C. (2004). Towards an understanding of statistical literacy. In D. Ben-Zvi & J. Garfield (Eds.), The challenge of developing statistical literacy, reasoning and thinking (pp. 17–46). Kluwer Academic Press.
Reading, C., & Shaughnessy, M. (2004). Reasoning about variation. In D. Ben-Zvi & J. Garfield (Eds.), The challenge of developing statistical literacy, reasoning and thinking (pp. 201–226). Kluwer Academic Press.
Shaughnessy, J. M. (2007). Research on statistics learning and reasoning. In F. K. Lester (Ed.), Second handbook of research on mathematics teaching and learning: A project of the National Council of Teachers of Mathematics (pp. 957–1009). Information Age Publishing.
Stephanou, A., & Lindsey, J. (2013). Progressive achievement tests in mathematics (PAT Maths) (4th ed). Australian Council for Educational Research.
Suh, J. M., Wickstrom, M., & English, L. D. (Eds.). (2021). Exploring mathematical modeling with young learners. Springer.
Supply, A. -S., Dooren, W. V., Lem, S., & Onghena, P. (2020). Assessing young children’s ability to compare probabilities. Educational Studies in Mathematics, 103(1), 27–42. https://doi.org/10.1007/s10649-019-09917-3
Watson, J. (2006). Statistical literacy at school: Growth and goals. Lawrence Erlbaum.
Watson, J. (2009). The influence of variation and expectation on the developing awareness of distribution. Statistics Education Research Journal, 8(1), 32–61. https://doi.org/10.52041/serj.v8i1.456
Watson, J. (2018). Variation and expectation for six-year-olds. In A. Leavy, M. Meletiou-Mavrotheris, & E. Paparistodemou (Eds.), Statistics in early childhood and primary education: supporting early statistical and probabilistic thinking (pp. 55–73). Springer. https://doi.org/10.1007/978-981-13-1044-7_4
Watson, J., Campbell, K. J., & Collis, K. F. (1993). Multimodal functioning in understanding fractions. Journal of Mathematical Behavior, 12, 45–62.
Watson, J., Collis, K., Callingham, R., & Moritz, J. (1995). A model for assessing higher order thinking in statistics. Educational Research and Evaluation, 1(3), 247–275. https://doi.org/10.1080/1380361950010303
Watson, J., & Fitzallen, N. (2021). What sense do children make of “data” by Year 3? In Y. H. Leong, B. Kaur, B. H. Choy, J. B. W. Yeo, & S. L. Chin (Eds.), Excellence in mathematics education: Foundations and pathways. Proceedings of the 43rd annual conference of the Mathematics Education Research Group of Australasia. (pp. 409–416). MERGA.
Watson, J., Fitzallen, N., English, L., & Wright, S. (2020). Introducing statistical variation in year 3 in a STEM context: Manufacturing licorice. International Journal of Mathematical Education in Science and Technology, 51(3), 354–387. https://doi.org/10.1080/0020739X.2018.1562117
Watson, J., & Kelly, B. (2005). The winds are variable: Student intuitions about variation. School Science and Mathematics, 105(5), 252–269. https://doi.org/10.1111/j.1949-8594.2005.tb18165.x
Watson, J., Kelly, B., Callingham, R., & Shaughnessy, M. (2003). The measurement of school students’ understanding of statistical variation. International Journal of Mathematical Education in Science and Technology, 34(3), 1–29. https://doi.org/10.1080/0020739021000018791
Watson, J., & Moritz, J. (1999). The beginning of statistical inference: comparing two data sets. Educational Studies in Mathematics, 37, 145–168. https://www.jstor.org/stable/3483313
Watson, J., & Moritz, J. (2001). Development of reasoning associated with pictographs: representing, interpreting, and predicting. Educational Studies in Mathematics, 48(1), 47–81. https://www.jstor.org/stable/3483115?seq=1
Watson, J., Wright, S., Fitzallen, N., & Kelly, B. (2022). Consolidating understanding of variation as part of STEM: Experimenting with plant growth. Mathematics Education Research Journal. https://doi.org/10.1007/s13394-022-00421-1
Wild, C. J., & Pfannkuch, M. (1999). Statistical thinking in empirical enquiry. International Statistics Review, 67(3), 223–265. https://doi.org/10.1111/j.1751-5823.1999.tb00442.x
Funding
Open Access funding enabled and organized by CAUL and its Member Institutions.
Author information
Authors and Affiliations
Corresponding author
Ethics declarations
Ethics approval and consent to participate
The data reported in this paper was collected by the first author as a Ph.D. candidate. This paper comprises post-doctoral analyses. The research is consistent with the principles of the research ethics of the American Psychological Association and approved through Macquarie University Ethics Committee (No. 5201600461). Parents/caregivers and teachers provided informed consent.
Competing interests
The authors declare no competing interests.
Additional information
Publisher's Note
Springer Nature remains neutral with regard to jurisdictional claims in published maps and institutional affiliations.
Rights and permissions
Open Access This article is licensed under a Creative Commons Attribution 4.0 International License, which permits use, sharing, adaptation, distribution and reproduction in any medium or format, as long as you give appropriate credit to the original author(s) and the source, provide a link to the Creative Commons licence, and indicate if changes were made. The images or other third party material in this article are included in the article's Creative Commons licence, unless indicated otherwise in a credit line to the material. If material is not included in the article's Creative Commons licence and your intended use is not permitted by statutory regulation or exceeds the permitted use, you will need to obtain permission directly from the copyright holder. To view a copy of this licence, visit http://creativecommons.org/licenses/by/4.0/.
About this article

Cite this article
Oslington, G., Mulligan, J. & Van Bergen, P. Shifts in students’ predictive reasoning from data tables in years 3 and 4. Math Ed Res J (2023). https://doi.org/10.1007/s13394-023-00460-2
Received:
Revised:
Accepted:
Published:
DOI: https://doi.org/10.1007/s13394-023-00460-2