
Abstract
Metadata management constitutes a key prerequisite for enterprises as they engage in data analytics and governance. Today, however, the context of data is often only manually documented by subject matter experts, and lacks completeness and reliability due to the complex nature of data pipelines. Thus, collecting data lineage—describing the origin, structure, and dependencies of data—in an automated fashion increases quality of provided metadata and reduces manual effort, making it critical for the development and operation of data pipelines. In our practice report, we propose an end-to-end solution that digests lineage via (Py‑)Spark execution plans. We build upon the open-source component Spline, allowing us to reliably consume lineage metadata and identify interdependencies. We map the digested data into an expandable data model, enabling us to extract graph structures for both coarse- and fine-grained data lineage. Lastly, our solution visualizes the extracted data lineage via a modern web app, and integrates with BMW Group’s soon-to-be open-sourced Cloud Data Hub.
1 Introduction
With the increased adoption of cloud services over the last few years, organizations have found easy means to collect, store, and analyze vast amounts of structured and unstructured data from heterogenous sources. Starting in the 2010s, distributed-data-processing frameworks such as Apache Spark have increasingly gained momentum to help data engineers and scientists process data at the scale of petabytes. Gartner states, however, that about 80 percent of data lakes do not effectively collect metadata [1], as it is easier to create and dump data than to curate it. Hence, a major part of preparing data consists of handling missing and erroneous metadata [2].
As a response to this, organizations introduce data catalogs to document (previously) ungoverned data on their platforms, maintaining an inventory of and providing documentation capabilities for data [1]. While this helps data consumers to better understand and grasp the context of data, such catalogs are often not able to sufficiently capture the provenance of datasets given the complex set of variables involved—even with thriving data communities in place.
Data lineage, also referred to as data provenance, surfaces the origins and transformations of data and provides valuable context for data providers and consumers [3]. We typically differentiate between coarse-grained and fine-grained lineage for retrospective workflow provenance. While the former describes the interconnections of pipelines, databases and tables, the latter exposes details on applied transformations that generate and transform data [4, 5]. Hence, fine-grained lineage enables our platform users to monitor, comprehend, and debug complex data pipelines [6]. In technical terms, it includes the origin, sequence of processing steps, and final state of a dataset. Applying the concept of lineage tackles the aforementioned drawbacks by extending largely manually curated data catalogs with rich, human-readable, and automatically generated context on datasets.
In the context of data lakes, there typically exist two types of pipelines:
-
Stream-based: ingestion and transformation pipelines process and act on an unbounded stream of data close to real time.
-
Batch-based: ingestion and transformation pipelines operate on more traditional sources of data (typically relational data).
While the pure volume of data is driven by stream-based ingestion, we find that 80 percent of datasets require (some sort of) batch processing at the BMW Group. Moreover, our experience shows that lineage is inherently less complex in stream processing, where we are mostly using a sequence of stateless event transformation steps. Hence, we are focusing on data lineage in batch-based Extract Transform Load (ETL) jobs by tracking the transformations that read, transform, and persist data to our data lake. Based on that, we add context on a dataset’s provenance to meet the requirements of data engineers and scientists to be able to trust, discover, and comprehend the types of transformations for data passing through our system. As a side effect, we collect adjacent metadata including, but not limited to, job health and data quality metrics [3]. Lastly, we expose the resulting lineage graphs in a consumable web frontend.
We structure our research around the Cloud Data Hub (CDH), which represents BMW Group’s cloud-based data lake. At the scale that we operate, data availability, discoverability, and usability are quintessential, and platform users demand an increased level and quality of metadata to be able to understand dependencies between datasets and associated ETL jobs.
Use case example: A data engineering team needs to calculate sales metrics for the management team based on a dataset that contains multiple tables. The team found a dataset X within our platform, but it is unclear how it was created. By exploiting lineage for this dataset, the sequence of operations to generate this dataset can be inspected and analyzed. While browsing the individual transformations of the underlying ETL jobs, the team can, e.g., ensure that the pipeline did not filter or remove critical data for calculating the aforementioned metrics. Based on this exploration, the team has gained trust in the data and proceeds to calculate the metrics.
2 Related research
This section provides an overview of the current state of research, focusing on how data lineage can be collected, modeled and visualized.
2.1 Collecting lineage: An inherently complex endeavor
Broadly, there exist the following approaches to collect data lineage [6]:
-
Compiler-based instrumentation extracts logic based on the application code, requiring extended knowledge about the source code. For example, SPROV [7] tracks data lineage and other metadata by adding a wrapper to the standard C I/O library.
-
Dynamic instrumentation describes the extraction of data lineage by changing or explicitly modifying the program code to do so. Titian [8] and Pebble [9] track lineage of Spark jobs on tuple-level and support in the more efficient debugging during the development of data pipelines. Another approach for dynamic instrumentation is the usage of APIs [10, 11]. Both Spline [12] and Atlas [13] follow this pattern.
-
Scavenging instrumentation leverages generated logs and transforms these into provenance data. BeepBeep [14] and Google’s data lake Goods [15] are centered on the analysis of event logs and extract coarse-grained data lineage by digesting these. They are therefore not bound to a specific processing engines (e.g. Spark).
In practice, data lineage mostly builds upon dynamic and scavenging instrumentation. Besides Spline and Atlas, there is (to the best of our knowledge) no other solution to extract data lineage directly from Spark jobs. The other mentioned approaches require significant engineering efforts and will therefore not be considered further.
2.2 Modeling data lineage
Many approaches model data lineage via the Resource Description Framework (RDF), following a predefined ontology for the definition of entities. Open Provenance Framework (OPM) [16] and its successor W3C PROVFootnote 1 are standardized ontologies to model data lineage via the RDF and aim to provide interoperability for as many entities and systems as possible. The described ontologies resonated in related work for coarse-grained data lineage, such as Colt [11], Provenance Map Orbiter [17], or Karma [18]. While approaches that implement W3C PROV or OPM typically only include coarse-grained data lineage [19], Karma is one of the few that models different levels of granularity in compliance with OPM within its two-layered information model.
However, organizations typically demand flexibility, simplicity, and analytical capability when modeling lineage. This can be achieved by using non-standard data models built upon property graphs, where one sacrifices on interoperability, formalism, and standardization [20, 21].
2.3 End users require easy-to-use lineage visualizations
We place an emphasis on the visual representation of the lineage graph, as it is paramount to extract value from and leverage the collected metadata. Visualizing data lineage has been subject of various research.
Provenance Map Orbiter [17] attempts to simplify provenance graphs by nesting nodes. Nodes can be summarized within one node and expanded to visualize each node by its own, depending on the zoom level. Once users zoom into the graph, more detailed information is exposed.
Chen et al. [22] summarize three aspects to visualize complex (data) lineage graphs. First, nodes should be styled in accordance to their entity type, such that users can easily distinguish these in the graph. Second, nodes should dynamically expand to allow users to obtain more information about a node. Third, hierarchical structures built upon layers improve readability, and can be used in conjunction with a breadth-first search algorithm (to determine the layers) [22].
The lineage tool OctopaiFootnote 2 visualizes the schema of operations directly within the nodes, which we perceive as an unfavorable design principle, as it introduces unnecessary complexity. The technical overview in the Spark UIFootnote 3 allows users to monitor the status and resource consumption of the executions, which is far off from providing consumable lineage to end users.
While we can derive guiding principles on how to visualize data lineage based on existing research, we identified a gap in the holistic representation and visualization of both coarse- and fine-grained lineage via a graph-based structure.
3 Architecture
In this section, we will discuss our design decisions and outline our approach towards collecting data lineage, the architecture of our prototype, and the data model.
3.1 A brief overview of BMW Group’s data stack
Starting in the 2010s, the BMW Group started to embark on its journey of introducing a central platform to provide answers for its analytical demands. Starting in 2019, we migrated these workloads onto the so-called CDH to leverage the rich portfolio of cloud services from AWS to store, access, and explore data at scale. Our platform currently houses more than two petabytes of data, and we ingest ten terabyte daily into our system on average. Our data catalog hosts more than 1,000 datasets across the entire value chain, which are used by thousands of data engineers and stewards of the BMW Group.
The stack will be open sourced until end of 2021, and an overarching architecture can be retrieved via data.bmwgroup.com. We provide end users with intuitive means to interact with the platform’s features by using the Data Portal, which is a modern web portal that features a data catalog, use case-catalog, query editor, and options for orchestrating infrastructure required for data preparation and analyses.
The most fundamental entity on our platform is represented by a dataset. Datasets are defined by a unique ID and have exactly one associated S3 bucket. We distinguish between two types of metadata for this entity [2]: Active metadata, collected manually via subject matter experts, provides contextual information to end users and includes, but is not limited to, a dataset’s friendly name, maturity level, and owner. Passive metadata, which is automatically inferred by the system, provides information about, for example, the physical storage location, format, and (database) schema. On our platform, we organize database-, table-, and column-level metadata via Glue Data Catalog, AWS’ fully managed metadata catalog.
3.2 Discussion of data-lineage collection mechanisms
On our platform, we orchestrate Spark jobs as depicted in Fig. 1 and implement data transformations using (Py‑)Spark, commit these to a code repository that leverages pre-baked Terraform modules, and then orchestrate and trigger the job via AWS GlueFootnote 4. Based on this setup, we identified three viable data collection strategies:
-
We could use static code analysis to extract lineage directly from the source code. However, with increasing code complexity this is difficult to achieve. Furthermore, Spark optimizes the sequence of operations and might execute the pipeline in a changed sequence. It might even skip operations that do not have any effect. There is also no knowledge extraction during job runtime. Summarizing, we can only collect partial information about the data lineage with this complex approach.
-
We could facilitate our system to analyse S3 access logs via CloudWatchFootnote 5. We can hence track read and write access to data and correlate these events to other datasets and/or jobs, meaning that we can generate coarse-grained lineage. This approach constitutes a complex engineering endeavor, and we are in addition to that not able to extract details on the logic of Spark jobs (which means that fine-grained lineage cannot be generated).
-
We could use Spark’s built-in API to extract details on a job’s execution plan, meaning that we are able to process the transformation steps on the data itself. Open-source tools such as Spline automatically transform these execution plans and hence provide a solid foundation for the data lineage extraction.

Orchestration of a Spark job on the Cloud Data Hub (CDH)
The latter can be further leveraged to formulate fine-grained data lineage, which is why we decided to embark on this path.
3.3 Lineage tracking via Spline
SplineFootnote 6, which is derived from Spark Lineage, constitutes an open-source project and tracks lineage of Apache Spark jobs [12]. It consists of an agent, a RESTful API, and a web-based UI.
The Spline Agent is a complementary module to the Spline project and captures runtime lineage information from Spark SQL jobs. As a Scala library embedded into the Spark driver, it listens to Spark SQL events and captures logical execution plans [12]. It utilizes Spark’s interface QueryExecutionListeners to pass query execution objects to specified handlers. These objects contain the plans that Spark SQL creates during the evaluation and optimization of the job execution. Once an execution is successfully evaluated, Spline utilizes the analyzed (logical execution) plan and emits a JSON object, in which it structures the sequence of the transformations to the structure via an order ID and, if applicable, the IDs of the preceding children. The object also provides details on the typeFootnote 7 and expression of executed transformations. Additionally, read and write operations contain the target Uniform Resource Identifier (URI). The Projection type can be further exploited into sub-typesFootnote 8. Calls of custom transformations via user defined functions in Spark SQL are also documented in the plan, even though their transformation logic is not included. Lastly, the JSON object and subsequently also corresponding metrics are sent to our Producer API, which is specified while initializing the Spline Agent as displayed in Fig. 2.

Architecture of the implemented lineage tool
Although the Spline project already ships with a server and UI component to help surface lineage, we decided to use merely the Spline Agent within our Data Portal and the corresponding backend components. However, our solution is inspired by Spline’s overall architecture in respect to taxonomy, core functionality, and interfaces.
3.4 A birds-eye view on our architecture
Our overarching goal is to connect fine-grained data lineage collected via Spline’s agent and use a custom-built architecture to digest and connect the obtained metadata with datasets and workflows built upon Glue ETL on our platform CDH.
We structured our architecture into the following components:
-
Our Producer API receives data lineage from execution plans of Spark jobs via the Spline Agent, and subsequently parses, transforms, and stores this metadata. Also, it adds a reference to the corresponding CDH dataset. Lastly, the performance metrics for executed Spark jobs from both the Spline Agent as well as the (AWS) Glue API are added.
-
The Consumer API constitutes the foundation to serve a react.js-based web application for our users and helps extracting lineage data.
-
Inspired by Spline, we are using a graph database built upon Amazon NeptuneFootnote 9 for modeling and storing lineage. Each object represents a sequence of operations, which can be modeled efficiently using our database.
-
Our React web app queries the Consumer API to retrieve lineage metadata and display a graph, in combination with other context from our platform. Our visualization facilitates users to interactively explore the resulting metadata.
As depicted in Fig. 2, our platform leverages a multi-tiered account setup. The Glue ETL job, Spark execution, and Spline Agent reside in the (upstream) data provider account as outlined in Fig. 2. Account owners can autonomously schedule jobs while being able to integrate the Spline Agent to emit job-level metadata to our (Producer) API, where we further process the metadata in an account where the aforementioned components are orchestrated. Consequently, while the tracking of lineage is federated across data providers, we centralize processing, storage, and provisioning of at platform-level to capture the complete transformation path.
4 Data model
In order to map the resulting lineage objects, we decided to use a property graph instead of RDF, since properties of an entity can be stored directly within a node. This enables us to maintain a significantly more compact graph. Furthermore, we can comfortably utilize the rich feature set of the graph traversal language GremlinFootnote 10, which provides out-of-the-box capabilities for, e.g., recursive graph traversals to efficiently and effectively analyze graph structures [23].
As outlined in Section 2.2, ontologies for lineage were subject to previous research. While these help mitigate graph ambiguity by validating the consistency of entities, a custom-built data model enables us to combine coarse- and fine-grained lineage without compromising on user experience and graph complexity. Also, it guarantees flexibility and adaptability, helping us in turn to model lineage in accordance to those use cases that matter most from our perspective.
4.1 Brief overview on our data model
Our resulting data model is based on entities and relationships in accordance to our platform, which are represented both as nodes or edges within our database and use labels to distinguish between types. We are differentiating entities as follows:
-
1.
Execution-dependent entities—such as job run, execution, write, transformation, read, and attribute—are created per execution and describe the transformation steps including the attributes and expressions for Spark jobs. These entities are used for fine-grained lineage.
-
2.
Execution-independent entities—such as job, dataset, and table—are created only once, with the first occurrence in an execution plan. For every other occurrence of the resource, only the properties or the edges will be updated. This sub-graph represents the coarse-grained data lineage.
4.2 Job runs and executions
Running a Spark job via Glue ETL leads to the creation of job run entities, which is reflected in our data model via schedule relationships to jobs (cf. Fig. 3). These job runs are identified by their job_run_id and contain the corresponding creation timestamps as well as at least one execution. The respective executions are depicted by a creates relationship via job runs.

Data model for the storage of Spark-based data lineage
As illustrated in Fig. 4, the job J1 consumes table T1 from dataset D1 and provides table T2 into dataset D2. While this corresponds to coarse-grained lineage, we retrieve fine-grained lineage by traversing the most recent job run and extracting the connected execution entities, as depicted in Fig. 5.

Coarse-grained lineage mapping

Fine-grained lineage mapping
Moreover, we are using Spline’s /execution-events API endpoint, which allows us to obtain (performance) metrics on executions. These metrics are reflected in the property metrics of the entity execution. The performance of job runs can be aggregated via the referenced executions.
As part of our data model, we deliberately accept redundancies to be able to efficiently extract and visualize data lineage in our graph. This can be also found within the execution entity, in which the input property represents the vertex and name of the dataset and table of the respective inputs. The output provides the same information for the respective outputs.
4.3 Mapping operations to our data model
We distinguish between three broad categories of operations that execution plans contain: read, transform, and write. The data model structures the operation entities in accordance to their sequence in the execution plan, which is in reverse logical order, meaning that the structure starts with write. We then establish a relationship executes from the entity execution to write, and connect each operation to its preceding operation with the follows relationship until we reach the beginning of the execution with one or multiple read entities.
Spline offers a variety of describing properties for operations out-of-the-box, which we store as part of the graph (e.g., operation_type, operation_params). Moreover, we deconstruct the abstract syntax tree of the expression and transform it to a human-readable string-based format and store it in the property operation_details. This allows us to display the expression of an operation in a human-readable format.
Lastly, and similarly to our deliberately modeled redundancies for executions, we are storing the schemas of input and output datasets (i.e. Spark DataFrame) directly within operations to simplify the extraction process. In order to achieve that, we rely on the attribute entity.
Attributes are unique entities within the context of single executions, and (multiple) operations may contain a uses relationship to these. The ID of the first operation to utilize an attribute is stored within the property origin. Thus, the first origin of an attribute can be easily identified within complex operation sequences. Moreover, we are able to identify the usage of an attribute across a sequence of operations in a given execution. The relationship between attribute and the respective operations is based on the output schema of each operation, which is provided by default from the execution plan.
4.4 Connecting the dots: Jobs, datasets, and tables
The entity job constitutes the foundation of the coarse-grained lineage, as it connects datasets and tables and also provides an entry point to fine-grained lineage via a relationship towards its job run entities.
Those jobs that we track are mapped to our platform’s definition of datasets, and we are obtaining further metadata via the CDH API to enrich the graph’s context. The retrieved metadata is persisted into the dataset_details property of the dataset entity. Moreover, the dataset’s ID is used for the property dataset_id.
We also designed our approach to work with jobs that process data outside of our platform (e.g. relational source databases). In this case, we do not leverage metadata from a CDH dataset and automatically omit the properties dataset_details and dataset_id. Instead, the property uri is set to the connection string of the respective database.
By creating relationships between jobs, datasets, and tables, we are able to visualize a graph as depicted in Fig. 3. In theory, we (implicitly) know which datasets are accessed by a single job, as these details are contained in the read and write operations. However, given the traversal complexity in (often) complex graphs, we pre-compute these relationships beforehand to avoid potential performance impediments downstream in the UI. Hence, if users are interested in coarse-grained lineage instead of individual table details, the traversal may follow the edges d_provides and d_isConsumedBy.
5 Visualizing lineage
We focus on implementing a web app that provides intuitive means for end users to consume and digest lineage metadata on our platform. Our react.js app effectively combines fine- and coarse-grained lineage, and hence provides rich context on a dataset’s upstream and downstream provenance as well its operations.
5.1 Choosing a suitable layout
Since the graph layout determines the position of nodes and edges, choosing a user-centric and intuitive approach to visualize lineage is quintessential. A high quality layout excels in its readability, and as lineage can be arbitrarily complex, the layout is essential for usability.
A popular method to layout directed graphs is the Sugiyama algorithm [24]. The goal of the algorithm is to find a hierarchical layout for a given directed graph according to the readability requirements. ELKjsFootnote 11 is a library that offers a Sugiyama implementation and is applied in the recently open sourced library ReaflowFootnote 12. We use Reaflow to build graphs efficiently with visually appealing layouts, and customize the nodes as we see fit. By utilizing the Sugiyama fundamentals, we achieved the following layout properties for the graph:
-
The graph is structured hierarchically from left to right, and the direction of edges represents the data flow between nodes.
-
Nodes on the same hierarchy are centered and balanced evenly and dynamically.
-
Edges are drawn (mostly) directly with Bezier curves.
A key concept for building the graph is to represent coarse- and fine-grained data lineage in conjunction as depicted in Fig. 6. Initially, the coarse-grained data lineage is extracted from Neptune with the execution of the latest job run for each job. Each execution can then be dynamically expanded by clicking on it. The expanded execution will then show the steps to transform the data. These transformation steps can then also be investigated further for the transformation expression or the input and output schema.
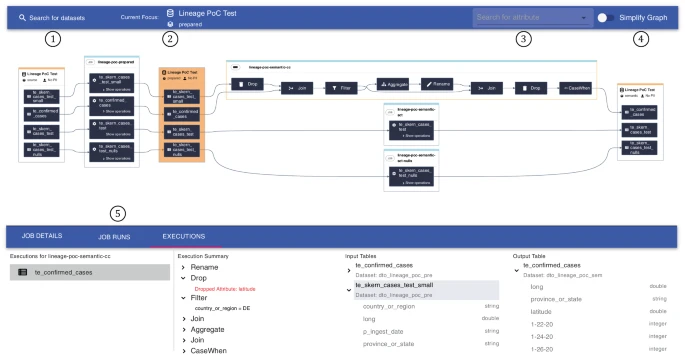
Web app built upon react.js displaying fine- and coarse-grained lineage
We constrain our lineage graph to provide context on a single dataset, which is a behavior that we refer to as lineage focus. Moreover, we can plot the lineage of a dataset’s corresponding Spark jobs that either provide or consumes data from the lineage focus.
5.2 Establishing a curated navigational experience
While statically inspecting data lineage constitutes a valid starting point, users demand interactivity to explore different levels of granularity of such metadata. Thus, we believe that providing a curated navigational experience for effectively consuming (potentially arbitrarily complex and rich) lineage graphs is key.
We annotated the foundational UI components in Fig. 6 with numbers and will directly refer to these while describing functionality in more detail:
-
Lineage focus: We constrain the displayed lineage graph to a single dataset, which we indicate prominently via an orange node. We also display related metadata as depicted in ②, and users are able to change the lineage focus by searching for and selecting other datasets as referenced in ①.
-
Attribute search: We also offer users to search for individual attributes above ③, which increases the lineage graph’s usability by indicating searchable attributes. The suggested attributes are based on those occurring in the current graph, and users benefit from type-ahead suggestions based on their provided input to quickly find the right attributes. As a result of a user selecting an attribute, each node in the graph containing the attribute is highlighted. For example, we highlight tables if the attribute is associated with it, and we similarly highlight executions and operations if the attribute is contained in the input or output schema.
-
Simplify graph: The toggle as depicted in ④ enables users to switch between fine- and coarse-grained lineage. While the graph in Fig. 6 constitutes a composition of fine- and coarse-grained lineage including datasets, tables, jobs, and operations, the coarse-grained lineage simplifies the graph and only displays datasets and jobs.
-
Details: Below ⑤, we display more context depending on the selected node within the graph. For example, while the executions tab offers additional details on individual job runs when selected, the tables tab provides context on the parent dataset and schema metadata. Moreover, we display the concrete expressions for selected operations in a human-readable format (e.g., a Drop operation will provide details on those attributes that were dropped).
As part of our user interviews, we received positive resonance on the features of our application and its design. We acknowledge, however, that there is still room for improvement with regards to, e.g., the navigation between datasets and depth of visible neighbors.
6 Outlook
Prospectively, we will place our emphasis on analyzing and visualizing changes of underlying data pipelines, given that our data model is capable of storing and mapping multiple job runs and executions already today. Hence, users will be able to inspect metadata in retrospective, based on historicized executions. Similar to MarquezFootnote 13, we may also introduce versioned schemas and transformations to support further analytical use cases based on lineage metadata. Our assumption is that versioning will accelerate investigating previous job runs drastically, providing state-of-the-art means to comprehend the evolution of datasets. Lastly, users may also compare different versions to easily detect deviations. Hence, users will find easy means to, for example, identify how filter conditions changed or whether attributes disappeared.
7 Conclusion
Our solution provides an end-to-end perspective on collecting, mapping, and visualizing lineage on our platform. We showed how to effectively work with existing (open source) components such as Spline, and proved that the dynamic instrumentation for Spark jobs provides a solid foundation for extracting lineage metadata. Since flexibility (in storing lineage) and ease of extraction are key in our context, we chose to implement a non-standard model based on a property graph, covering our needs for modeling coarse- and fine-grained lineage. We additionally utilized a graph database in conjunction with the traversal language Gremlin, which helps us to efficiently store and extract lineage.
In order to provide a practical solution to help discover and operate complex datasets, we integrated a dynamic exploration of the lineage graph that is exposed via a react.js-based web application. Our approach places emphasis on interactive capabilities and can be expanded to integrate with additional metadata including, but not limited to, job monitoring and versioning. We acknowledge, however, that the current state of our approach only provides a starting point, and we merely scratched the surface of how much value our users will be able to extract from data lineage in the foreseeable future.
Choosing Spline to collect lineage from Spark jobs came natural, as more than 80% of our jobs build upon Spark ETL and their corresponding execution plans contain all context we require. We faced a more complex decision in regard to our data model, where we decided to prioritize flexibility over interoperability (by choosing a property graph). Deciding to store our metadata in a graph database proved to be rewarding during extracting the relevant details, and we only required minimal preprocessing to visualize our graphs. We learned that visualizing graphs intuitively constitutes a major challenge, and we identified that an interactive navigation should be used as an overarching theme in our app.
Lastly, we want to emphasize that our approach copes with lineage metadata of Spark jobs; however, the reality is that organizations typically use a plethora of tools to ingest, transform, and analyze data. Although the insights of this implementation will help us develop our platform further to support displaying lineage of Spark jobs, the overarching value proposition of data lineage will only unfold when all employed tools are able to expose their lineage similarly.
Notes
These include Projection, Repartition, Join, Filter, Sort, and Aggregate.
These include more fine-grained transformations including, but not limited to, Rename and Drop.
References
Zaidi E, De Simoni G, Edjlali R, Duncan AD (2017) Data catalogs are the new black in data management and analytics. Gartner Research, pp 1–16. https://www.gartner.com/en/documents/3837968/data-catalogs-are-the-new-black-in-data-management-and-a
Beyer M, De Simoni G, Dayley A, Jain A (2021) The state of metadata management : data management solutions must become augmented metadata platforms. Gartner Research, pp 1–14. https://www.gartner.com/en/documents/3837968/data-catalogs-are-the-new-black-in-data-management-and-a
Herschel M, Diestelkämper R, Ben Lahmar H (2017) A survey on provenance: What for? What form? What from? Vldb J 26(6):881–906. https://doi.org/10.1007/s00778-017-0486-1
Tan WC (2007) Provenance in databases: past, current, and future. IEEE Data Eng Bull 30(4):3–12 (http://sites.computer.org/debull/A07dec/issue1.htm)
Carata L, Akoush S, Balakrishnan N, Bytheway T, Sohan R, Seltzer M, Hopper A (2014) A primer on provenance. ACM Queue 12(3):1–14. https://doi.org/10.1145/2602649.2602651
Zafar F, Khan A, Suhail S, Ahmed I, Hameed K, Khan HM, Jabeen F, Anjum A (2017) Trustworthy data: a survey, taxonomy and future trends of secure provenance schemes. Journal of Network and Computer Applications 94:50–68. https://doi.org/10.1016/j.jnca.2017.06.003
Hasan R, Sion R, Winslett M (2009) The case of the fake Picasso: preventing history forgery with secure provenance. In: Proceedings of the 7th USENIX Conference on File and Storage Technologies, FAST 2009
Interlandi M, Ekmekji A, Shah K, Gulzar MA, Tetali SD, Kim M, Millstein T, Condie T (2018) Adding data provenance support to Apache Spark. Vldb J 27(5):595–615. https://doi.org/10.1007/s00778-017-0474-5
Diestelkämper R, Herschel M (2019) Capturing and querying structural provenance in spark with pebble. In: Proceedings of the ACM SIGMOD International Conference on Management of Data, pp 1893–1896 https://doi.org/10.1145/3299869.3320225
Beheshti A, Benatallah B, Nouri R, Tabebordbar A (2018) CoreKG. Proc Vldb Endow 11(12):1942–1945. https://doi.org/10.14778/3229863.3236230
Aggour KS, Williams JW, McHugh J, Kumar VS (2017) Colt: concept lineage tool for data flow metadata capture and analysis. Proc Vldb Endow 10(12):1790–1801. https://doi.org/10.14778/3137765.3137783
Scherbaum J, Novotny M, Vayda O (2018pp) Spline: spark lineage, not only for the banking industry. In: Proceedings—2018 IEEE International Conference on Big Data and Smart Computing, BigComp 2018, pp 495–498 https://doi.org/10.1109/BigComp.2018.00080
Cloudera Spark entities created in Apache Atlas. https://docs.cloudera.com/runtime/7.2.2/atlas-reference/topics/atlas-spark-entities.html. Accessed 1 Feb 2021
Halle S (2020) Explainable queries over event logs. In: Proceedings - 2020 IEEE 24th International Enterprise Distributed Object Computing Conference, EDOC 2020, pp 171–180 https://doi.org/10.1109/EDOC49727.2020.00029
Halevy A, Korn F, Noy NF, Olston C, Polyzotis N, Roy S, Whang SE (2016) Goods: organizing Google’s datasets. SIGMOD 7(1):107–122. https://doi.org/10.5840/pom20087110
Moreau L, Plale B, Miles S, Goble C, Missier P, Barga R, Simmhan Y, Futrelle J, Mcgrath RE, Myers J et al (2008) The open provenance model (v1. 01)(2008), no. 3
Macko P, Seltzer M (2011) Provenance map orbiter: interactive exploration of large provenance graphs. In: 3rd Workshop on the Theory and Practice of Provenance, TaPP 2011
Jensen S, Plale B, Aktas MS, Luo Y, Chen P, Conover H (2013) Provenance capture and use in a satellite data processing pipeline. IEEE Transactions on Geoscience and Remote Sensing 51(11):5090–5097. https://doi.org/10.1109/TGRS.2013.2266929
Dibowski H, Schmid S, Svetashova Y, Henson C, Tran T (2020) Using semantic technologies to manage a data lake: data catalog, provenance and access control. CEUR Workshop Proceedings, vol 2757, pp 65–80
Goyal S, Chan W Real-time data lineage at UBS. https://neo4j.com/blog/real-time-data-lineage-ubs/. Accessed 10 Jan 2021
Albertus Donkers AJ, Yang D, Baken N (2020) Linked data for smart homes: comparing RDF and labeled property graphs. CEUR Workshop Proc 2636:23–36
Chen P, Plale B, Cheah YW, Ghoshal D, Jensen S, Luo Y (2012) Visualization of network data provenance. In: 2012 19th International Conference on High Performance Computing, HiPC 2012 (May 2014) https://doi.org/10.1109/HiPC.2012.6507517
Rodriguez MA (2015) The gremlin graph traversal machine and language. In: DBPL 2015 - Proceedings of the 15th Symposium on Database Programming Languages, pp 1–10 https://doi.org/10.1145/2815072.2815073
Sugiyama K, Tagawa S, Toda M (1981) Methods for visual understanding of hierarchical system structures. IEEE Transactions on Systems, Man, and Cybernetics. https://doi.org/10.1109/TSMC.1981.4308636
Funding
Open Access funding enabled and organized by Projekt DEAL.
Author information
Authors and Affiliations
Corresponding author
Rights and permissions
Open Access This article is licensed under a Creative Commons Attribution 4.0 International License, which permits use, sharing, adaptation, distribution and reproduction in any medium or format, as long as you give appropriate credit to the original author(s) and the source, provide a link to the Creative Commons licence, and indicate if changes were made. The images or other third party material in this article are included in the article’s Creative Commons licence, unless indicated otherwise in a credit line to the material. If material is not included in the article’s Creative Commons licence and your intended use is not permitted by statutory regulation or exceeds the permitted use, you will need to obtain permission directly from the copyright holder. To view a copy of this licence, visit http://creativecommons.org/licenses/by/4.0/.
About this article

Cite this article
Schoenenwald, A., Kern, S., Viehhauser, J. et al. Collecting and visualizing data lineage of Spark jobs. Datenbank Spektrum 21, 179–189 (2021). https://doi.org/10.1007/s13222-021-00387-7
Received:
Accepted:
Published:
Issue Date:
DOI: https://doi.org/10.1007/s13222-021-00387-7