
Abstract
An experimental study on the multiphase flow of heavy oil gas lift was conducted on 18.25 m high vertical tube. Based on the experimental results and the wellbore heat transfer mechanism, a coupling model of wellbore pressure–temperature gradients was presented for the gas lift with light oil injected from the annulus. Moreover, the solution of coupling annulus flow with tubing flow was also established through cyclic iteration. Experimental results showed that gas injection enables heavy oil and light oil to mix rapidly and completely. Evaluation of pressure drop models shows that the error of the Ansari model is approximately 12.12%, by comparison it is the least. A novel method of gas lift assisted with light oil from the annulus was proposed to solve the actual situation wherein heavy oil cannot be easily lifted from the wellbore at Tuyuke Block in Tuha Oilfield. An instance design based on the sensitivity analysis of the gas injection rate and diluting rate was also completed. The instance design shows that the productivity of heavy oil well can be significantly improved using gas lift and blending diluting oil technology. In order to verify the feasibility and effect of gas lift assisted with light oil in heavy oil well, a pilot test was implemented in Tahe Oilfield, Xinjiang, China. The results of pilot test show clearly that the daily production rate increased from 11.6 to 38 t/day, and the ratio of light oil with heavy oil decreased from 11:1 to 4:1. From the above, gas injection can significantly reduce the usage of light oil needed, and gas lift assisted with light oil injected from the bottom hole can significantly enhance the productivity of heavy oil wells.
Introduction
The accurate prediction of the pressure and temperature profile of the wellbore is the basis of the technology of gas lift assisted with light oil. However, considering the physical properties of heavy oil and the complexity of the heavy oil, gas, water three-phase flow, predicting the pressure drop of the multiphase flow of heavy oil is difficult, and some scholars (Zhang and Sarica 2006; Schmidt et al. 2008; Gokcal et al. 2009; Akhiyarov et al. 2010) have presented the models of pressure drop which are suitable for the multiphase flow of heavy oil in a particular situation. But unfortunately those models are not suitable when the physical properties of heavy oil or the environment changes. Therefore, the author conducted the experiment on heavy oil gas lift to choose the most suitable pressure drop model.
For heavy oil or water/oil emulsion, the conventional technology of Sucker Rod Pump (SRP), Progressive Cavity Pump (PCP) and Electric Submerged Pump (ESP) can hardly provide sufficient high-flow power to overcome the increasing loss of flow friction. As such, choosing the appropriate methods of artificial lift for the cold production of heavy oil is important. Based on theory of the reduction of wellbore viscosity and lifting, gas lift technology for heavy oil exploitation is relatively mature in many countries (Jaimes and Zimmerman 1985; Blann and Garcia 1999; Hernandez and Marcelo 2002; Hong’en et al. 2007; Brito et al. 2010). From 1982 to 1984, heavy oil exploitation in the Urdaneta offshore oilfield of Lake Maracaibo of Venezuela achieved success using slug gas lift (Jaimes and Zimmerman 1985). In 1988, the lifting of heavy oil containing water and sand achieved success in eastern Venezuela using the gas lift technology of air chamber pump (Hernandez and Marcelo 2002). In 1997, in the Morichal area of Venezuela, the optimization of injecting diluent (diesel oil) from the bottom of a well and the matching technology of gas lift showed that injecting diluent and gas lift can significantly enhance the production of heavy oil wells (Blann and Garcia 1999). Hernandez and Marcelo (2002) proposed a model to predict liquid production and gas consumption of a single well for gas chamber pump wells. In 2005, heavy oil exploitation achieved success using continuous gas lift in Intercampo oilfield of Venezuela (Hong’en et al. 2007). In view of the characteristics of an ultra-deep and complex wellbore in Tahe oilfield, Riyi et al. (2006) conducted research on the pressure and temperature prediction method for heavy oil mixed with diluent and laboratory experiments on viscosity reduction with different diluting rates. Zaihong et al. (2012) proposed the optimum design method of manufacturing parameters for heavy oil mixed with diluent based on the Tahe oilfield. However, considering that the technology of gas lift assisted with light oil for heavy oil exploitation has not yet been reported and based on the research of predecessors and the application status of gas lift for heavy oil, the author proposes a set of technologies for heavy oil lift that is suitable for the deep heavy oil reservoir.
Gas lift experiment
Conditions and methods of the experiment
The experimental loop, with a height of 18.25 m, an inner diameter of 50 mm (outer diameter of 60 mm), could simulate upflow and downflow. The loop uses 304 stainless seamless steel tube. The flow loop is an open circle equipped with advanced test equipment to monitor dynamically the experimental parameters, such as pressure, pressure drop, temperature, and flow rate. Figure 1 shows the sketch map of the loop structure.

Sketch map of the loop structure
There is a 6 m test section on the loop, where installed two differential pressure sensors (ΔP1, ΔP2) and two pressure sensors (P1, P2) separately. Pressures and differential pressures under different conditions, such as different liquid rates, gas rates, temperatures, and water cuts, can be recorded to determine the most suitable pressure drop model.
Experiment of heavy oil gas lift
Scope of the experimental parameters
Table 1 shows the experimental parameters, which consider the physical properties of heavy oil in Tuyuke Block, the higher water production rate, and the existing experimental condition.
The collected data contains pressure P1, P2 of the test section, gas injection pressure P, flow rate Q of gas injection, and liquid rate Ql controlled by the pump. We collected 360 sets of experimental data in total.
Experimental results and analysis
-
1.
By using the test data, we evaluated the prediction models of differential pressure, including Duns and Ros, Beggs and Brill, Ansari, and no-slip models, as shown in Fig. 2. We observed that the predicted points of the Ansari model are mostly concentrated along the diagonal. As such, this result is relatively suitable. The average error of pressure drop prediction for these four models are 32, 23.2, 12.1, and 42.7% in sequence. Evidently, the Ansari model has the lowest error. Thus, we can ascertain the Ansari model as the most suitable model to predict the wellbore pressure gradient of continuous gas lift in heavy oil wells.
Fig. 2 
Comparison between predicted and measured pressure
-
2.
At the bottom of the well, without gas injection, heavy oil sticks to the ball, and the mixing process of light oil and heavy oil is not evident, as shown in Fig. 3 (left). Meanwhile, with gas injection, the stirring effect of the mixture between heavy oil and light oil occurs. The slippage effect also accelerates to mix between heavy oil and light oil, as shown in Fig. 3 (right). Through the experiment, we determined that gas lift not only provides the energy for lift but also enhances the degree of mixing between heavy oil and light oil. As such, the efficiency of lift is improved.
Fig. 3 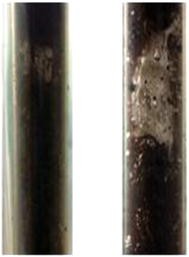
Comparison between the mixing of heavy oil and light oil with gas injection and without gas injection


Pressure–temperature coupling
Gas lift assisted with light oil is a single string, open, and continuous gas lift wellbore structure, as shown in Fig. 4. Light oil and gas were injected into the annulus at the normal temperature. We assumed that (Ren 1982; Riyi et al. 2006; Zaihong et al. 2012) (1) the wellbore flow and annulus flow are both one-dimensional flow; (2) the flow is maintained at a steady state; and (3) the heat conductivity coefficient of the tubing, casing, cement sheath, and formation is constant.

Wellbore structure
Based on the principle of steady heat conduction, as shown in Fig. 5, we could deduce the energy balance equations of heat flow circulation sections in the annulus and wellbore.

Heat transfer between the wellbore and formation
The heat transfer model of the annulus is expressed as follows:
The heat transfer model of the wellbore is expressed as follows:
The boundary condition of Eq. (1), i.e., the diluting temperature t(0) of the annulus, is known. At the bottom hole, considering the mixture of formation fluid and annulus fluid, the temperature y(n) of the gas injection point on the tubing, i.e., the boundary condition of Eq. (2), could be obtained using the simple energy balance equation (Eq. 3):
In the above formulas, cm is the specific heat of the liquid mixture; it can be calculated using the method of gravity weighted average.
Predicting annulus pressure gradient is tedious and difficult because the light oil and gas will flow down into the annulus and the mixture fluid density, viscosity, and surface tension of different cross sections will change continuously. The usual method to calculate downwelling flow uses the Mukherjee and Brill (1985) model. Assuming that the positive direction of coordinate Z is opposite to the direction of fluid flow, based on the momentum equation, its pressure gradient equation could be expressed as follows:
where ρm is the mixture density of the gas and oil phase in the annulus, kg/m3; g is the gravitational acceleration (= 9.81), m/s2; α is the deviation angle (−90°); vm is the mixture flow velocity of the gas and oil phase in the annulus, m/s; vSG is the apparent velocity of the gas phase, m/s; fm is the friction coefficient of the fluid mixture, dimensionless.
Based on the mathematical model of pressure and temperature established previously, we could determine the solution to the coupling of pressure and temperature by using the following processes:
-
1.
The distribution of formation temperature θ(x) is given and assumes that the profile of wellbore temperature is y(x).
-
2.
Assuming that the wellbore has n sections and calculating the temperature from wellhead to bottom hole in the annulus, we can obtain the temperature t(n) of the bottom hole in the annulus.
-
3.
After the mixture of heavy oil and light oil, we can obtain the temperature y(n) of the gas injection point in the bottom hole and then calculate the temperature from bottom hole to wellhead, thereby deriving the temperature y(0) of the wellhead.
-
4.
Comparing y(0) and the estimated temperature of the wellhead, if the errors less than the desired accuracy rate, then we can determine the temperature profiles of the annulus and wellbore. Otherwise, the calculated results will be used to recalculate the temperature profile, i.e., repeating the processes of (2)–(4) or using loop iteration to solve the problem.
Design method of heavy oil gas lift assisted with light oil
Setting the bottom hole as the solution node, we begin with nodal systems analysis. We observed less dissolved gas of heavy oil in Tuyuke Block and Tahe Oilfield, which is negligible. We used the productivity index method to analyze inflow performance relationship. The steps are as follows:
-
1.
Setting the tubing head pressure and the temperature of gas lift assisted with light oil.
-
2.
We obtained the bottom hole flow pressure by setting a group of light oil rates and gas injection rates, changing the heavy oil rates, and using the model of pressure–temperature coupling discussed previously to predict the distribution of pressure and temperature in the wellbore.
-
3.
Plotting the inflow and the outflow performance curve on one coordinate graph, the intersection point of two curves is the solution, i.e., production rate and pressure.
-
4.
By changing the light oil rate, gas injection rate, and formation pressure, and by repeating the processes of (1)–(3), we can obtain the solution of different conditions.
-
5.
We can accurately obtain and optimize the proration results on the basis of the results of nodal analysis.
Instance design
Basic data
The reservoir data, completion data, tubing data, and casing data are the basic data of the gas lift design, as shown in Table 2.
Sensitivity analysis
The results of the sensitivity analysis of the gas injection rate and light oil rate are shown in Figs. 6 and 7, respectively.

Relationship between light oil rate and gas injection rate under a certain production rate

Relationship between oil production rate and light oil rate under a certain gas injection rate
As shown in Fig. 6, at four different production rates, we observed that the required least gas injection rates to achieve these production rates are 1800, 3100, 5500, and 9700 m3/day, respectively. By adding gas injection, the blending amount can be obviously reduced,With the increase in gas injection rate, the amount of diluted gas drops sharply and tends to be stable soon. That is to say, there is a minimum value when mixing dilute content, when the amount of dilute is less than this value, it cannot be produced even if the gas lift is used. Figure 7 shows that the light oil rate will reach a critical value at different gas injection rates. Before this critical value, the production rate increases rapidly with the increase in the light oil rate. By contrast, after this critical value, the increase in the light oil rate will result in the decrease in the production rate. At the given range of gas injection rate, the critical light oil rate will increase with the increase in gas injection rate, at approximately 20–40 m3/day.
Field pilot test
In order to verify the feasibility and effect of gas lift assisted with light oil in heavy oil well, a pilot test was put into practice in YQX well. YQX is located in Tahe oilfield, Xinjiang, China, the crude oil of the well almost presented as solid state at the normal temperature, and the well had adopted the method of natural flow with blending light oil to produce heavy oil before a pilot test. With the declining of the formation pressure, production rate gradually lowers, and the ratio between light oil and heavy oil is increasing to keep flowing. So it is very necessary to take measures to improve the output and to decrease the usage of light oil. The well parameters are shown in Table 3.
Viscosity–temperature data of crude oil
The measured viscosity–temperature data of crude oil and light oil is shown in Fig. 8. To fit test data, we can get the light oil and heavy oil viscosity–temperature relation equations:

Viscosity temperature relationship of different proportions of mixture
Cragoe (1933) model has been used to calculate blended fluid viscosity. This model can be used to calculate different proportions of mixed oil. Calculation equation is as follows
It is assumed that the mixing ratio (the ratio of light oil to heavy oil volume) is 4:1, 7:1, 9:1, 11:1 as shown in Fig. 8. At the same temperature, the greater the amount of dilution, the better the viscosity reduction effect, but this trend with the increase in the amount of dilute. The viscosity decreases with the increase in temperature, which is consistent with the viscosity temperature curve of heavy oil.
Test analysis
Due to lacking of high-pressure gas injection equipment and pipeline, the natural gas produced from the oilfield could not be provisionally used as the high-pressure gas source for gas lift. So the nitrogen gas from a nitrogen-making truck (as shown in Fig. 9) was served as high-pressure gas source for gas lift assisted with light oil during the pilot test, and together with light oil, been injected into the annulus between the tubing and the casing, then the nitrogen gas and light oil enter the tubing via the tubing shoes.

The pilot test in YQX well
First, nitrogen started to be injected into the annulus on April 11, 2013, and then the light oil was injected into the annulus since the second day, and field experiments were carried out until the experiment stopped on April 23. Figure 10 shows the daily production rate before and during the pilot test.

Daily production rate before and during the pilot test
The results of pilot test show clearly that the daily production rate increased from 11.6 to 38 t/day, and the ratio of light oil and heavy oil decreased from 11:1 to 4:1. As a result, the crude oil increased by 218 t during the pilot test for 11 day. In short, the effect of the technology is very notable.
Conclusions
-
1.
The experiment on heavy oil gas lift shows that, in the three-phase flow, the water phase mainly distributes near the tubing wall, whereas the gas and oil phases mainly distribute near the center of the tubing. The emulsion phenomenon did not occur. By using the 360 sets of pressure data of the experiment on heavy oil gas lift to evaluate the Duns and Ros, Beggs and Brill, Ansari, and no-slip model, we observed that the error of pressure drop prediction for the Ansari model is the lowest at 12.1%.
-
2.
Based on the flow performance of heavy oil gas lift assisted with light oil, we established the coupling model of pressure–temperature prediction and coupled the flow of the tubing and annulus by cyclic iteration to obtain the numerical solution.
-
3.
The instance analysis shows that using gas lift only cannot lift heavy oil, and diluting only can lift heavy oil but with a low production rate. Using gas lift and diluting at the same time can evidently lower the light oil rates and enhance the production rate. On the basis of the nodal system analysis and sensitivity analysis, this paper provides the technological parameters of gas lift with diluting for the instance well.
-
4.
The results of pilot test show the technology proposed in this paper is both feasible and effective on improving the production rate and decreasing the usage of light oil. This paper combines gas lift with diluting and uses nodal systems analysis to propose a suitable technology of heavy oil lift for the deep heavy oil reservoir.
References
Akhiyarov DT, Zhang HQ, Sarica C (2010) High-viscosity oil-gas flow in vertical pipe. In: OTC 20617. Offshore technology conference, Taxas, 3–6 May
Blann JR, Garcia R, Guaramata (1999) Advances in heavy oil lifting in the Morichal area of Venezuela. In: SPE 52211. SPE mid-continent operations symposium, Oklahoma, 28–31 March
Brito F, Garcia L, Brown J (2010) Use of natural gas as a driving force in a diluent-gas artificial-lift system applied to heavy oils. In: SPE 139105, SPE Latin American & Caribbean petroleum engineering conference, Lima, Peru, 1–3 Dec
Cragoe CS (1993) Changes in the viscosity of liquid with temperature, pressure and composition. Presented at the 1st World Petroleum Congress, London, 18–24 July
Gokcal B, Al-Sarkhi A, Sarica C (2009) Effects of high oil viscosity on drift velocity for horizontal and upward inclined pipes. SPE Proj Facil Constr 4(2):32–40
Hernandez A, Marcelo R (2002) Field scale research on gas chamber pumps. In: SPE 77729. SPE annual technical conference and exhibition, San Antonio, 29 Sep–2 Oct
Hongen D, Yuwen C, Dandan H et al (2007) Application of gas lift technology to a high-water-cut heavy-oil reservoir in intercampo oilfield, Venezuela. SPE Prod Oper 2:46–49
Jaimes R, Zimmerman W (1985) Lagoven’s slug flow gas lift of heavy oil production. In: 3rd international UNITAR heavy crude &tar sands conference, Long Beach, 22–31 July
Mukherjee H, Brill JP (1985) Pressure drop correlations for inclined two-Phase flow. J Energy Res Tech 4:54–59
Ren Y (1982) Thermal production of viscous oil with recycling of hot fluid in well bore. J East Pet Coll 4:53–62
Riyi L, Zhaomin L, Jingrui W et al (2006) Technology of blending diluting oil in ultra-deep wellbore of Tahe oil field. Acta Pet Sin 3:115–119 (in Chinese)
Schmidt J, Giesbrecht H, van der Geld CWM (2008) Phase and velocity distributions in vertically upward high-viscosity two-phase flow. Int J Multiph Flow 4:363–374
Zaihong S, Shuang S, Dongshen H et al (2012) Multi-phase flowing law and production parameter design of heavy oil mixing with light oil. Chin J Hydrodyn 3:284–291
Zhang HQ, Sarica C (2006) Unified modeling of gas-oil-water pipe flow-basic approaches and preliminary validation. SPE Proj Facil Constr 2:1–7
Acknowledgements
The authors thank the financial support for this research by the special fund of China’s central government for the project of national first-level discipline in Oil and Gas Engineering.
Author information
Authors and Affiliations
Corresponding author
Additional information
Publisher’s Note
Springer Nature remains neutral with regard to jurisdictional claims in published maps and institutional affiliations.
Electronic supplementary material
Below is the link to the electronic supplementary material.
Rights and permissions
Open Access This article is distributed under the terms of the Creative Commons Attribution 4.0 International License (http://creativecommons.org/licenses/by/4.0/), which permits unrestricted use, distribution, and reproduction in any medium, provided you give appropriate credit to the original author(s) and the source, provide a link to the Creative Commons license, and indicate if changes were made.
About this article

Cite this article
Zhong, H.Q., Zhu, S., Zeng, W.G. et al. Research on heavy oil gas lift assisted with light oil injected from the annulus. J Petrol Explor Prod Technol 8, 1465–1471 (2018). https://doi.org/10.1007/s13202-018-0437-4
Received:
Accepted:
Published:
Issue Date:
DOI: https://doi.org/10.1007/s13202-018-0437-4