
Abstract
The phase diagram of the Al-Cu binary system was reinvestigated experimentally. The current study was designed to contribute to a better description of those parts of the phase diagram which are disputed in the current scientific literature, and in addition, to study the phase equilibria at 300 °C. The melting behavior of the θ-phase was confirmed to be peritectic. A metastable congruent solidification of the θ-phase was observed from the microstructural examination of as-cast samples. The location of the liquidus curve in this region of the phase diagram was more accurately defined using DSC measurements taken at slow-heating rates (1 °C min−1). The temperature stability of the ζ-phase was reevaluated and was found to lie in the range 373–597 °C. The phase boundaries of the γ′ + ε′ two-phase field were experimentally defined. Difficulties in defining the γ′/δ transition were addressed by a combined EDX/XRD investigation of more than ten samples that had been annealed in the temperature range of 500 to 750 °C. The (γ′ + δ) two-phase field was postulated from XRD studies of quenched samples. The temperature of the ordering reaction γ ↔ γ′ within the γ(γ′) + β phase field was experimentally determined to be 779.6 °C. All other parts of the Al-Cu phase diagram studied here were found to be in very good agreement with the most recent previous descriptions.
1 Introduction and Literature Review
1.1 Introduction
Reliable phase diagrams are essential for focused material development. The Al-Cu system, being the key binary system for many Al-based, Cu-based, and dural alloys, has been investigated intensively over recent decades owing to its importance to industry. The focus of most studies have been the Al-rich and Cu-rich parts of the phase diagram, respectively, which are used for interpreting microstructures of alloys that have been used in industrial applications. Knowledge of phase equilibria across the whole concentration range of a binary phase diagram is crucial for the extrapolation of material properties and thermodynamic modeling of higher order systems. Although the most recent experimental phase diagram, that was published by Ponweiser et al.[1] describes the whole concentration range, there are still some uncertainties and inconsistencies in the currently accepted version. Therefore, further experimental studies to clarify these points appear to be justified.
1.2 Literature Review
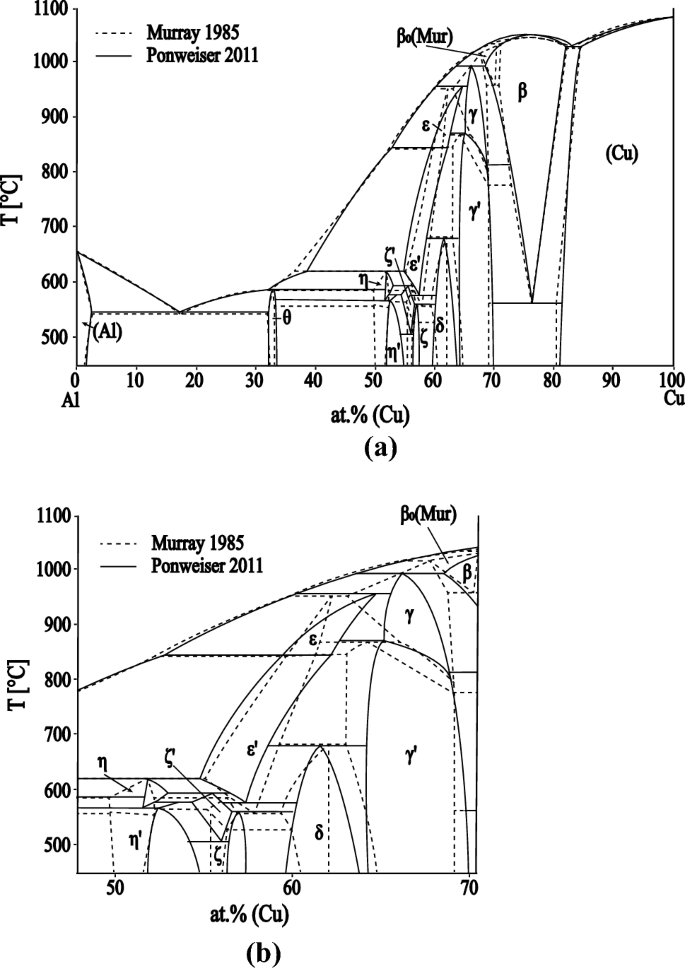
The Al-Cu phase diagram is characterized by many intermetallic phases with complex mutual relationships occurring in all regions of the phase diagram. The phase diagram has been studied by several authors, and several very comprehensive overviews have been published.[2,3,4,5] In the following section, we briefly discuss the state of knowledge of the binary phase diagram. For a better illustration of key points, a comparison of the evaluated phase diagram published by Murray[2] and that of Ponweiser et al.[1] is shown in Figure 1. Figure 1(a) shows the whole concentration range of the phase diagram, whereas Figure 1(b) shows just the central region.
The maximum solubility of Cu in Al is equal to 2.5 at. pct at the eutectic temperature of 550 °C.[2] The θ-phase (Al2Cu) was described for the first time by Owen and Preston[6] and also by Friauf.[7] The phase was characterized using XRD (single-crystal rotational method), and a tetragonal symmetry was found. The crystal structure of the θ-phase was determined later by Havinga[8] as having an I4/mcm space group. The melting behavior of the θ-phase has been described differently by different authors. In their experimental work, Histasune[9] found that the solidification of the θ-phase involved the peritectic reaction (Liquid + η → θ), and this was accepted by Murray in their review of the system.[2] On the other hand, Kulbush[10] (cited by Murray) presented the θ-phase as a congruently melting compound. According to Murray,[2] the θ-phase is stable up to 590 ± 1 °C. However, scatter in the experimental data for the liquidus and the invariant reactions close to the θ-phase does not allow the reaction type to be identified unambiguously. Goedecke and Sommer[11] investigated the melting and solidification behavior of the θ-phase and proposed the formation of a metastable congruently melting Al2Cum phase from undercooled liquid. Consequently, a metastable eutectic reaction L ↔ η+θ is observed on cooling and the stable peritectic reaction (L + η ↔ θ) is only observed on the heating of annealed samples. The composition of this metastable θ-phase is enriched in Cu relative to the stable θ-phase. The homogeneity range of the (stable) θ-phase lies between 32 and 33.6 at. pct Cu at 500 °C[1] and 32.1 to 32.6 at. pct Cu at the (Al)-θ eutectic temperature of 549 °C.[11]
The low-temperature η′-phase (Al48Cu52) has a monoclinic structure (space group C2/m).[12] Ponweiser et al.[1] studied the homogeneity range of this phase by SEM-EDX and XRD, and found that the η′-phase extends from 51.9 at. pct Cu to 54.8 at. pct Cu at 500 °C. DSC analysis showed that the low-temperature η′-phase is stable below 580 °C. Ponweiser et al.[1] supposed that the η′-phase is formed by a peritectoid reaction. This observation is in contrast with the previous experimental review; Murray[2] suggested a second-order transition between η and η′. The structure of the high-temperature η-phase was not known for a long time. Recently, Ponweiser et al.[1] determined the structure from high-temperature powder XRD data. The η-phase is orthorhombic (space group Cmmm), stable over the temperature range 574 °C to 625 °C and is also formed by peritectic reaction. The maximum homogeneity range is approximately 1 at. pct at 597 °C.
Two compositionally and crystallographically closely related phases, ζ and ζ′, are stable in the composition range 55 to 60 at. pct Cu. The structures of the ζ-family of phases, with the supposed low-temperature modification ζ′ (Al3Cu4) and high-temperature modification ζ (Al3Cu4-δ), are described in detail by Gulay and Harbrecht.[13,14] The ζ′-phase is orthorhombic (Fmm2) and is stable below 579 °C, according to Gulay and Harbrecht.[14] Ponweiser et al. suggested that the homogeneity range extends from 56 at. pct Cu and 57.5 at. pct Cu at 500 °C.[1] The ζ′-phase is formed by a peritectoid reaction at 560.5 °C. The ζ-phase crystallizes with the space group Imm2. Between 400 and 500 °C it decomposes to the ζ′-phase and η-phase and it is still stable at 550 °C.[13] Ponweiser et al. confirmed experimentally that the ζ-phase is stable below 597 °C and estimated that it decomposes eutectoidally at 507 °C.[1]
According to Murray′s review,[2] the ε-family of phases exists over the same composition range as the ζ-phases at medium and high temperatures. The structure of the medium-temperature modification ε′ was measured by high-temperature XRD by El-Boragy et al.[12] They found that the ε′-phase has a filled NiAs-type structure with partial occupation of the 2d sites by Cu atoms. The crystal structure of the high-temperature ε-phase is still unknown. It is assumed to be cubic.[2]
The situation in the composition range from 60 to 70 at. pct Cu is not clear and there are many contradictory data in the literature. Bradley[15] proposed the existence of three different phases with cubic, monoclinic and rhombohedral crystal structures, respectively. Westman[16] found that the δ-phase is trigonal rhombohedral and crystalizes with the space group R3m and they supposed the existence of a third phase of unknown structure between the cubic and the rhombohedral compounds. Seshadri and Downie[17] found five intermetallic phases in the Al-Cu phase diagram that are stable below 500 °C: θ, η′, ζ, the δ-phase and the γ′- phase. Murray[2] accepted the experimental work of Funamizu[18] in their review, which did not indicate any phase being present between the γ′-phase and δ-phase. Van Sande[19] studied the Al-Cu phase diagram using very slow-cooling experiments and confirmed the presence of a two-phase equilibrium between the γ′ and δ-phases. Ponweiser et al.[1] did not find any other equilibrium phase in this region but marked the whole composition area with a question mark because they were unable to clearly separate the two γ′ and δ single phase regions using their combined EDX and Rietveld refinement results. The samples all appeared to be single phase in the EDX studies, but the transition from cubic to trigonal rhombohedral was unclear from the XRD results.
Murray[2] concluded that there are two γ-phases; γ (low temperature) and γ′ (high temperature). The transition temperature was investigated by thermal analysis (temperature range 780 °C to 873 °C) but could not be confirmed metallographically. Liu et al.[3] studied the Cu-rich part of the phase diagram using several analytical methods (SEM-EDX, HT-XRD, DSC). They found that the γ-phase crystallizes with a CuZn γ-brass type structure. They did not find a two-phase region between the γ′- and γ-phases, so they proposed a second-order transition between the two. A second-order type of phase transition was also confirmed experimentally by Ponweiser et al.[1]
Dawson[20] identified the β-phase with an Im3m crystallographic structure, and proposed the existence of a high-temperature β0-phase. Murray[2] assumed in their phase diagram evaluation that it is formed by a peritectic reaction from β and liquid at 1037 °C. The existence of the β0-phase in the equilibrium phase diagram has not been confirmed subsequently. Liu et al.[3] showed a two-phase region between β (BCC_A2) and γ without any other phase occurring in that part of the diagram. Only one peak was found in their DSC measurements, which was interpreted as the solidus of the β-phase rather than the eutectoid reaction. According to,[2] the β-phase decomposes by a eutectoid reaction to (Cu) solid solution and the γ′-phase at a temperature of approximately 560 °C to 575 °C, and melts congruently at 1049 °C. The temperature of the eutectoid reaction was determined later by Ponweiser et al.[1] to be 567 °C using DTA investigations of several samples with differing compositions.
The α′ phase, with a composition of 77.5 at. pct Cu, is stable below 363 °C. The α′ phase has an ordered fcc long-period super lattice structure.[21] The maximum solubility of Al in Cu is 18.5 at. pct at the eutectoid temperature of 566.7 °C.[1]
The available information for all solid phases of the system is summarized in Table I. The abbreviated phase names in the form of Greek letters used in the text and phase diagrams are provided in the first column. Other common phase names used in the literature[1,2,5] are shown in column 2. The Pearson symbol and structure type (columns 3 and 4) are generally accepted from the Materials Science International Team (MSIT) report.[22] The maximum temperature and composition range of the stable phases according to different authors are presented in columns 4 to 6.
2 Experimental
The overall sample compositions were selected to address the unsolved questions in the experimental phase diagrams as mentioned above. The prepared samples were analyzed and characterized by different static or dynamic analytical methods (SEM-EDX, DSC, DTA; XRD).
2.1 Sample Preparation
Samples were prepared from pure elements of 5N purity. Any oxide present in the copper was reduced under flowing H2 at 300 °C for 3 hours. Samples were prepared by arc melting on a water-cooled copper plate under a low-pressure Ar atmosphere using pure Zr as a getter. The alloys were remelted several times to improve the homogenization of the material. Long-term annealing of the samples was performed at selected temperatures on material sealed in evacuated quartz glass ampoules. A conventional tube furnace was used for the heat treatment. Samples were quenched into cold water from their annealing temperatures. Annealing times and temperatures were selected with the aim of obtaining states close to thermodynamic equilibrium. Annealing temperature, time, overall composition, coexisting phases and phase compositions of each sample are listed in Table II.
2.2 Experimental Phase Diagram Investigation
A combination of dynamic and static methods was used for investigation of the phase diagram. Phase equilibria investigations and chemical analysis of phase and overall compositions were performed using scanning electron microscopy combined with energy-dispersive X-ray spectroscopy (SEM-EDX), employing either a Zeiss Supra 55 VP instrument equipped with an energy-dispersive detector for quantitative analysis or a similarly equipped SEM JEOL JSM-6460. Overall and phase compositions are listed in Table II in columns 4, 6, 7.
Identification of phases present in the long-term annealed samples was achieved using X-ray powder diffraction. A Bruker D8 Diffractometer equipped with a high-speed position sensitive (PSD) detector (Lynxeye) was used in the θ/2θ reflection setting. Coexisting phases in the samples are listed in Table II, column 5.
Phase transition temperatures were measured using a high-temperature heat flow DSC (NETZSCH Pegasus 404 C). Alumina DSC crucibles with lids were used under a permanent Ar flow of 50 mL min−1 and with heating and cooling rates of 10 °C min−1. Slower heating and cooling rates (5 or 1 °C min−1) were used in some special cases (see below). The calorimeter was calibrated using a set of pure metal standards having well-defined melting temperatures (Sn, Al, Zn, Cu, Ag, Au). Calibration was carried out under the same conditions as the experimental measurements. Three runs were performed for each sample; the thermal effects during the first heating run were not taken into account. It is assumed that optimal thermal contact between the sample and the bottom of the crucible is established only after the first heating. The temperature of the thermal effect used is thus the average value of the thermal effects of the 2nd and 3rd heating curves only. Small differences between the first and subsequent heating and cooling curves are caused by changes in the shape of the sample following initial melting. Melting the sample can result in an increase in the contact area between the sample and the crucible as the solidifying material takes the shape of the crucible wall. Thermal analysis results are listed in Table III.
3 Results and Discussion
More than 50 samples have been studied across the whole concentration and temperature range of Al-Cu phase diagram. Combining the results from DSC, SEM-EDX and XRD allows a complete description of the phase diagram to be proposed; shown in Figure 2. The results are mostly in very good qualitative agreement with the phase diagram of Ponweiser et al.[1] But the focus of the current study was on those parts of the phase diagram which have not been described satisfactorily previously.[1] Furthermore, phase equilibria at 300 °C have been investigated.
Experimental Al-Cu phase diagram based on this work (filled symbols) and on data published in Ref. [1] (empty symbols)
3.1 Solidification of the θ-Phase
A calculated phase diagram of the Al-Cu system was published by Liang and Schmid-Fetzer[5] where a semi-empirical CALPHAD-type assessment of the system was presented. The peritectic reaction L + η → θ was modeled but it was found that the calculated liquidus line in the composition range 33 at. pct < x(Cu) < 45 at. pct did not agree well with the experimental results published by Ponweiser et al.[1] A new CALPHAD-type assessment[23] attempts to provide better agreement between calculation and experiment for the liquidus in the 33 at. pct < x(Cu) < 45 at. pct concentration range, but this required a change in the nature of the solidification behavior of the θ-phase from peritectic to congruent.
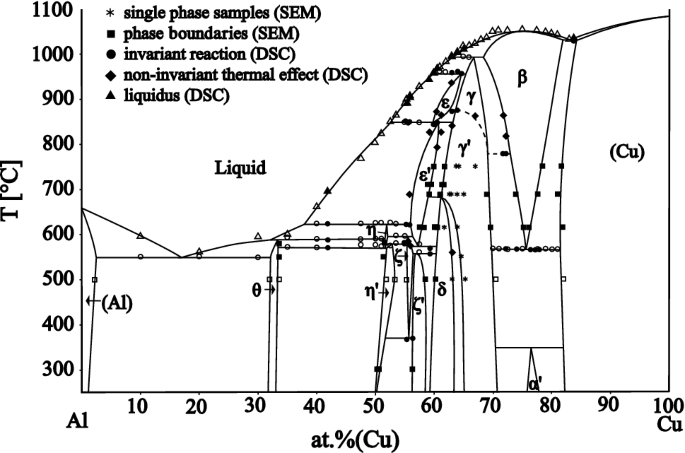
Congruent melting has been proposed previously,[10,11] but Goedecke[11] suggested that this reaction was in fact metastable. Because of these disagreements, the concentration range between 31 and 40 at. pct Cu has been reinvestigated in the present work. The solidification behavior of the θ-phase was studied using samples that had been melted, homogenized and then quickly cooled in the arc furnace. Two sets of samples were prepared with compositions close to 33.3 at. pct Cu; a set with slightly higher and a set with slightly lower copper contents. The morphology of the as-cast samples was studied using SEM. A eutectic microstructure was observed in both sets of samples, but the morphology of the microstructures was different for each set of samples (see Figure 3(a) for the Al-rich side and Figure 3(b) for the Cu-rich sample) as would be expected for a congruent reaction.

Eutectic microstructures observed by using SEM with a BSE detector in the as cast samples with overall composition x(Cu)=32.4 at. pct (a) and x(Cu)=33.9 at. pct (b)
In the second step, the melting behavior of the θ-phase was studied under conditions close to equilibrium and hence to the phase diagram for the thermodynamically stable system. Several samples with nominal composition between 32% Cu and 40% Cu were long-term annealed at 540 °C or 582 °C. The temperatures of the phase transitions were measured by DSC using sample cooling and heating rates of 1, 5 and 10 °C min−1, respectively. The data are presented in Figure 4, which also shows an enlarged portion of the phase diagram in the vicinity of the θ-phase. For all heating rates, both single phase samples containing the θ-phase, as well as samples exhibiting a two-phase morphology (θ + η′), indicate an invariant reaction at 589 °C, which is the temperature of the peritectic reaction L + η ↔ θ. There is no evidence of congruent melting in the long-term annealed samples.
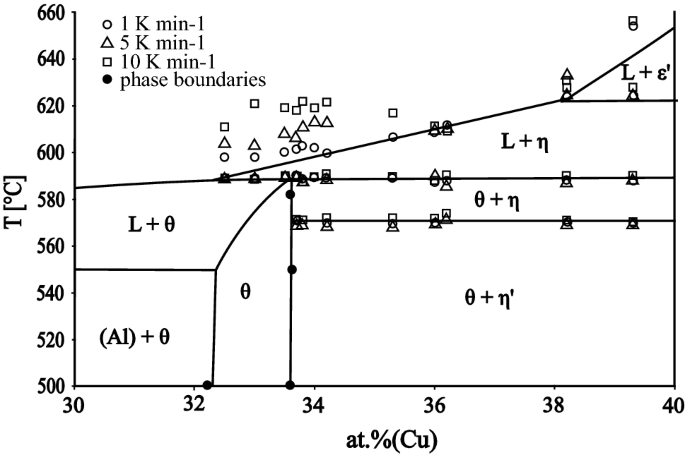
Detail of the Al-Cu phase diagram around the θ-phase with superimposed experimental data
Therefore, congruent melting of the θ-phase was confirmed to be a metastable reaction and the observed microstructures were found to be in very good agreement with the metastable version of the phase diagram published by Goedecke.[11] The discrepancy between the calculated[5] and experimental[1] liquidus line in this region is probably due to the fact that the metastable reactions were observed during DSC studies of Ponweiser et al.[1]
It is worth discussing the observed thermal effects associated with the liquidus that were seen at different heating rates in more detail. While the temperatures of the invariant reactions are independent of the heating rate, the (monovariant) thermal effects associated with the liquidus strongly depend on the heating rate (Figure 4). This is due to the fact that the liquidus thermal effect is superimposed on the peak maximum associated with the invariant when the two temperatures are very close to one another. In such a case, the thermal effect of the liquidus can no longer be separated and evaluated from the DSC curves. At higher heating rates, the peak maximum from the invariant is shifted to higher temperatures. Consequently, the lowest heating rate (1 °C min−1) yields the best representation of the true liquidus temperature and the liquidus line was drawn accordingly in Figure 4.
The samples that were annealed at 540 °C, 550 °C, 582 °C were studied to determine the location of the Cu-rich phase boundary of the θ-phase. The position of this phase boundary is temperature independent and lies at 33.5 at. pct Cu. The solubility limit of Cu in the η′-phase is 51.5 at. pct at 550 °C and 51.8 at. pct at 582 °C. The X-ray powder diffraction pattern of the Al-41.9 at. pct Cu sample that was annealed at 550 °C is shown in Figure 5. Lattice parameters that were obtained by Rietveld refinement were a = 12.1066(3) Å, b = 4.1024(1) Å, c = 6.9213(2) Å and β = 54.994(2)° for the η′-phase, and a = 6.0603(1) Å, c = 4.8763(1) Å for the θ-phase, respectively.

XRD pattern of the alloy Al-41.9% Cu containing θ (Al-33.6 at. pct Cu) and η′ (51.4 at. pct Cu). The numbers of phase percentage in the insert right was obtained by Rietveld refinement
3.2 The ε′ + γ′ Two-Phase Field
The phase boundaries in the high-temperature (ε′ + γ′) two-phase field have not been described satisfactorily in the literature. Several samples with nominal compositions close to Al-60Cu were long-term annealed at temperatures of 688 °C, 710 °C and 750 °C to determine these compositions. A selected micrograph, taken with an SEM in BSE mode, of the sample with the overall composition Al-60.1Cu that had been annealed at 710 °C, is shown in Figure 6. According to the present results, the (ε′ + γ′)/γ′ boundary is located between 61% Cu at 682.1 °C and 63.3% Cu at 846 °C (see Table IV, reactions number 7 and 9).

Micrograph in BSE mode of the sample with the overall composition Al-60.1Cu annealed at 710 °C (ε′ + γ′)
3.3 The γ′ to δ Phase Transition
Most of the previous studies of this part of the Al-Cu system agree on the existence of two separate phase fields for the δ and γ′-phases. The γ′-phase is cubic and crystallizes with the Al4Cu9-type structure, while the δ-phase can be described by a rhombohedrally distorted superstructure of the Al4Cu9 type. However, the location of the phase boundaries separating the two different phase fields have not been fixed reliably in any previous study. Ponweiser et al.[1] investigated this region by analyzing (by SEM/EDX) a fine raster of samples that had been annealed at 450 °C and found that all were single phase. Powder XRD analyses revealed that compositions between 60 and 63 at. pct Cu contained the single δ-phase. At 64 at. pct Cu, the diffraction pattern could not be evaluated completely, but in samples with higher Cu-contents the cubic γ′-phase was found.
In the current study, several samples with different compositions were annealed at different temperatures to locate the boundaries of the (δ + γ′) two-phase field. However, it was not possible to determine the phase boundaries of δ and γ′-phase fields by SEM-EDX measurement of the phase composition. The compositions of all grains in all samples were in agreement with the overall sample composition within the experimental error of the measurement. Thus, all samples were single phase based on EDX characterization, which is in complete agreement with.[1] On the other hand, careful analysis of the X-ray powder patterns showed that only two of the samples could be refined completely with one single structural model: the single δ-phase was identified in the sample Al-61.8Cu (615_7) and the single γ′-phase in the sample Al-67.1Cu (750_8). These two samples are marked with a circled star in Figure 7. All other samples in the composition range x(Cu)=(62-67) have XRD patterns that were evaluated as a combination of both γ′ and δ-phases even for a temperature higher than the presumed upper temperature limit of the δ-phase (682 °C). Samples give a diffraction pattern corresponding to either the δ or the γ′-phase but with small additional peaks which could not always be fitted well with the applied structural models.

Detail of the Al-Cu phase diagram in the δ/γ′ region with superimposed experimental data
The discrepancy between the SEM and XRD results may be explained by the fact that most of the samples investigated undergo the γ′ → δ phase transition during quenching. They were single phase γ′ at the temperature of annealing but were forced to undergo a fast rhombohedral distortion during the quenching process. Such a transition is usually incomplete as the structure may distort locally, but diffusion is not fast enough to allow macroscopic phase separation. Thus, it is proposed that all samples located at compositions between the two dashed lines in Figure 7 were frozen in a state of structural transition between γ′ and δ during the quenching process. The same is true for the sample at 64 at. pct Cu that had been annealed at 450 °C as reported in Reference 1. Using this hypothesis, it was possible to propose the location of the equilibrium two-phase field (γ′ + δ) as shown in Figures 2 and 7. It is strongly temperature dependent and shows a significant widening of the δ single phase field at lower temperatures.
3.4 High-Temperature Phase Transition Between γ′ and γ
The γ-phase is formed by the peritectic reaction L + β ↔ γ at 991 °C (Table IV, reaction 3). Ponweiser et al.[1] defined the γ′/γ phase transition as second order because they did not observe any indication of an invariant reaction involving the γ and γ′-phases. This conclusion was based on DTA measurements and on earlier results that were published by Liu et al.[3] The temperature stability of the γ′-phase has been described very well in the literature.[1,3] The temperature of the γ ↔ γ′ second-order transition lies between 874 °C and 779 °C. The higher temperature, which corresponds to the transition γ(γ′) ↔ γ(γ′) + ε, was established by,[1] and this temperature was confirmed by the present DSC measurements (Table III samples 500_3, 550_4, 688_6).
The lower temperature, corresponding to the transition γ(γ′) ↔ γ(γ′) + β (Table IV, reaction 8) results from DSC studies using heating and cooling rates of 1 °C min−1 in this work. Figure 8 shows the corresponding DSC curves. The temperature of the ordering reaction γ ↔ γ′ at the phase boundary of the two-phase field is 779.6 °C.
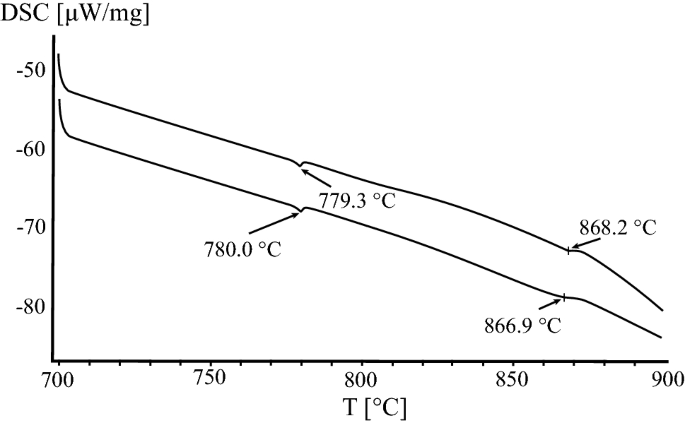
DSC heating 2nd and 3rd curves of the Al-71.8 at. pct Cu sample. Signals correspond to the temperature of the ordering reaction γ ↔ γ′, (β) (779.6 °C) and to the phase transition β ↔ β + γ (867.6 °C). Measurement conditions: inert atmosphere 5N Ar 50 mL min−1, heating rate 1 °C min−1
3.5 Revised Complete Phase Diagram
By combining all of the experimental results listed in Tables II through IV it is possible to obtain a complete binary phase diagram of the Al-Cu system, which is presented in Figure 2, with details shown in Figures 4 and 7. It agrees well with the phase diagram published by Ponweiser et al.[1] Liu et al.[3] and Riani et al.[24] but contains some additional clarification and improvement of areas which were not investigated in detail in the previous studies. The invariant reactions, together with the reaction temperatures and the compositions of the reacting phases are listed in Table IV. The proposed stable phase diagram should be used as a basis for further study, such as the effect of high pressures[25] or strong magnetic fields[26] on the Al-Cu binary phase diagram.
4 Conclusion
Although literature relating to the Al-Cu phase diagram is numerous, some of the complex phase equilibria are not well defined. The current study was designed to contribute to a better understanding of those parts of the phase diagram that needed improvement and refinement, and also on the study of selected phase equilibria at 300 °C. This was achieved by a combination of standard methods: overall and phase compositions of samples were measured using SEM-EDX, the temperature of phase transitions by DSC or DTA and the crystal structures were identified by XRD.
The following main results were obtained in the study:
-
The melting behavior of the θ-phase, which was uncertain owing to problems with modeling the liquidus curve in its vicinity by the CALPHAD approach, was confirmed to be peritectic in nature. A metastable congruent solidification of the θ-phase as proposed in Reference 11 was confirmed by microstructural analysis of the as-cast samples. The description of the liquidus curve in this region of the phase diagram was improved using slow-heating rates (1 °C min−1) in the DSC studies.
-
The temperature stability of the ζ-phase was reevaluated and was found to lie in the range 373 °C to 597 °C. The phase boundaries of the two-phase field γ′ + ε′ were experimentally defined.
-
The difficulties in defining the γ′/δ transition was addressed by a combined EDX/XRD investigation of more than ten samples that were annealed in the temperature range 500 °C to 750 °C. Although (similar to previous studies) it was not possible to determine the two-phase field between the γ′ and δ phases directly, the shape of the (γ′ + δ) two-phase field could be postulated from the XRD studies of quenched samples.
-
The temperature of the ordering reaction γ ↔ γ′, (β) was experimentally determined to be 779.6 °C.
All other parts of the Al-Cu phase diagram studied here were found to be in excellent agreement with the most recent previous descriptions.[1,5]
References
N. Ponweiser, C.L. Lengauer, K.W. Richter: Intermetallics, 2011, vol. 19, pp. 1737-1746.
J.L. Murray: Int Met Rev, 1985, vol. 30, pp. 211–234.
X.J. Liu, I. Ohnuma, R. Kainuma, K. Ishida: J Alloy Compd, 1998, vol. 264, pp. 201-208.
V.T. Witusiewicz, U. Hecht, S.G. Fries, S. Rex: J Alloy Compd, 2004, vol. 385, pp. 133–134.
S.M. Liang, R. Schmid-Fetzer: CALPHAD J, 2015, vol. 51, pp. 252–60.
E.A. Owen, G.D. Preston: Proc Phys Soc London, 1924, vol. 36, pp. 14-49.
J.B. Friauf: J Am Chem. Soc, 1927, vol. 49, pp. 3107-14.
E.E. Havinga: J. Less-Common Met, 1972, vol. 27, pp. 187-193.
C. Hisatsune: Mem. Coll. Eng., Kyoto Univ., 1934, vol. 8/2, pp. 74–91.
G.P. Kulbush: J Inst Met, 1930, vol 44, pp. 485.
T. Goedecke, F. Sommer: Z Metallkde, 1996, vol. 87, pp. 581-586.
M. El-Boragy, R. Szepan, K. Schubert: J Less-Common Met, 1972, vol. 29, pp. 133-140.
L.D. Gulay, B. Harbrecht: Z Anorg Allg Chem, 2003, vol. 629, 463-466.
L.D. Gulay, B. Harbrecht: J Alloy Compd, 2004, vol. 367, pp. 103-108.
A.J. Bradley, H.J. Goldschmidt, H. Lipson: J Inst Met, 1938, vol. 63, pp. 149-62.
Westman S.: Acta Chem Scand,1965, vol. 19, pp.2369-72.
S.K. Seshadri, D.B. Downie: Met Sci, 1979, vol. 13, pp. 696-8.
Y. Funamizu, K. Watanabe: Trans Jpn Inst Met, 1971, vol. 12, pp. 147-152.
M. Van Sande, J. Van Landuyt, M. Avalos-Borja, G.T. Villasenor, S. Amelinckx: Mater Sci Eng, 1980, vol. 46, pp. 197-173.
A.G. Dawsonn: J. Ins Met., 1937, vol. 61, pp. 197-204.
N. Kuwano, T. Doi, T. Eguchi: Trans JIM, 1977, vol. 18, 807-815.
J. Gröbner: G. Effenberg Binary evaluations, MSI, Materials Science International Serviced GmbH, Stuttgart, 2004.
A. Kroupa: Institute of Physics of Materials, CAS, Brno. Czech Republic, unpublished research, 2019.
P. Riani, L. Arrighi, R. Marazza, D. Mazzone, G. Zanicchi, R. Ferro: J Phase Equilib Diff, 2004, vol. 25, pp. 22-52.
V. N. Danilenko, S. N. Sergeev, J. A. Baimova, G. F. Korznikova, K. S. Nazarov, R. K. Khisamov, A. M. Glezer, R. R. Mulyukov: Mat Lett, 2019, vol. 236, pp. 51-55.
C.J. Li, R. Guo, S.Y. He, W.D. Xuan, X. Li, Y.B. Zhong, Z.M. Ren: J Alloy Compd, 2019, vol. 776, pp. 353-356.
Acknowledgments
Open access funding provided by University of Vienna. This study was supported by the Austrian Science Found (FWF) under the Lisa-Meitner Project M2293-N34. The authors thank Stephan Puchegger from the Department of Dynamic of Condensed Systems at the University of Vienna for the assistance with the SEM measurements.
Author information
Authors and Affiliations
Corresponding author
Additional information
Publisher's Note
Springer Nature remains neutral with regard to jurisdictional claims in published maps and institutional affiliations.
Manuscript submitted January 11, 2019.
Rights and permissions
Open Access This article is distributed under the terms of the Creative Commons Attribution 4.0 International License (http://creativecommons.org/licenses/by/4.0/), which permits unrestricted use, distribution, and reproduction in any medium, provided you give appropriate credit to the original author(s) and the source, provide a link to the Creative Commons license, and indicate if changes were made.
About this article

Cite this article
Zobac, O., Kroupa, A., Zemanova, A. et al. Experimental Description of the Al-Cu Binary Phase Diagram. Metall Mater Trans A 50, 3805–3815 (2019). https://doi.org/10.1007/s11661-019-05286-x
Received:
Published:
Issue Date:
DOI: https://doi.org/10.1007/s11661-019-05286-x