
Abstract
The visualization of information is a widely used tool to improve comprehension and, ultimately, decision-making in strategic management decisions as well as in a diverse array of other domains. Across social science research, many findings have supported this rationale. However, empirical results vary significantly in terms of the variables and mechanisms studied as well as their resulting conclusion. Despite the ubiquity of information visualization with modern software, there is little effort to create a comprehensive understanding of the powers and limitations of its use. The purpose of this article is therefore to review, systematize, and integrate extant research on the effects of information visualization on decision-making and to provide a future research agenda with a particular focus on the context of strategic management decisions. The study shows that information visualization can improve decision quality as well as speed, with more mixed effects on other variables, for instance, decision confidence. Several moderators such as user and task characteristics have been investigated as part of this interaction, along with cognitive aspects as mediating processes. The article presents integrative insights based on research spanning multiple domains across the social and information sciences and provides impulses for prospective applications in the realm of managerial decision-making.
Find the latest articles, discoveries, and news in related topics.Avoid common mistakes on your manuscript.
1 Introduction
A visualization is defined as a visual representation of information or concepts designed to effectively communicate the content or message (Padilla et al. 2018) and improve understanding in the audience (Alhadad 2018). This representation can manifest in a range of imagery, from quantitative graphs (Tang et al. 2014) to qualitative diagrams (Yildiz and Boehme 2017), to abstract visual metaphors (Eppler and Aeschimann 2009) or artistic imagery. Visualization design may also intend to promote a specific behavior in the audience (Correll and Gleicher 2014). The visualization of information is associated with effective communication in terms of clarity (Suwa and Tversky 2002), speed (Perdana et al. 2018), and the understanding of complex concepts (Wang et al. 2017). Research shows, for example, that visualized risk data require less cognitive effort in interpretation than textual alternatives and are therefore comprehended more easily (Smerecnik et al. 2010), and complex sentiment data visualized in a scatterplot improve the accuracy in law enforcement decisions compared to raw data (Cassenti et al. 2019).
Visual experiences are the dominant sensory input for cognitive reasoning in everyday life, business, and science (Gooding 2006). As Davis (1986) points out, image creation and perception are part of the “unique and quintessential competencies of homo sapiens sapiens”. Hence, the visualization of information is an integral research subject in the domains of cognitive psychology, education (Alfred and Kraemer 2017), management (Tang et al. 2014) including financial reporting, strategic management, and controlling, marketing (Hutchinson et al. 2010), as well as information science (Correll and Gleicher 2014).
Management researchers study visualizations from a business perspective. First, the field of financial reporting considers the effect of financial graphs on investor perception (Beattie and Jones 2008; Pennington and Tuttle 2009). Second, the potential consequences of visualizations on decision-making are examined in the area of managerial decision support, with a focus on judgments based on quantitative data such as financial decisions (Tang et al. 2014) and performance controlling (Ballard 2020). Finally, a small number of works investigate more complex decision-making based on qualitative, multivariate, and relational information (Platts and Tan 2004). Altogether visualizations fulfill a variety of functions, from focusing attention to sharing thoughts to identifying data structures, trends, and patterns (Platts and Tan 2004).
The vast majority of existing research in visualization, however, arises from the two domains of information science and cognitive psychology. Information science research on how to design visualizations for effective user cognition stretches back almost one century (Washburne 1927). While early research focuses on comparing tables and simple graphs, newer research on human–computer interfaces covers advanced data visualizations facilitated by computing power (Conati et al. 2014). For example, interactive visualization software enables users to manipulate data directly. While promising in terms of analytic capability, the potential for biases and overconfidence is suggested as a downside (Ajayi 2014). Equally, cognitive psychology research notes that visual information may be superior over verbal alternatives in certain cognitive tasks since they can be encoded in their original form, where spatial and relational data is preserved. Thereby, visual input is inherently richer than verbal and symbolic information, which is automatically reductionistic (Meyer 1991), but more suited for discrete information retrieval due to its simplicity (Vessey and Galletta 1991). However, the processes behind visual cognition remain largely unclear (Vila and Gomez 2016).
Despite the ubiquity of visualizations in research and practice, there is no comprehensive understanding of the potential and limits of information visualization for decision-making. Although at times converging, insights from research of different areas are seldom synthesized (Padilla et al. 2018), and there has been no effort for a systematic review or overarching framework (Zabukovec and Jaklič 2015). However, a synthesis of existing research is essential and timely due to three reasons. First, information visualization is ubiquitous both in the scientific and business community, yet there are conflicting findings on its powers and limits in support of judgment and decision-making. Second, cognitive psychology research provides several promising suggestions to explain observable effects of visualizations, yet these are rarely integrated into research in other domains, including strategic decision-making. Third, the barriers to using information visualization software have fallen to a minimum, making it available to a wide range of producers and users. This raises the issue of the validity of positive effects for various task and user configurations. The goal of this paper is therefore to provide an overview of the fragmented existing research on visualizations across the social and information sciences and generate insights and a timely research agenda for its applicability to strategic management decisions.
My study advances visualization research on three paths. First, I establish a framework to summarize the numerous effects and variable interactions surrounding the use of visualizations. Second, I conduct a systematic literature review across the social and information sciences and summarize and discuss this plethora of findings along with the aforementioned structure. Third, I utilize this work as a basis for identifying and debating gaps in existing research and resulting potential avenues for future research, with a focus on the area of strategic management decisions.
The structure of the article is as follows. The next chapter briefly describes the research field, followed by the methodology of my literature search. Next, I analyze the results of my search and discuss common insights. In the ensuing chapter, I develop an agenda for management research by building on particularly relevant ideas with conflicting or incomplete evidence. Finally, I conclude my review and discuss contributions and implications for practice.
2 Definition of the research field
2.1 Definition of key terms
Information visualizations support the exploration, judgment, and communication of ideas and messages (Yildiz and Boehme 2017). The term “graph” is often used as a synonym for information visualization in general (Meyer 1991) as well as describing quantitative data presentation specifically (Washburne 1927). As my review exhibits, these graphs constitute the prevalent form of information visualization. Common quantitative visualizations are line and bar charts, often showcasing a development over time and regularly used in financial reporting (Cardoso et al. 2018) and controlling (Hutchinson et al. 2010). In scientific literature, probabilistic charts such as scatterplots, boxplots, and probability distribution charts (Allen et al. 2014) frequently depict risk and uncertainty. More specialized charts include decision trees to depict conditional logic (Subramanian et al. 1992), radar charts to display complex multivariate information (Peebles 2008), or cluster charts and perceptual maps for marketing decision support (Cornelius et al. 2010).
Despite the breadth of existing visualization research, its application to strategic decisions is narrow and there is an abundance of research limited to elementary tasks and choices. To provide a clear distinction, I focus my search on decisions, judgments, and inferential reasoning as more advanced forms of cognitive processing. Decision-making can be broadly defined as choosing between several alternative courses of action (Padilla et al. 2018). On the other hand, reasoning and judgment refer to the evaluation of a set of alternatives (Reani et al. 2019), without actions necessarily being attached as for decision-making. Such efforts are cognitively demanding and complex when compared to more elementary tasks, such as a choice between options (Tuttle and Kershaw 1998), and include the rigorous evaluation of alternatives across a range of attributes, which is characteristic for strategic decisions (Bajracharya et al. 2014). For this reason, I include studies that examine the influence of visualizations on some form of decision or judgment outcome. Mason and Mitroff (1981) highlight that strategic decisions, in management and elsewhere, involve complex and ambiguous information environments. Information visualization may relate to decision quality in this context since one critical factor in the effectiveness of strategic decisions is the objective and comprehensive acquisition and analysis of relevant information to define and evaluate alternatives (Dean and Sharfman 1996).
2.2 Perspectives in literature
Visualization research exists within a range of domains in the social and information sciences, which reflects the diversity of the empirical application. I identify psychology (cognitive and educational), management (financial reporting, strategic management decisions, and controlling), marketing, and information science as the primary areas of research. This heterogeneity in terms of application area provides the first dimension in my literature review. Second, I classify existing studies along the type of variable interaction they primarily investigate. Based on the framework first introduced by DeSanctis (1984), I hereby differentiate four categories: Works principally focused on (1) the effects of visualizations on comprehension and decisions as dependent variables provide the basis of all research. This relationship is then investigated through: (2) User characteristics as moderators; (3) task and format characteristics as moderators; and (4) cognitive processing as mediator. An overview of this classification, including the prevalence of extant findings across domains, is given in Fig. 1.
Visualization research structured by domain and variables primarily investigated
First, the investigation of visualization effects on decisions and judgments is established across all research areas mentioned, and primarily studies outcome variables such as decision accuracy (Sen and Boe 1991), speed (Falschlunger et al. 2015a), and confidence (Correll and Gleicher 2014). While these studies contribute examples for graphs influencing observable decision effectiveness and efficiency across a range of contexts, they do not investigate moderating or mediating factors.
Second, psychology research pushes this investigation further towards including moderating effects of user characteristics, such as domain expertise and training (Hegarty 2013), and measures of cognitive ability such as numeracy (Honda et al. 2015) or literacy (Okan et al. 2018a). The relevance of these moderating factors is validated both in studies focusing on cognition as well as experiments in educational research, for example by providing evidence that the quality of a judgment made based on a graph may depend more on the user than the format itself (Mayer and Gallini 1990).
Similarly, human–computer interface research spearheads further insights into moderating factors of task and format characteristics, such as task type (Porat et al. 2009), task complexity (Meyer et al. 1997), data structure (Meyer et al. 1999), and the graphical saliency of features (Fabrikant et al. 2010) through rigorous user testing. At the same time, Vessey (1991) developed the theory of cognitive fit as a concept bridging cognitive and information systems research, stating that positive effects of graphs depend on a fit between task type and format type, differentiating between symbolic and spatial archetypes.
Finally, cognitive psychology research aims at explaining the observable effects of visualization in terms of mediating cognitive mechanisms. Here, cognitive load theory provides the foundation, stating that an individual’s working memory capacity is limited, and performance in a task or judgment depends on the cognitive load they experience while assessing information. According to this logic, cognitive load that is too high damages performance (Chandler and Sweller 1991). Reducing cognitive load by providing visualizations in complex environments is therefore often stated as a key goal of graph design (Smerecnik et al. 2010).
Importantly, the boundaries between these variable categories are fluid. Many studies investigate more than one relationship and the inclusion of moderating variables has become common. Various application areas covering these interdependencies attest to the heterogeneous nature of visualization research. However, previous reviews highlight that insights are seldom shared across fields and call for the integration of findings into new studies (Padilla et al. 2018). In particular, strategic management research does not yet follow such a holistic approach.
3 Method of literature search
3.1 Search design
The methodological basis of this paper is a systematic literature search as a means to collect and evaluate the existing findings in a systematic, transparent, and reproducible way on the specified topic (Fisch and Block 2018) in order to produce a more complete and objective knowledge presentation than in traditional reviews (Clark et al. 2021). I conduct a keyword search on the online search engines EBSCOhost and ProQuest, limited to English-language works that have been peer-reviewed, in order to ensure the quality of the sources. Gusenbauer and Haddaway (2020) identify both search engines as principal academic search systems as they fulfill all essential performance requirements for systematic reviews. On EBSCOhost, I use the databases Business Source Premier, Education Research Complete, EconLit, APA PsycInfo, APA PsycArticles, and OpenDissertations to search for empirical works; on ProQuest, I use the databases British Periodicals, International Bibliography of the Social Sciences (IBSS), Periodicals Archive Online, and Periodicals Index Online with a filter on articles to cover the social sciences comprehensively. The keyword used is the concatenated term “(visualization OR graph OR chart) AND (decision OR judgment OR reasoning)”, searched for in abstracts.Footnote 1 The terms were chosen as “visualization” is commonly used as a category name for visualized information (Brodlie et al. 2012), and the “graph” is the focus of traditional visualization research (Vessey 1991). The term “chart” is a synonym for both quantitative and qualitative graphs which has seen increasing use particularly in the 2000s (Semmler and Brewer 2002). The terms “judgment OR decision OR reasoning” were added to ensure that studies examining observable outcomes of visualization use, as opposed to cognitive processes such as comprehension only, were highlighted. After a review of the evolution of visualization research over time, I focus my search to articles published from the year 1990 in order to capture the recent advancements covering modern modes of information visualization.Footnote 2 This search results in 1658 articles combined, after removing duplicates 1505 articles remain.
Next, I review all article abstracts based on the three content criteria defined in the following. I include all articles rooted in the (1) social sciences or information sciences, where the focus of the study lies on (2) how a visualization per se or a variation within related visualizations affects a user's or audience's decision or judgment in a given task, and the topic is studied through (3) original empirical works. Most articles are excluded in this process and 116 studies remain due to the prevalence of graphs as auxiliary means, not the subject of research, in various domains, particularly in medical research. I repeat this exclusion process by reading the full texts of all articles and narrow down the selection further to 81 papers.
Building on this systematic search, I conducted a supplementary search through citation and reference tracking, as well as supplementary search engines, such as JSTOR (Gusenbauer and Haddaway 2020).Footnote 3 This includes gray literature such as conference proceedings or dissertations, which lie outside of traditional academic publishing. In addition, I limit the inclusion of gray literature to studies by researchers included in my systematic search and completed within the last 10 years in order to gather a comprehensive and up-to-date overview of the findings of working groups particularly relevant to visualization research. Thereby I identify 52 additional articles, resulting in a total of 133 articles included.
3.2 Limitations of search
Due to the plethora of existing literature mentioning the topic of visualization in various contexts and degrees of quality, I subject my search to well-defined limitations. First, I only include peer-reviewed articles in my systematic search. These are studies that have been thoroughly validated and represent the major theories within a field (Podsakoff et al. 2005). However, I incorporate gray literature of comparable quality as part of my additional exploratory search.
Second, I limit the search to information and social sciences to deliberately omit results from the broad areas of medicine and natural sciences. In these, various specific concepts are visualized as a means within research, yet not investigating the visualization itself. For the same reason, I only apply the search terms to article abstracts, since the terms “graph” and “chart” in particular will result in a high number of results when searched for in the full text, due to the common use of graphs in presenting concepts and results.
Third, I only include original empirical work in order to enable the synthesis and critical validation of empirical findings across research areas. At the same time, I acknowledge the existence of several highly relevant theoretical works, which inform my search design and structure while being excluded from the systematic literature search and analysis.
4 Results
4.1 Overview of results
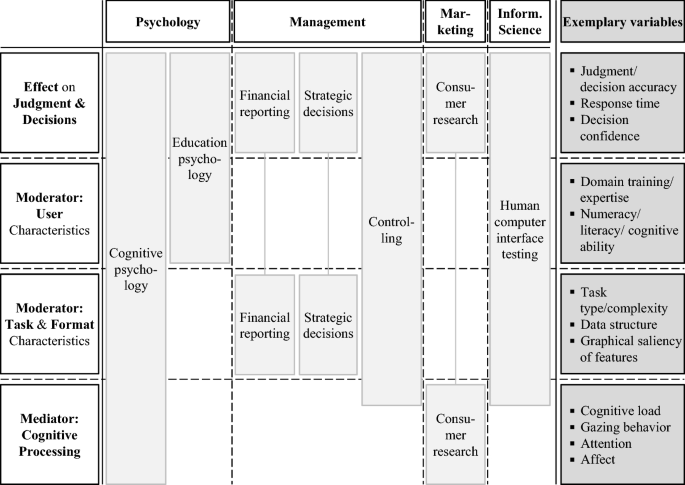
I identify a total of 133 articles, published between 1990 and 2020. Interest in visualization research gained initial momentum in the early 1990s (Fig. 2). More recently, the number of studies rises starting around 2008, with the continued publication of five to ten papers per year since and a visible peak in interest around 2014/15. A significant share of recent works stems from the information science literature, and the wealth of publications around 2014 coincides with the advent of mainstream interest in big data (Arunachalam et al. 2018), which is closely linked to information visualization for subsequent analysis and decision-making (Keahey 2013). In addition, a cluster of publications by one group of authors (Falschlunger et al. 2014, 2015a, c, b) in the financial reporting domain enhances the observed peak in publications, which is therefore not indicative of a larger trend. Instead, the continued wealth of publications in the last decade shows the contemporary relevance of and interest in visualization research.
Articles included in systematic search by publication year and area of research
Next to the information sciences, the largest share of the studies identified originates in cognitive psychology research. Furthermore, management literature discusses visualization and graphs continuously throughout the last three decades, with notable peaks in interest around the year 2000 in the domain of annual reporting (Beattie and Jones 2000, 2002a, b; Arunachalam et al. 2002; Amer 2005; Xu 2005) and internal management reporting with classic bar and line graphs around the year 2015 (Falschlunger et al. 2014, 2015a, c; Tang et al. 2014; Hirsch et al. 2015; Zabukovec and Jaklič 2015). Consumer research in marketing constitutes a further domain regularly discussing visualizations and their effect on decisions and judgment (Symmank 2019), albeit to a smaller extent. This heterogeneity in research areas is reflected by the journals identified in my search, where the 133 articles spread across 83 different journals, complemented by ten studies from conference proceedings and three papers included in doctoral dissertations (Table 1). Apart from the articles in conference proceedings added through the supplementary exploratory search, the studies were published in journals with a SCIMAGO Journal Rank indicator ranging from 0.253 (Informing Science) to 8.916 (Journal of Consumer Research). All but four journals received Q1 and Q2 ratings, which equals the top half of all SCImago rated journals. The h-index ranges from 6 (Journal of Education for Library and Information Science) to 332 (PLoS ONE) (Scimago Lab 2021).
In the 133 articles identified, experiments are by far the most common method for data collection, with 113 (85%) of studies conducting a total of 182 controlled experiments with over 28,000 participants (Fig. 3). In addition, I find seven instances of archival research covering over 600 companies, six instances of surveys with almost 1000 participants in total, four quasi experiments, two natural experiments, and one field experiment to complete the picture.
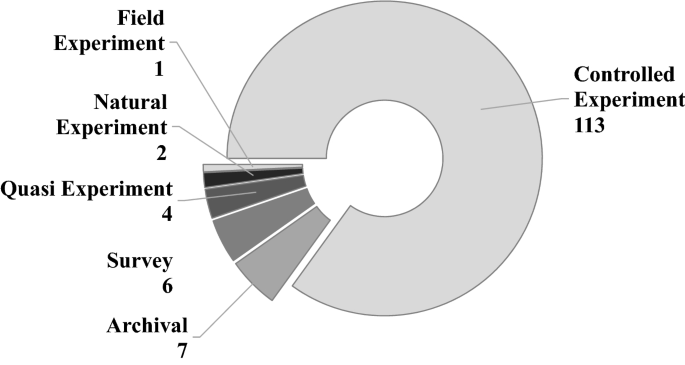
Articles included in systematic search by methodology
Of the 182 experiments conducted, the majority works with students as subjects (125 or 69%). The largest remaining share investigates a sample of the general (online) population (32 or 18%) and only 13% study the effect of visualization with practitioners in their respective domain (24). In contrast, four out of the six surveys were conducted with practitioners that were addressed explicitly. Besides, one survey each was conducted with students and subjects from the general population.
Following the advice by Fisch and Block (2018), I categorize the results from literature in a concept-centric manner, based on the primary variable interaction investigated. I further distinguish by the four application domains and seven subdomains discussed and present a structured overview at the end of each subchapter. The independent variable in all cases is the use of a visual representation designed for a specific use case, either as opposed to non-visual representation methods such as verbal descriptions [e.g. Vessey and Galletta (1991)], or traditional visualizations that the research aims to improve on [e.g. Dull and Tegarden (1999)].
4.2 Effects of visualizations on decisions and judgments
4.2.1 Judgment/decision accuracy
The most common dependent variable investigated in visualization research is the accuracy of the subjects on a given comprehension, judgment, or decision task. Most studies are in psychology research, with positive effects dominating. In cognitive psychology, experiments show that well-designed visualizations can improve problem comprehension (Chandler and Sweller 1991; Huang and Eades 2005; Nadav-Greenberg et al. 2008; Okan et al. 2018b). For example, Dong and Hayes (2012) show in their experiment with 22 practitioners that a decision support system visualizing uncertainty improves the identification and understanding of ambiguous decision situations. Likewise, visualizations improve decision (Pfaff et al. 2013) and judgment accuracy (Semmler and Brewer 2002; Tak et al. 2015; Wu et al. 2017) and improve the quality of inferences made from data (Sato et al. 2019). Findings in educational psychology support this claim. In teaching, visual materials improve understanding and retention (Dori and Belcher 2005; Brusilovsky et al. 2010; Binder et al. 2015; Chen et al. 2018) in students, and support the judgment accuracy of educators when analyzing learning progress quantitatively (Lefebre et al. 2008; Van Norman et al. 2013; Géryk 2017; Nelson et al. 2017). Furthermore, Yoon’s longitudinal classroom intervention (2011) using social network graphs enables students to make more reflected and information-driven strategic decisions. However, other studies arrive at more mixed or opposing findings. In their experiment, Rebotier et al. (2003) find that visual cues do not improve judgment accuracy over verbal cues in imagery processing. Other experiments even demonstrate verbal information to be superior over graphs in comprehension (Parrott et al. 2005) as well as judgment accuracy (Sanfey and Hastie 1998). Some graphs appear unsuitable for specific content, such as bar graphs depicting probabilities (Newman and Scholl 2012) and bubble charts encoding information in circle area size (Raidvee et al. 2020). In addition, more complex charts like boxplots, histograms (Lem et al. 2013), and tree charts (Bruckmaier et al. 2019) appear less effective for the accurate interpretation of statistical data in some experiments, presumably as they elicit errors and confusion in insufficiently trained students.
Studies in management and business research arrive at further, more pessimistic results. While Dull and Tegarden (1999) find in their experiment with students that three-dimensional visuals can improve the prediction accuracy in financial reporting contexts, and Yildiz and Boehme (2017) observe in their practitioner survey that a graphical model of a corporate security decision problem improves risk perception when compared to a textual description, most other studies present a less positive picture. Several studies do not find graphs superior over tables in financial judgments (Chan 2001; Tang et al. 2014; Volkov and Laing 2012), and in consumer research (Artacho-Ramírez et al. 2008). In financial reporting, a dedicated school of research investigates the effect of distorted graphs lowering financial judgment accuracy (Arunachalam et al. 2002; Beattie and Jones 2002a, b; Amer 2005; Xu 2005; Pennington and Tuttle 2009; Falschlunger et al. 2014), irrespective of whether the distortion is intended by the designer. Chandar et al. (2012) elaborate on the positive effect of the introduction of graphs and statistics in performance management for AT&T in the 1920s, but more recent case study examples are rare.
By contrast, several experimental studies from human–computer interaction research largely contribute evidence for a positive effect. Targeted visual designs lead to higher judgment accuracy in specific tasks (Subramanian et al. 1992; Butavicius and Lee 2007; Van der Linden et al. 2014; Perdana et al. 2018) and improve decision-making (Peng et al. 2019). For example, probabilistic gradient plots and violin plots enable higher accuracy in statistical inference judgments in the online experiment by Correll and Gleicher (2014) than traditional bar charts. However, experiments by Sen and Boe (1991) and Hutchinson et al. (2010) equally lack a significant effect on data-based decision-making quality. Amer and Ravindran (2010) find a potential for visual illusions degrading judgment accuracy similar to results from financial reporting, and McBride and Caldara (2013) find that visuals lower accuracy in law enforcement judgments when compared to raw data presentation (Table 2).
4.2.2 Response time
The next most common outcome variable investigated in visualization research is response time, often referred to as efficiency. Across the board, experimenters observe that information visualization lowers response time in various judgment and decision tasks. In psychology, this includes decision-making in complex information environments (Sun et al. 2016; Géryk 2017). The opposite effect emerges from only one study, where Pfaff et al. (2013) find that a decision support system visualizing complex uncertainty information requires a longer time to use than one omitting this graphical information. In management research, Falschlunger et al. (2015a) find that visually optimized financial reports can speed up judgment both for students and practitioners. Studies originating in information science validate this picture, observing that well-designed visualizations reduce response time in quantitative (Perdana et al. 2018) as well as geospatial judgment tasks (MacEachren 1992). Furthermore, McBride and Caldara (2013) observe that students in their experiments arrive at faster judgments when provided with a network graph as opposed to a table (Table 3).
4.2.3 Decision confidence
Next to these directly observable metrics, experimenters regularly elicit measures of decision confidence in visualization research based on subjects’ self-assessment. From a cognitive psychology perspective, Andrade (2011) finds that subjects display excessive confidence in estimates based on visualizations, which biases subsequent decision-making. On the other hand, Dong and Hayes (2012) show that a visual decision support system depicting uncertainty in engineering design leads to marginally lower decision confidence, compared to traditional methods omitting uncertainty information. In management research, Tang et al. (2014) present an increase in confidence in the context of financial decision-making, and Yildiz and Böhme (2017) find in their practitioner survey that an appealing visual increases decision confidence in a managerial setting without changing the actual decision outcome. Similarly, further experiments in information science provide evidence for increased confidence with a link to increased judgment accuracy (Butavicius and Lee 2007) or without (Sen and Boe 1991; Wesslen et al. 2019). In the context of uncertainty, Arshad et al. (2015) once again report novice subjects having lower confidence in the use of graphs with uncertainty visualized, however, this effect does not occur for practitioners (Table 4).
4.2.4 Prevalence of biases
Several studies investigate the prevalence of biases by searching for distinct patterns of deviations in judgment and decision accuracy with largely mixed results. Through a total of seven cognitive psychology experiments, Sun et al. (2010, 2016) and Radley et al. (2018) find that varying scale proportions in graphs change the resulting decision-making since data points are evaluated in a cognitively biased manner based on their distance to other chart elements. Furthermore, Padilla et al. (2015) demonstrate that uncertainty is understood to a disparate extent when it is encoded through spatial glyphs, color, or brightness. In human–computer interaction research, experiments observe similar framing biases through salient graphical features (Diamond and Lerch 1992) such as color schemes (Klockow-McClain et al. 2020). Lawrence and O’Connor (1993) also show that graph scaling affects judgment and relate this to the anchoring heuristic. Finally, financial reporting research extensively dedicates its field of impression management on the observation that such biases are prevalent and possibly intended in annual report graphics, including through distorted graph axes (Falschlunger et al. 2015b) and an intentional selection of information to visualize (Beattie and Jones 1992, 2000; Dilla and Janvrin 2010; Jones 2011; Cho et al. 2012a, b). Two further experiments compare the prevalence of cognitive biases with graphs compared to text directly and find no difference for the recency bias in financial reporting (Hellmann et al. 2017) as well as for other heuristics in data-based managerial decision-making (Hutchinson et al. 2010) (Table 5).
4.2.5 Attitude change and willingness to act
Observations on attitude change and the willingness to act on information constitute the final category of outcome variables found in visualization research. Cognitive psychology research observes an effect of visualizations on risk attitude, where salient graphs can either enhance risk aversion (Dambacher et al. 2016) or risk-seeking (Okan et al. 2018b), depending on the information that is highlighted most saliently. Similarly, varied financial graphs change investors’ risk perception and subsequent investment recommendations (Diacon and Hasseldine 2007). In the area of performance management, the visualization of KPIs motivates managers’ intention to act on the information when compared to text (Ballard 2020). Consumer research investigates such phenomena commonly, where brand attitude and the intention to purchase a product represent specific cases of judgment and decision-making. Miniard et al. (1991) were among the first to show that different pictures can result in different attitudes, while Gkiouzepas and Hogg (2011) extend this investigation to visual metaphors. Finally, information science research provides further insights. King Jr et al. (1991) find that visualizations are more persuasive in attitude change than text, and Perdana et al. (2018) increase student subjects’ willingness to invest in their experimental setting through visualization software. On the other hand, Phillips et al. (2014) find their subjects to be less willing to seek out additional information in ambiguous decision settings (Table 6).
4.3 User characteristics as moderating variables
4.3.1 Expertise and training
Common moderating variables investigated both in psychological and information science research are the users’ expertise or training experience in a given domain. Experimenters widely encounter a positive impact of experience on the influence of visualizations on judgment accuracy and efficiency. In cognitive psychology, Hilton et al. (2017) find that graphs of statistical risk improve decision quality for more experienced practitioners alone. On the other hand, some results from educational psychology point towards the opposite effect of experience. Mayer and Gallini (1990) find in their student experiments that learners with higher pre-test performance benefit less from visual aids than learners on a lower level. In the information sciences, Conati et al. (2014) find in their testing of computer interfaces that experience with visualizations leads to a pronounced advantage in judgment accuracy. Training sessions (Raschke and Steinbart 2008) and experience through task repetition (Meyer 2000) enhance the positive effects of graphs (Table 7).
4.3.2 Cognitive ability
Another user characteristic regularly investigated in the social sciences is the measurement of cognitive ability. In psychology studies, Honda et al. (2015) and Cardoso et al. (2018) find that reflective ability determines in part how well subjects translate visualizations into accurate judgments. Visual working memory (Tintarev and Masthoff 2016) and numeracy (Honda et al. 2015) are further traits related to cognitive ability in dealing with visualizations and found to enhance the benefits of visualizations on judgment effectiveness and efficiency. The only study presenting contrary results consists of three experiments by Okan et al. (2018a), where subjects with higher graph literacy are more prone to specific biases when shown bar graphs of health risk data, and thereby make less accurate judgments. On the other hand, experiments in financial reporting (Cardoso et al. 2018) confirm the positive effect of the reflective ability. Conati and Maclaren (2008) and Conati et al. (2014) extend this idea to perceptual speed in the area of consumer research (Table 8).
4.3.3 User preferences
Finally, experimenters investigate user preferences at times. In the adjacent field of musical education, for example, Korenman and Peynircioglu (2007) demonstrate that the visual presentation of learning material is only helpful to students with the respective learning style. In cognitive psychology, Daron et al. (2015) observe a variation in user preferences when presented with visualization options, however without a significant effect on decision performance. This result is replicated in an online survey on human–computer interaction by Lorenz et al. (2015). O’Keefe and Pitt (1991) operationalize cognitive style from the MBTI framework and find a weak association with the subjects’ reported preferences for text or specific chart types. However, no relation to actual judgment accuracy or efficiency is found (Table 9).
4.4 Task and format characteristics as moderating variables
4.4.1 Task type
One common task characteristic identified as a moderating variable is the task type, originally defined in the information sciences. In her seminal theoretical paper, Vessey (1991) identifies spatial and symbolic tasks as the two archetypes, which correspond to spatial and symbolic types of cognitive processing and spatial (graphical) and symbolic (textual/numerical) representations. She hypothesizes that visualizations improve judgment effectiveness where these three manifestations align, which she defines as cognitive fit and validates through experiments (Vessey and Galletta 1991), including in the sphere of multiattribute management decisions (Umanath and Vessey 1994). Further research in information science widely supports this moderating effect by comparing tables and standard quantitative graphs in judgment tasks of increasing complexity (Coll et al. 1994; Tuttle and Kershaw 1998; Speier 2006; Porat et al. 2009). On the other hand, experiments in managerial forecasting (Carey and White 1991) and financial reporting (Hirsch et al. 2015) present the effectiveness of graphical displays in spatial decisions, based on cognitive fit theory. Fischer et al. (2005) provide further evidence from the domain of cognitive psychology, showing that bar graphs support spatial-numerical judgments particularly well when the chart orientation equals the cognitive processing by following a left-to-right direction (Table 10).
4.4.2 Level of data structure
I identify two other task characteristics investigated in the literature, albeit infrequently. First, the level of data structure has been investigated only once in the information science domain. Meyer et al. (1999) find line charts superior over tables in judgment tasks when the underlying data is structured, with the opposite effect for unstructured data (Table 11).
4.4.3 Task complexity
Second, two further experiments observe task complexity as a moderating effect. Meyer et al. (1997) demonstrate that the speed advantage they find for tables over bar graphs in their computer interface tasks becomes more pronounced with increasing task complexity. However, the same effect does not occur for line graphs. On the other hand, Falschlunger et al. (2015c) find task complexity to be the main factor in predicting task efficiency and effectiveness in handling financial reports but do not observe interaction effects with the visualization (Table 12).
4.4.4 Graphical saliency of relevant data
Finally, various studies investigate modifications in the graph format as a variable, with a focus on the graphical saliency of relevant data. This area of research is bridging the two domains of cognitive psychology and information science with widely overlapping results. For example, Verovszek et al. (2013) observe in their information science experiment that colored visualizations are less effective in supporting laypeople’s judgments on urban planning than simple black-and-white line drawings since colorful, irrelevant features distract from the core information. Van den Berg et al. (2007) identify color as a more powerful feature to highlight salient information in graphs than other variables, such as size. Spence et al. (1999) find that variations in brightness lead to faster response times in comparison tasks than variations in color. Breslow et al (2009) demonstrate that the moderating effect of the use of color on judgment speed depends on the task type, with multicolored visuals ideal for identification tasks and black-and-white brightness scales preferable for comparison tasks. Finally, MacEachran et al. (2012) find colorless suited to represent uncertainty when compared to features such as fuzziness or transparency in their surveys with students and practitioners.
Next to color, three-dimensional depth cues have received attention in research. Several psychology experiments find that three-dimensional depth cues irrelevant to the information visualized lower judgment accuracy (Zacks et al. 1998; Edwards et al. 2012) as well as speed (Fischer 2000). Negative effects occur equally for other irrelevant visual cues lowering the saliency of actually relevant information (Fischer 2000). Further studies show that increasing the saliency of relevant features can enhance the tendency to make compensatory choices (Dilla and Steinbart 2005) and shorten response time (Fabrikant et al. 2010), while visual clutter decreases judgment accuracy and boosts response times (Ognjanovic et al. 2019). Several other studies test the suitability of a specific set of graphs for unique judgment areas such as uncertainty simulation in urban development (Aerts et al. 2003), risk communication (Stone et al. 2017; Stone et al. 2018), and performance management (Peebles 2008) (Table 13).
4.5 Cognitive aspects as mediating variables
4.5.1 Cognitive load
Cognitive psychology research introduces the idea of cognitive processes mediating the influence of visualizations on judgment performance, with a focus on cognitive load. Jolicœur and Dell’Acqua (1999) show in their experiment that the perception of visualizations is subject to structural constraints in working memory capacity, and Allen et al. (2014) manipulate cognitive load as a dependent variable to demonstrate that judgment accuracy and speed using visualizations decrease under higher cognitive load. Subsequently, psychology experiments provide evidence that visualizations improve decision performance by reducing cognitive load as a mediating factor, operationalized and measured either through pupil size and dilation (Smerecnik et al. 2010; Toker and Conati 2017) or self-reported load (Cassenti et al. 2019). In management research, Ajayi (2014) investigates this relationship in the context of a proprietary visualization tool for financial data but finds no effect of the visualization component on cognitive load or judgment accuracy. Two further experiments in human–computer interface research operationalize cognitive load based on subjective reporting (Anderson et al. 2011) and performance in a secondary task (Block 2013) and demonstrate that cognitive load mediates the relationship between visualization use and judgment accuracy and speed, with some types of graphics better suited than others (Table 14).
4.5.2 Gazing behavior
Another concept frequently operationalized to represent working memory capacity is gazing behavior, which more recent experiments observe through the use of eye-tracking technology, pioneered by the information sciences. Reani et al. (2019) observe in their experiment with 49 students that gazing behavior is associated with judgment accuracy, where subjects that pay more attention to relevant visual areas deliver more accurate answers. Similarly, Lohse (1997) finds that in the more complex decision environment of a budget allocation simulation, decision accuracy is related to efficient gazing behavior and can be improved through the use of colors to reduce the time subjects spend looking at the chart legend. Psychology experiments validate that well-designed graphs enable subjects to focus their attention on relevant information and subsequently improve decision accuracy (Huestegge and Pötzsch 2018) and response time (Vila and Gomez 2016) (Table 15).
4.5.3 Attention
Another variable operationalized at times in eye-tracking experiments is attention, which is elicited through metrics such as the average gazing duration on a specific visual element (Pieters et al. 2010). In their cognitive psychology experiment, Smerecnik et al. (2010) observe that graphs attract more attention in risk communication compared to tables and text and are associated with more accurate judgments. Applying this idea to consumer research, Pieters et al. (2010) study the consumer’s attention towards visual advertisements and observe that visual complexity based on features such as decorative color can hurt attention, while well-structured complexity such as arrangements of relevant information enhances attention and the attitude toward the brand (Table 16).
4.5.4 Affect
Finally, some research emerges into the potential mediating role of affect. Harrison (2013) shows in her large-scale online experiment that affective priming can significantly influence judgment accuracy in tasks supported visually and that the graphs themselves can cause a change in affect valence. Similarly, Plass et al. (2014) demonstrate in their educational research that color and shape in visualizations can evoke positive affect and are associated with better student learning (Table 17).
5 Discussion
In this paper, I have presented a systematic and integrative review of the current state of research on the effect of information visualization in the social and information sciences. I structured and summarized the results of my systematic literature review along the type of variable interactions present in experimental research. In order to discuss and synthesize the variety of literature insights, I categorize them into three groups: Descriptions of the positive effects for visualizations within decision-making, elaborations on moderators of this potential, and insights into negative effects of misguided visualization use. Table 18 highlights this categorization of results by application domain.
5.1 Positive Effect 1: Information visualization improves decision accuracy and quality
Research findings overwhelmingly confirm the hypothesis that visualizations enable the user to comprehend information more effectively, subsequently improving performance in judgments and decisions. The reason behind this effect is most commonly attributed to cognitive mechanisms. Suwa and Tversky (2002) point out that based on cognitive load theory, less working memory is needed when visuals provide external representations of concepts, which one can easily refer back to and thereby need not keep in mind, leading to improved judgments. Allen et al. (2014) show in their experiment that under externally induced cognitive load, well-designed charts suffer less than cluttered ones. Furthermore, graphs enable a simpler gazing pattern than text, which can be used as an indicator of cognitive effort (Smerecnik et al. 2010). Based on the concept of cognitive load reduction, visualizations are effectively used in various application areas including management research (Falschlunger et al. 2014) and more specifically managerial decision-making (Yildiz and Boehme 2017), next to psychology and information sciences more broadly.
5.2 Positive Effect 2: Information visualization steers attention towards uncertainty
A large share of studies identified points towards the strength of visualizations in enhancing uncertainty and risk features in a data set. Beyond increasing the awareness of uncertainty (Dong and Hayes 2012), the question of whether visualizations can also improve the reasoning with probabilistic information is studied extensively. Various studies show that visualizations can reduce typical comprehension issues, resulting in the more accurate use of probabilities from a statistical perspective (Allen et al. 2014; Wu et al. 2017; Stone et al. 2018). Positive effects in risk understanding are evaluated particularly in the contexts of safety, such as food safety (Honda et al. 2015) and violence risk (Hilton et al. 2017). Studies investigating the cognitive processes more closely provide evidence that simpler charts indeed perform best (Edwards et al. 2012) since they can reduce cognitive load (Anderson et al. 2011) and ultimately improve the internal processing of probabilistic models (Tak et al. 2015). As Quattrone (2017) points out, ambiguity and uncertainty are inherent in managerial decision-making and should be embraced by information visualization, but research on this insight in management is scarce.
5.3 Positive Effect 3: Information Visualization Speeds Up Cognitive Processing
There is evidence that graphs lead to faster processing, learning, and decision-making (Block 2013), as judgment and decision efficiency are measured and operationalized as the response time in various experiments. Utilizing eye-tracking technology, Reani et al. (2019) point out that different types of graphs result in varying gazing patterns in users and hypothesize a link to the reasoning processes. Based on the principle of saliency, multiple studies show that graphs optimally designed to focus attention on the most relevant information lead to more efficient and thereby faster gazing (Falschlunger et al. 2014, 2015a), since more time can be spent focusing on highly relevant information (Vila and Gomez 2016). Much of this existing work stems from the area of management reporting, investigating quantitative financial data. Overall, the evidence for visual aids speeding up cognitive processing and decision-making appears robust and applicable to management research.
5.4 Moderator 1: The effects of visualization depend on cognitive fit within the decision context
Cognitive fit is a moderator in the effectiveness of visualizations that has been well validated across psychological, management, and information science. Introducing cognitive fit theory, Vessey (1991) explains many existing research findings in the graph versus table literature claiming that graphs are not (always) more effective, most notably by DeSanctis (1984). Cognitive fit theory is validated widely (Vessey and Galletta 1991; Carey and White 1991; Coll et al. 1994; Meyer et al. 1997; Meyer 2000; Porat et al. 2009; Perdana et al. 2019). Padilla (2018) recognizes that this well-documented effect arises because a cognitive mismatch between data, task, and approach (format) requires more working memory, which negatively affects cognitive processing effectiveness and efficiency. Though highly reliable, many studies investigate elementary processing tasks with limited external validity for more complex decision-making in practice. Umanath and Vessey (1994) and others (Tuttle and Kershaw 1998; Hirsch et al. 2015) extend the original cognitive fit theory and successfully apply it to multi-attribute judgments—though at a potential time-accuracy tradeoff. Finally, the idea of matching task and format complexity can be seen as an extension to cognitive fit theory, where graphs are only helpful when they represent as much data complexity as necessary to complete the respective task, but as little as possible (Pieters et al. 2010; Van der Linden et al. 2014; Géryk 2017).
5.5 Moderator 2: Differences within users can be more relevant than the visualization design
Task complexity in relation to user ability needs to be strictly controlled for as a moderator of positive visualization effects. Early studies including individual differences hypothesize that graph potential may be limited to users with a high level of ability (Subramanian et al. 1992). Other studies claim that the positive effects of visualizations may be more significant for (McIntire et al. 2014) or even limited to (Mayer and Gallini 1990) less-skilled individuals. However, these seemingly conflicting results can be explained by the idea that since graphs are effective by requiring less working memory than other formats, improvements are only visible where working memory capacity is limited and needed elsewhere (Lohse 1997).
Furthermore, the majority of studies including user factors emphasize the importance of training and expertise, as opposed to inherent ability. Various studies support the claim that experience significantly enhances the contribution of visuals (Porat et al. 2009; Edwards et al. 2012; Falschlunger et al. 2015a; Ognjanovic et al. 2019), with some claiming that training constitutes a requirement (Géryk 2017; Hilton et al. 2017) or that users without training are subject to stronger biases (Raschke and Steinbart 2008). Consequently, the training factor needs to be closely monitored particularly for a novel or complex visualization. However, extensive training of users is frequently time-consuming and costly. Therefore, the imperative arises for interactive visualization interfaces to accommodate for varying user needs in demanding decision situations. Interactive data visualization software is shown to improve investment decisions (Perdana et al. 2018) and judgments by reducing cognitive load (Ajayi 2014), for example with flexible performance management dashboards that reduce information load while hosting a full set of KPIs (Yigitbasioglu and Velcu 2012). Contrary to much of the early research on static visualizations, the progress in interactivity studies has been driven by practice and case studies, with calls for science to follow suit (Marchak 1994; McInerny et al. 2014). Overall, I conclude that a match in ability and training with format complexity and novelty, respectively, is a significant determinant of the effectiveness of visualizations. However, there has been little to no empirical research on the subject in the domain of management.
5.6 Negative Effect 1: Visualizations May Not Always Be Helpful: Risk to Impair Decision Making by Misguiding Attention
Several studies, including in management research, argue that visualizations misguide attention even in the presence of cognitive and user fit. For example, Hutchinson (2010) finds graphs to be as exposed to cognitive biases as tables in data-based managerial decision-making. Similarly, other studies identify graphical representations as equally or less effective than verbal formats in financial reports (Volkov and Laing 2012), forecasting (Chan 2001), probabilistic comprehension (Parrott et al. 2005), evidence evaluation (Sanfey and Hastie 1998), and communication (Rose 1966). The common denominator in these studies is the suboptimal use of salient visual elements, leading to distraction. For example, overly realistic visualizations encompassing color and higher complexity (DeSanctis 1984), may lead to visual clutter that decreases performance (Alhadad 2018). As Padilla et al. (2018) argue, visualizations are powerful because they attract fast cognitive bottom-up processing. However, when this superficial processing is focused on irrelevant elements, decision quality can suffer. A well-studied example of this effect is the addition of superfluous three-dimensional cues to quantitative graphs, which lowers accuracy in using the graph (Zacks et al. 1998; Fischer 2000).
5.7 Negative Effect 2: Visualizations can increase decision-maker overconfidence
The most documented cognitive bias in my review is overconfidence, which can be aggravated by the use of visualizations (O’Keefe and Pitt 1991). Multiple studies demonstrate that graph use can increase decision confidence without enhancing decision quality to the same extent in the context of management and finance (Tang et al. 2014; Yildiz and Boehme 2017; Wesslen et al. 2019). This may result from the perception that visualizations show more information at once (Miettinen 2014), thereby seemingly requiring less search for additional information (Phillips et al. 2014). In particular, this can be the case when graphs appear to visually simplify a problem and the decision-maker fails to adjust his confidence to the underlying complexity (Sen and Boe 1991). There is some research with inconclusive results (Pfaff et al. 2013), showing no difference in confidence (Hirsch et al. 2015) or even lowered confidence (Dong and Hayes 2012; Arshad et al. 2015). However, the majority of these studies deal with uncertainty communication, which is inherently tied to a decrease in confidence (Watkins 2000). Overall, the evidence demonstrates that unless highlighting uncertainty, visual aids result in higher decision confidence. The case of overconfidence is particularly well established in the area of management controlling and financial reporting but understudied for strategic decisions.
6 Research agenda
In summary, there is ample evidence for the potential of information visualization to improve decision-making in terms of effectiveness and efficiency, yet my review highlights possible limitations and risks where its use is misguided or inappropriate. I argue that several of these are particularly critical for further research since there is little to no application to the domain of strategic management decisions, despite the ubiquity of visualizations to support these in practice. Based on the summary of my insights by application domain in Table 18, I identify five research gaps in the field of strategic management decisions.
First, there is conflicting evidence regarding the effect of information visualization on decision-making under uncertainty, and existing research is mostly limited to information science (Aerts et al. 2003). Depending on the context and design, visualization use can increase or reduce risk-taking (Dambacher et al. 2016) but has the potential to improve probabilistic reasoning in an objective manner (Allen et al. 2014). Given the importance of uncertainty as a defining factor of strategic management decisions (Quattrone 2017), the possibility of information visualizations to improve risk understanding in the management context deserves closer evaluation. For example, the framing bias is a well-documented phenomenon in strategic decision-making (Hodgkinson et al. 1999), leading to different subjective risk interpretations and subsequent decisions based on the presentation of information. Naturally, the question arises whether information visualization can mitigate this bias and which salient visual features are beneficial. I suggest exploring this question through experiments with strategic management decision vignettes.
-
Research Gap 1: How can information visualization mitigate the framing bias and improve risk understanding in strategic management decisions?
Second, my review has made clear that the effectiveness of information visualization depends in large parts on user characteristics such as expertise (Hilton et al. 2017), numeracy (Honda et al. 2015), and graph literacy (Okan et al. 2018b), yet there exists no transfer of this insight towards individual managerial traits. At the same time, well-established concepts such as the Upper Echelons Theory (Hambrick 2007) highlight the relevance of CEO characteristics, both observable and psychological for strategic managerial choices and, subsequently, company performance. While some concepts such as experience may be transferrable from existing visualization research (Falschlunger et al. 2015c) requiring validation only, others, such as group position or individual values, present opportunities to extend theory substantially. I suggest exploring this area through a dedicated analysis of relevant CEO characteristics and corresponding empirical research with practitioner subjects.
-
Research Gap 2: How do CEO characteristics influence the effectiveness of information visualization in strategic management decisions?
Third, while the prevalence of visualization use for impression management in financial reporting is well-established (Falschlunger et al. 2015b), there is a complete lack of transfer of this phenomenon to the realm of strategic management decisions. As Whittington et al. (2016) highlight, strategy presentations can be seen as an effective tool for CEO impression management. Given the popularity of visualizations in this communication medium – both through quantitative charts and schematic diagrams (Zelazny 2001), the question arises to what degree impression management also takes place in this case, for example through the reporting bias (Beattie and Jones 2000). I suggest investigating this subject empirically, for example through archival studies.
-
Research Gap 3: To what extent does CEO impression management occur through visualization use in strategy presentations?
Fourth, while overconfidence in managerial decision-making is a commonly reported issue with significant efforts to develop corrective feedback as a remedy (Chen et al. 2015), there is little understanding of the role of information visualization in this matter. My review has demonstrated that visual aids often increase decision confidence as much as they improve the judgment itself (Yildiz and Boehme 2017) or even more (Sen and Boe 1991), but can also reduce confidence, particularly where uncertainty information is depicted (Dong and Hayes 2012). However, the latter effect was only studied for topics unrelated to management. Therefore, there is a complete lack of understanding of the effects of visualizations on managerial overconfidence, and I suggest exploring this research gap empirically with practitioners.
-
Research Gap 4: How do visual aids influence overconfidence in managerial decision-making?
Finally, a large share of cognitive psychology research discusses the effectiveness of visualization use through the reduction of cognitive load, yet they usually start off with low-load contexts, which is the opposite of high-stress managerial decision-making (Laamanen et al. 2018). Allen et al. (2014) find evidence that the effectiveness of distinct graph types changes with the level of externally induced cognitive load, raising the question to what extent previous insights on helpful visual aids are applicable to managerial decisions in a high-stakes environment filled with distractions and parallel issues requiring attention. Therefore, I suggest studying visualization use in experimental environments with varying levels of cognitive load as the independent variable, ideally with management practitioners and a realistic strategic task setting.
-
Research Gap 5: How does cognitive load influence the effectiveness of information visualization in strategic management decisions?
7 Conclusion
Information visualization has become ubiquitous in our daily professional and private lives, even more so with the advent of accessible and powerful computer graphics. However, the impact that visualizations have on human cognition and ultimately decisions stills remains unclear to a large extent. While the prevalence of visualization research across a plethora of application domains shows its pertinence, the decentralized approach has led to a scattered and unstructured field of theories and empirical evidence. My literature review thus sought to provide a far-reaching overview of this work and a detailed research agenda. As a result, three contributions arise from my review.
First, I provide an overarching structure to summarize the range of effects and interacting variables that can be found surrounding visualization research. This includes a wide set of dependent variables ranging from decision quality and speed to confidence and attitudes, as well as complex moderating and mediating effects that are crucial to understanding the overall power of visualizations. This precise framework is paramount to a holistic and comprehensive review of the scattered existing literature.
Second, to the best of my knowledge, my systematic literature review is the first on visualizations spanning the whole of social and information sciences simultaneously. While some previous reviews such as the one by Yigitbasioglu and Velcu (2012) utilize a multidisciplinary approach, they usually define the visualization type investigated more narrowly, for example by focusing on dashboards only. I believe that my integrative overview provides a valid contribution to the ongoing work to synthesize the mixed results in visualization research.
Third, I demonstrate that despite the plethora of evidence at first sight, visualization research is far from complete due to its multitude of moderating variables and at times conflicting results. Building on my systematic review of existing literature, I specify an agenda of potential research directions for future studies to follow in order to advance our understanding of the cognitive implications of visualizations in the context of managerial decision making in particular.
This paper also has direct implications for management practice. As Zhang (1998) points out, managerial decision-making is particularly well-positioned to profit from good visualizations since it often utilizes unstructured, large sets of information that are computer-centered, dynamic, and need to be interpreted constantly under time pressure. However, the interaction of visualization use with various factors should not be underestimated in the design of computer graphics for decision support. The high validity of the cognitive fit theory and the contingency on user characteristics found in the literature demonstrates that the designer should spend extensive time on clarifying for whom and what the visualization is intended. Furthermore, the potential for overconfidence and automatic processing based on visualized information may result in decision-makers skipping on more elaborate thought, which may be desirable in some, but certainly not all situations.
Availability of data and material
Not applicable.
Code availability
Not applicable.
Notes
Thanks to the anonymous reviewer for encouraging me to extend my keyword search.
Thanks to the anonymous reviewer for this valuable impulse.
Thanks to the anonymous reviewer for pointing me towards additional, highly relevant articles.
References
Aerts JC, Clarke KC, Keuper AD (2003) Testing popular visualization techniques for representing model uncertainty. Cartogr Geogr Inf Sci 30:249–261. https://doi.org/10.1559/152304003100011180
Ajayi O (2014) Interactive data visualization in accounting contexts: impact on user attitudes, information processing, and decision outcomes. University of Central Florida
Alfred KL, Kraemer DJ (2017) Verbal and visual cognition: Individual differences in the lab, in the brain, and in the classroom. Dev Neuropsychol 42:507–520. https://doi.org/10.1080/87565641.2017.1401075
Alhadad SSJ (2018) Visualizing data to support judgement, inference, and decision making in learning analytics: insights from cognitive psychology and visualization science. J Learn Anal 5:60–85. https://doi.org/10.18608/jla.2018.52.5
Allen PM, Edwards JA, Snyder FJ et al (2014) The effect of cognitive load on decision making with graphically displayed uncertainty information. Risk Anal 34:1495–1505. https://doi.org/10.1111/risa.12161
Amer TS (2005) Bias due to visual illusion in the graphical presentation of accounting information. J Inf Syst 19:1–18. https://doi.org/10.2308/jis.2005.19.1.1
Amer TS, Ravindran S (2010) The effect of visual illusions on the graphical display of information. J Inf Syst 24:23–42. https://doi.org/10.2308/jis.2010.24.1.23
Anderson EW, Potter KC, Matzen LE et al (2011) A user study of visualization effectiveness using EEG and cognitive load. Comput Graph Forum 30:791–800. https://doi.org/10.1111/j.1467-8659.2011.01928.x
Andrade EB (2011) Excessive confidence in visually-based estimates. Organ Behav Hum Decis Process 116:252–261. https://doi.org/10.1016/j.obhdp.2011.07.002
Arshad SZ, Zhou J, Bridon C et al (2015) Investigating user confidence for uncertainty presentation in predictive decision making. In: Proceedings of the annual meeting of the Australian special interest group for computer human interaction, pp 352–360
Artacho-Ramírez MA, Diego-Mas JA, Alcaide-Marzal J (2008) Influence of the mode of graphical representation on the perception of product aesthetic and emotional features: an exploratory study. Int J Ind Ergon 38:942–952. https://doi.org/10.1016/j.ergon.2008.02.020
Arunachalam V, Pei BKW, Steinbart PJ (2002) Impression management with graphs: effects on choices. J Inf Syst 16:183–202. https://doi.org/10.2308/jis.2002.16.2.183
Arunachalam D, Kumar N, Kawalek JP (2018) Understanding big data analytics capabilities in supply chain management: Unravelling the issues, challenges and implications for practice. Transp Res Part E Logist Transp Rev 114:416–436. https://doi.org/10.1016/j.tre.2017.04.001
Bajracharya S, Carenini G, Chen K et al (2014) Interactive visualization for group decision analysis. Int J Inf Technol Decis Mak 17:1839–1864. https://doi.org/10.1142/s0219622018500384
Ballard A (2020) Promoting performance information use through data visualization: evidence from an experiment. Public Perform Manag Rev 43:109–128. https://doi.org/10.1080/15309576.2019.1592763
Beattie V, Jones MJ (1992) The use and abuse of graphs in annual reports: theoretical framework and empirical study. Account Bus Res 22:291–303
Beattie VA, Jones MJ (2000) Changing graph use in corporate annual reports: a time-series analysis. Contemp Account Res 17:213–226. https://doi.org/10.1506/aat8-3cgl-3j94-ph4f
Beattie V, Jones MJ (2002a) Measurement distortion of graphs in corporate reports: an experimental study. Account Audit Account J. https://doi.org/10.1108/09513570210440595
Beattie V, Jones MJ (2002b) The impact of graph slope on rate of change judgments in corporate reports. Abacus 38:177–199. https://doi.org/10.1111/1467-6281.00104
Beattie V, Jones M (2008) Corporate reporting using graphs: a review and synthesis. J Account Lit 27:71–110
Binder K, Krauss S, Bruckmaier G (2015) Effects of visualizing statistical information—an empirical study on tree diagrams and 2 × 2 tables. Front Psychol. https://doi.org/10.3389/fpsyg.2015.01186
Block G (2013) Reducing cognitive load using adaptive uncertainty visualization. Nova Southeastern University
Breslow LA, Trafton JG, Ratwani RM (2009) A perceptual process approach to selecting color scales for complex visualizations. J Exp Psychol Appl 15:25–34. https://doi.org/10.1037/a0015085
Brodlie K, Osorio RA, Lopes A (2012) A review of uncertainty in data visualization. In: Expanding the frontiers of visual analytics and visualization. Springer, pp 81–109
Bruckmaier G, Binder K, Krauss S, Kufner H-M (2019) An eye-tracking study of statistical reasoning with tree diagrams and 2 × 2 tables. Front Psychol. https://doi.org/10.3389/fpsyg.2019.00632
Brusilovsky P, Ahn J, Rasmussen E (2010) Teaching Information Retrieval With Web-based Interactive Visualization. J Educ Libr Inf Sci 51:187–200
Butavicius MA, Lee MD (2007) An empirical evaluation of four data visualization techniques for displaying short news text similarities. Int J Hum-Comput Stud 65:931–944. https://doi.org/10.1016/j.ijhcs.2007.07.001
Cardoso RL, de Leite R, O, Aquino ACB de, (2018) The effect of cognitive reflection on the efficacy of impression management. Account Audit Account J 31:1668–1690. https://doi.org/10.1108/aaaj-10-2016-2731
Carey JM, White EM (1991) The effects of graphical versus numerical response on the accuracy of graph-based forecasts. J Manag 17:77. https://doi.org/10.1177/014920639101700106
Cassenti DN, Roy H, Kase SE (2019) Cognitive processing of visually presented data in decision making. Hum Factors 61:78–89. https://doi.org/10.1177/0018720818796009
Chan SY (2001) The use of graphs as decision aids in relation to information overload and managerial decision quality. J Inf Sci 27:417. https://doi.org/10.1177/016555150102700607
Chandar N, Collier D, Miranti P (2012) Graph standardization and management accounting at AT&T during the 1920s. Account Hist 17:35–62. https://doi.org/10.1177/1032373211424889
Chandler P, Sweller J (1991) Cognitive load theory and the format of instruction. Cogn Instr 8:293–332. https://doi.org/10.1207/s1532690xci0804_2
Chen G, Crossland C, Luo S (2015) Making the same mistake all over again: CEO overconfidence and corporate resistance to corrective feedback. Strateg Manag J 36:1513–1535. https://doi.org/10.1002/smj.2291
Chen J, Wang M, Grotzer TA, Dede C (2018) Using a three-dimensional thinking graph to support inquiry learning. J Res Sci Teach 55:1239–1263. https://doi.org/10.1002/tea.21450
Cho CH, Michelon G, Patten DM (2012a) Impression management in sustainability reports: an empirical investigation of the use of graphs. Account Public Interest 12:16–37
Cho CH, Michelon G, Patten DM (2012b) Enhancement and obfuscation through the use of graphs in sustainability reports. Sustain Account Manag Policy J 3:74–88. https://doi.org/10.1108/20408021211223561
Clark WR, Clark LA, Raffo DM, Williams RI (2021) Extending Fisch and Block’s (2018) tips for a systematic review in management and business literature. Manag Rev Q 71:215–231. https://doi.org/10.1007/s11301-020-00184-8
Coll RA, Coll JH, Thakur G (1994) Graphs and tables: a four-factor experiment. Commun ACM 37:77–86. https://doi.org/10.1145/175276.175283
Conati C, Carenini G, Hoque E et al (2014) Evaluating the impact of user characteristics and different layouts on an interactive visualization for decision making. Comput Graph Forum 33:371–380. https://doi.org/10.1111/cgf.12393
Conati C, Maclaren H (2008) Exploring the role of individual differences in information visualization, pp 199–206
Cornelius B, Wagner U, Natter M (2010) Managerial applicability of graphical formats to support positioning decisions. J Für Betriebswirtschaft 60:167–201. https://doi.org/10.1007/s11301-010-0061-y
Correll M, Gleicher M (2014) Error bars considered harmful: exploring alternate encodings for mean and error. IEEE Trans vis Comput Graph 20:2142–2151. https://doi.org/10.1109/tvcg.2014.2346298
Dambacher M, Haffke P, Groß D, Hübner R (2016) Graphs versus numbers: how information format affects risk aversion in gambling. Judgm Decis Mak 11:223–242
Daron JD, Lorenz S, Wolski P et al (2015) Interpreting climate data visualisations to inform adaptation decisions. Clim Risk Manag 10:17–26. https://doi.org/10.1016/j.crm.2015.06.007
Davis W (1986) The origins of image making. Curr Anthropol 27:193–215. https://doi.org/10.1086/203422
Dean JW, Sharfman MP (1996) Does decision process matter? A study of strategic decision-making effectiveness. Acad Manage J 39:368–392. https://doi.org/10.5465/256784
DeSanctis G (1984) Computer graphics as decision aids: directions for research. Decis Sci 15:463–487. https://doi.org/10.1111/j.1540-5915.1984.tb01236.x
Diacon S, Hasseldine J (2007) Framing effects and risk perception: the effect of prior performance presentation format on investment fund choice. J Econ Psychol 28:31–52
Diamond L, Lerch FJ (1992) Fading frames: data presentation and framing effects. Decis Sci 23:1050–1071. https://doi.org/10.1111/j.1540-5915.1992.tb00435.x
Dilla WN, Janvrin DJ (2010) Voluntary disclosure in annual reports: the association between magnitude and direction of change in corporate financial performance and graph use. Account Horiz 24:257–278. https://doi.org/10.2308/acch.2010.24.2.257
Dilla WN, Steinbart PJ (2005) Using information display characteristics to provide decision guidance in a choice task under conditions of strict uncertainty. J Inf Syst 19:29–55. https://doi.org/10.2308/jis.2005.19.2.29
Dong X, Hayes CC (2012) Uncertainty visualizations: helping decision makers become more aware of uncertainty and its implications. J Cogn Eng Decis Mak 6:30–56. https://doi.org/10.1177/1555343411432338
Dori YJ, Belcher J (2005) How does technology-enabled active learning affect undergraduate students’ understanding of electromagnetism concepts? J Learn Sci 14:243–279. https://doi.org/10.1207/s15327809jls1402_3
Dull RB, Tegarden DP (1999) A comparison of three visual representations of complex multidimensional accounting information. J Inf Syst 13:117. https://doi.org/10.2308/jis.1999.13.2.117
Edwards JA, Snyder FJ, Allen PM et al (2012) Decision making for risk management: a comparison of graphical methods for presenting quantitative uncertainty. Risk Anal Int J 32:2055–2070. https://doi.org/10.1111/j.1539-6924.2012.01839.x
Eppler MJ, Aeschimann M (2009) A systematic framework for risk visualization in risk management and communication. Risk Manage 11:67–89. https://doi.org/10.1057/rm.2009.4
Fabrikant SI, Hespanha SR, Hegarty M (2010) Cognitively inspired and perceptually salient graphic displays for efficient spatial inference making. Ann Assoc Am Geogr 100:13–29. https://doi.org/10.1080/00045600903362378
Falschlunger L, Eisl C, Losbichler H, Greil A (eds) (2014) Improving information perception of graphical displays – an experimental study on the display of column graphs. In: Proceedings from the 22th international conference in central europe on computer graphics, visualization and computer vision. Vaclav Skala - Union Agency
Falschlunger L, Eisl C, Losbichler H, Grabmann E (eds) (2015a) Report optimization using visual search strategies - an experimental study with eye tracking technology. In: 6th international conference on information visualization theory and applications
Falschlunger L, Eisl C, Losbichler H, Greil AM (2015b) Impression management in annual reports of the largest European companies. J Appl Account Res 16:383–399. https://doi.org/10.1108/jaar-10-2014-0109
Falschlunger L, Grabmann E et al (eds) (2015c) Deriving a holistic cognitive fit model for an optimal visualization of data for management decisions. Seville, Spain
Fisch C, Block J (2018) Six tips for your (systematic) literature review in business and management research. Manag Rev Q 68:103–106. https://doi.org/10.1007/s11301-018-0142-x
Fischer MH (2000) Do irrelevant depth cues affect the comprehension of bar graphs? Appl Cogn Psychol 14:151–162. https://doi.org/10.1002/(SICI)1099-0720(200003/04)14:2%3c151::AID-ACP629%3e3.0.CO;2-Z
Fischer MH, Dewulf N, Hill RL (2005) Designing bar graphs: orientation matters. Appl Cogn Psychol 19:953–962. https://doi.org/10.1002/acp.1105
Géryk J (2017) Visual analytics of educational time-dependent data using interactive dynamic visualization. Expert Syst Int J Knowl Eng Neural Netw. https://doi.org/10.1111/exsy.12175
Gkiouzepas L, Hogg MK (2011) Articulating a new framework for visual metaphors in advertising: a structural, conceptual, and pragmatic investigation. J Advert 40:103–120. https://doi.org/10.2753/joa0091-3367400107
Gooding DC (2006) Visual cognition: where cognition and culture meet. Philos Sci 73:688–698. https://doi.org/10.1086/518523
Gusenbauer M, Haddaway NR (2020) Which academic search systems are suitable for systematic reviews or meta-analyses? Evaluating retrieval qualities of Google Scholar, PubMed, and 26 other resources. Res Synth Methods 11:181–217. https://doi.org/10.1002/jrsm.1378
Hambrick DC (2007) Upper echelons theory: an update. Academy of Management Briarcliff Manor, NY, p 10510
Harrison L (2013) The role of emotion in visualization. Doctoral thesis, University of North Carolinab
Hegarty M (2013) Cognition, metacognition, and the design of maps. Curr Dir Psychol Sci 22:3–9. https://doi.org/10.1177/0963721412469395
Hellmann A, Yeow C, De Mello L (2017) The influence of textual presentation order and graphical presentation on the judgements of non-professional investors. Account Bus Res 47:455–470. https://doi.org/10.1080/00014788.2016.1271737
Hilton NZ, Ham E, Nunes KL et al (2017) Using graphs to improve violence risk communication. Crim Justice Behav 44:678–694. https://doi.org/10.1177/0093854816668916
Hirsch B, Seubert A, Sohn M (2015) Visualisation of data in management accounting reports. J Appl Account Res. https://doi.org/10.1108/jaar-08-2012-0059
Hodgkinson GP, Bown NJ, Maule AJ et al (1999) Breaking the frame: an analysis of strategic cognition and decision making under uncertainty. Strateg Manag J 20:977–985. https://doi.org/10.1002/(SICI)1097-0266(199910)20:10%3c977::AID-SMJ58%3e3.0.CO;2-X
Honda H, Ogawa M, Murakoshi T et al (2015) Effect of visual aids and individual differences of cognitive traits in judgments on food safety. Food Policy 55:33. https://doi.org/10.1016/j.foodpol.2015.05.010
Huang W, Eades P (2005) How people read graphs. Australian Computer Society Inc, London, pp 51–58
Huestegge L, Pötzsch TH (2018) Integration processes during frequency graph comprehension: performance and eye movements while processing tree maps versus pie charts. Appl Cogn Psychol 32:200–216. https://doi.org/10.1002/acp.3396
Hutchinson JW, Alba JW, Eisenstein EM (2010) Heuristics and biases in data-based decision making: effects of experience, training, and graphical data displays. J Mark Res 47:627–642. https://doi.org/10.1509/jmkr.47.4.627
Jolicœur P, Dell’Acqua R (1999) Attentional and structural constraints on visual encoding. Psychol Res 62:154–164. https://doi.org/10.1007/s004260050048
Jones MJ (2011) The nature, use and impression management of graphs in social and environmental accounting. Account Forum 35:75–89. https://doi.org/10.1016/j.accfor.2011.03.002
Keahey TA (2013) Using visualization to understand big data. IBM Soft Bus Anal Adv Visu
King WC Jr, Dent MM, Miles EW (1991) The persuasive effect of graphics in computer-mediated communication. Comput Hum Behav 7:269–279. https://doi.org/10.1016/0747-5632(91)90015-s
Klockow-McClain KE, McPherson RA, Thomas RP (2020) Cartographic design for improved decision making: trade-offs in uncertainty visualization for Tornado threats. Ann Am Assoc Geogr 110:314–333. https://doi.org/10.1080/24694452.2019.1602467
Korenman LM, Peynircioglu ZF (2007) Individual differences in learning and remembering music: auditory versus visual presentation. J Res Music Educ 55:48–64. https://doi.org/10.1177/002242940705500105
Laamanen T, Maula M, Kajanto M, Kunnas P (2018) The role of cognitive load in effective strategic issue management. Long Range Plann 51:625–639. https://doi.org/10.1016/j.lrp.2017.03.001
Scimago Lab (2021) SJR : scientific journal rankings. In: SJR Sci. J. Rank. https://www.scimagojr.com/journalrank.php. Accessed 11 Jun 2021
Lawrence M, O’Connor M (1993) Scale, variability, and the calibration of judgmental prediction intervals. Organ Behav Hum Decis Process 56:441. https://doi.org/10.1006/obhd.1993.1063
Lefebre E, Fabrizio M, Merbitz C (2008) Accuracy and efficiency of data interpretation: a comparison of data display methods. J Precis Teach Celeration 24:2–20
Lem S, Onghena P, Verschaffel L, Van Dooren W (2013) On the misinterpretation of histograms and box plots. Educ Psychol 33:155–174. https://doi.org/10.1080/01443410.2012.674006
Lohse GL (1997) The role of working memory on graphical information processing. Behav Inf Technol 16:297–308. https://doi.org/10.1080/014492997119707
Lorenz S, Dessai S, Forster PM, Paavola J (2015) Tailoring the visual communication of climate projections for local adaptation practitioners in Germany and the UK. Philos Trans Math Phys Eng Sci 373:1–17. https://doi.org/10.1098/rsta.2014.0457
MacEachren AM (1992) Application of environmental learning theory to spatial knowledge acquisition from maps. Ann Assoc Am Geogr 82:245–274. https://doi.org/10.1111/j.1467-8306.1992.tb01907.x
MacEachren AM, Roth RE, O’Brien J et al (2012) Visual semiotics and uncertainty visualization: an empirical study. IEEE Trans vis Comput Graph 18:2496–2505. https://doi.org/10.1109/tvcg.2012.279
Marchak FM (1994) An overview of scientific visualization techniques applied to experimental psychology. Behav Res Methods Instrum Comput 26:177–180. https://doi.org/10.3758/BF03204613
Mason RO, Mitroff II (1981) Challenging strategic planning assumptions: theory, cases, and techniques. Wiley
Mayer RE, Gallini JK (1990) When is an illustration worth ten thousand words? J Educ Psychol 82:715. https://doi.org/10.1037/0022-0663.82.4.715
Mcbride M, Caldara M (2013) The efficacy of tables versus graphs in disrupting dark networks: an experimental study. Soc Netw 35:406–422. https://doi.org/10.1016/j.socnet.2013.04.008
McInerny GJ, Chen M, Freeman R et al (2014) Information visualisation for science and policy: engaging users and avoiding bias. Trends Ecol Evol 29:148–157. https://doi.org/10.1016/j.tree.2014.01.003
McIntire JP, Havig PR, Geiselman EE (2014) Stereoscopic 3D displays and human performance: a comprehensive review. Displays 35:18–26. https://doi.org/10.1016/j.displa.2013.10.004
Meyer AD (1991) Visual data in organizational research. Organ Sci 2:218–236. https://doi.org/10.1287/orsc.2.2.218
Meyer J (2000) Performance with tables and graphs: effects of training and a visual search model. Ergonomics 43:1840–1865. https://doi.org/10.1080/00140130050174509
Meyer J, Shinar D, Leiser D (1997) Multiple factors that determine performance with tables and graphs. Hum Factors 39:268–286. https://doi.org/10.1518/001872097778543921
Meyer J, Shamo MK, Gopher D (1999) Information structure and the relative efficacy of tables and graphs. Hum Factors 41:570–587. https://doi.org/10.1518/001872099779656707
Miettinen K (2014) Survey of methods to visualize alternatives in multiple criteria decision making problems. Spectr 36:3–37. https://doi.org/10.1007/s00291-012-0297-0
Miniard PW, Bhatla S, Lord KR et al (1991) Picture-based persuasion processes and the moderating role of involvement. J Consum Res 18:92–107. https://doi.org/10.1086/209244
Nadav-Greenberg L, Joslyn SL, Taing MU (2008) The effect of uncertainty visualizations on decision making in weather forecasting. J Cogn Eng Decis Mak 2:24–47. https://doi.org/10.1518/155534308X284354
Nelson PM, Van Norman ER, Christ TJ (2017) Visual analysis among novices: training and trend lines as graphic aids. Contemp Sch Psychol 21:93–102. https://doi.org/10.1007/s40688-016-0107-9
Newman GE, Scholl BJ (2012) Bar graphs depicting averages are perceptually misinterpreted: the within-the-bar bias. Psychon Bull Rev 19:601–607. https://doi.org/10.3758/s13423-012-0247-5
O’Keefe RM, Pitt IL (1991) Interaction with a visual interactive simulation, and the effect of cognitive style. Eur J Oper Res 54:339–348. https://doi.org/10.1016/0377-2217(91)90109-9
Ognjanovic S, Thüring M, Murphy RO, Hölscher C (2019) Display clutter and its effects on visual attention distribution and financial risk judgment. Appl Ergon 80:168–174. https://doi.org/10.1016/j.apergo.2019.05.008
Okan Y, Garcia-Retamero R, Cokely ET, Maldonado A (2018a) Biasing and debiasing health decisions with bar graphs: costs and benefits of graph literacy. Q J Exp Psychol 71:2506–2519. https://doi.org/10.1177/1747021817744546
Okan Y, Stone ER, Bruine W, de Bruin, (2018b) Designing graphs that promote both risk understanding and behavior change. Risk Anal 38:929–946. https://doi.org/10.1111/risa.12895
Padilla LM, Hansen G, Ruginski IT et al (2015) The influence of different graphical displays on nonexpert decision making under uncertainty. J Exp Psychol Appl 21:37–46. https://doi.org/10.1037/xap0000037
Padilla LM, Creem-Regehr SH, Hegarty M, Stefanucci JK (2018) Decision making with visualizations: a cognitive framework across disciplines. Cogn Res Princ Implic. https://doi.org/10.1186/s41235-018-0120-9
Parrott R, Silk K, Dorgan K et al (2005) Risk comprehension and judgments of statistical evidentiary appeals: When a picture is not worth a thousand words. Hum Commun Res 31:423–452. https://doi.org/10.1093/hcr/31.3.423
Peebles D (2008) The effect of emergent features on judgments of quantity in configural and separable displays. J Exp Psychol Appl 14:85–100. https://doi.org/10.1037/1076-898x.14.2.85
Peng C-H, Lurie NH, Slaughter SA (2019) Using technology to persuade: visual representation technologies and consensus seeking in virtual teams. Inf Syst Res 30:948–962. https://doi.org/10.1287/isre.2019.0843
Pennington R, Tuttle B (2009) Managing impressions using distorted graphs of income and earnings per share: the role of memory. Int J Account Inf Syst 10:25–45. https://doi.org/10.1016/j.accinf.2008.10.001
Perdana A, Robb A, Rohde F (2018) Does visualization matter? The role of interactive data visualization to make sense of information. Australas J Inf Syst 22:1–35. https://doi.org/10.3127/ajis.v22i0.1681
Perdana A, Robb A, Rohde F (2019) Interactive data and information visualization: unpacking its characteristics and influencing aspects on decision-making. Pac Asia J Assoc Inf Syst 11:75–104. https://doi.org/10.17705/1pais.11404
Pfaff MS, Klein GL, Drury JL et al (2013) Supporting complex decision making through option awareness. J Cogn Eng Decis Mak 7:155–178. https://doi.org/10.1177/1555343412455799
Phillips B, Prybutok VR, Peak DA (2014) Decision confidence, information usefulness, and information seeking intention in the presence of disconfirming information. Inform Sci Int J Emerg Transdiscipl 17:1–25. https://doi.org/10.28945/1932
Pieters R, Wedel M, Batra R (2010) The stopping power of advertising: measures and effects of visual complexity. J Mark 74:48–60. https://doi.org/10.1509/jmkg.74.5.48
Plass JL, Heidig S, Hayward EO et al (2014) Emotional design in multimedia learning: effects of shape and color on affect and learning. Learn Instrum 29:128–140. https://doi.org/10.1016/j.learninstruc.2013.02.006
Platts K, Tan KH (2004) Strategy visualisation: knowing, understanding, and formulating. Manag Decis 42:667–676. https://doi.org/10.1108/00251740410538505
Podsakoff PM, MacKenzie SB, Bachrach DG, Podsakoff NP (2005) The influence of management journals in the 1980s and 1990s. Strateg Manag J 26:473–488. https://doi.org/10.1002/smj.454
Porat T, Oron-Gilad T, Meyer J (2009) Task-dependent processing of tables and graphs. Behav Inf Technol 28:293–307. https://doi.org/10.1080/01449290701803516
Quattrone P (2017) Embracing ambiguity in management controls and decision-making processes: on how to design data visualisations to prompt wise judgement. Account Bus Res 47:588–612. https://doi.org/10.1080/00014788.2017.1320842
Radley KC, Dart EH, Wright SJ (2018) The effect of data points per x- to y-axis ratio on visual analysts evaluation of single-case graphs. Sch Psychol Q 33:314–322. https://doi.org/10.1037/spq0000243
Raidvee A, Toom M, Averin K, Allik J (2020) Perception of means, sums, and areas. Atten Percept Psychophys. https://doi.org/10.3758/s13414-019-01938-7
Raschke RL, Steinbart PJ (2008) Mitigating the effects of misleading graphs on decisions by educating users about the principles of graph design. J Inf Syst 22:23–52. https://doi.org/10.2308/jis.2008.22.2.23
Reani M, Peek N, Jay C (2019) How different visualizations affect human reasoning about uncertainty: an analysis of visual behaviour. Comput Hum Behav 92:55–64. https://doi.org/10.1016/j.chb.2018.10.033
Rebotier TP, Kirsh DJ, McDonough L (2003) Image-Dependent Interaction of Imagery and Vision. Am J Psychol 116:343–366. https://doi.org/10.2307/1423498
Rose ED (1966) Image, sound, and meaning. J Univ Film Prod Assoc 18:21–23
Sanfey A, Hastie R (1998) Does evidence presentation format affect judgment? An experimental evaluation of displays of data for judgments. Psychol Sci 9:99–103. https://doi.org/10.1111/1467-9280.00018
Sato Y, Stapleton G, Jamnik M, Shams Z (2019) Human inference beyond syllogisms: an approach using external graphical representations. Cogn Process 20:103–115. https://doi.org/10.1007/s10339-018-0877-2
Semmler C, Brewer N (2002) Using a flow-chart to improve comprehension of jury instructions. Psychiatry Psychol Law 9:262–267. https://doi.org/10.1375/13218710260612136
Sen T, Boe WJ (1991) Confidence and accuracy in judgements using computer displayed information. Behav Inf Technol 10:53–64. https://doi.org/10.1080/01449299108924271
Smerecnik CMR, Mesters I, Kessels LTE et al (2010) Understanding the positive effects of graphical risk information on comprehension: Measuring attention directed to written, tabular, and graphical risk information. Risk Anal 30:1387–1398. https://doi.org/10.1111/j.1539-6924.2010.01435.x
Speier C (2006) The influence of information presentation formats on complex task decision-making performance. Int J Hum-Comput Stud 64:1115–1131. https://doi.org/10.1016/j.ijhcs.2006.06.007
Spence I, Kutlesa N, Rose DL (1999) Using color to code quantity in spatial displays. J Exp Psychol Appl 5:393–412. https://doi.org/10.1037/1076-898X.5.4.393
Stone ER (2018) Link to external site this link will open in a new window, Reeder EC, et al. salience versus proportional reasoning: rethinking the mechanism behind graphical display effects. J Behav Decis Mak 31:473–486. https://doi.org/10.1002/bdm.2051
Stone ER, Bruin W, Wilkins AM et al (2017) Designing graphs to communicate risks: understanding how the choice of graphical format influences decision making. Risk Anal 37:612–628. https://doi.org/10.1111/risa.12660
Subramanian GH, Nosek J, Rahunathan SP, Kanitkar SS (1992) A comparison of the decision table and tree. Commun ACM 35:89–94. https://doi.org/10.1145/129617.129621
Sun Y, Li S, Bonini N (2010) Attribute salience in graphical representations affects evaluation. Judgm Decis Mak 5:151–158
Sun Y, Li S, Bonini N, Liu Y (2016) Effect of graph scale on risky choice: evidence from preference and process in decision-making. PLoS ONE. https://doi.org/10.1371/journal.pone.0146914
Suwa M, Tversky B (2002) External representations contribute to the dynamic construction of ideas. Springer, pp 341–343
Symmank C (2019) Extrinsic and intrinsic food product attributes in consumer and sensory research: literature review and quantification of the findings. Manag Rev Q 69:39–74. https://doi.org/10.1007/s11301-018-0146-6
Tak S, Toet A, van Erp J (2015) Public understanding of visual representations of uncertainty in temperature forecasts. J Cogn Eng Decis Mak 9:241–262. https://doi.org/10.1177/1555343415591275
Tang F, Hess TJ, Valacich JS, Sweeney JT (2014) The Effects of visualization and interactivity on calibration in financial decision-making. Behav Res Account 26:25–58. https://doi.org/10.2308/bria-50589
Tintarev N, Masthoff J (2016) Effects of individual differences in working memory on plan presentational choices. Front Psychol 7:1793. https://doi.org/10.3389/fpsyg.2016.01793
Toker D, Conati C (eds) (2017) Leveraging pupil dilation measures for understanding users’ cognitive load during visualization processing, pp 267–270
Tuttle BM, Kershaw R (1998) Information presentation and judgment strategy from a cognitive fit perspective. J Inf Syst 12:1
Umanath NS, Vessey I (1994) Multiattribute data presentation and human judgment: a cognitive fit perspective. Decis Sci 25:795–824. https://doi.org/10.1111/j.1540-5915.1994.tb01870.x
van den Berg R, Cornelissen FW, Roerdink JBTM (2007) Perceptual dependencies in information visualization assessed by complex visual search. ACM Trans Appl Percept. https://doi.org/10.1145/1278760.1278763
Van der Linden SL, Leiserowitz AA, Feinberg GD, Maibach EW (2014) How to communicate the scientific consensus on climate change: plain facts, pie charts or metaphors? Clim Change 126:255–262. https://doi.org/10.1007/s10584-014-1190-4
Van Norman ER, Nelson PM, Shin J-E, Christ TJ (2013) An evaluation of the effects of graphic aids in improving decision accuracy in a continuous treatment design. J Behav Educ 22:283–301. https://doi.org/10.1007/s10864-013-9176-2
Verovsek Š, Juvancic M, Zupancic T (2013) Using visual language to represent interdisciplinary content in urban development. Urbani Izziv 24:144–155. https://doi.org/10.5379/urbani-izziv-en-2013-24-02-006
Vessey I (1991) Cognitive fit: a theory-based analysis of the graphs versus tables literature. Decis Sci 22:219–240. https://doi.org/10.1111/j.1540-5915.1991.tb00344.x
Vessey I, Galletta D (1991) Cognitive fit: An empirical study of information acquisition. Inf Syst Res 2:63–84. https://doi.org/10.1287/isre.2.1.63
Vila J, Gomez Y (2016) Extracting business information from graphs: an eye tracking experiment. J Bus Res 69:1741. https://doi.org/10.1016/j.jbusres.2015.10.048
Volkov A, Laing GK (2012) Assessing the value of graphical presentations in financial reports. Australas Account Bus Finance J 6:85–107
Wang D, Guo D, Zhang H (eds) (2017) Spatial temporal data visualization in emergency management: a view from data-driven decision. Rolando Beach, CA, USA, pp 1–7
Washburne JN (1927) An experimental study of various graphic, tabular, and textual methods of presenting quantitative material. J Educ Psychol 18:361. https://doi.org/10.1037/h0070054
Watkins ET (2000) Improving the analyst and decision-maker’s perspective through uncertainty visualization. Master’s thesis, Air Force Institute of Technology, Wright-Patterson AFB, Ohio
Wesslen R, Santhanam S, Karduni A et al (2019) Investigating effects of visual anchors on decision-making about misinformation. Comput Graph Forum 38:161–171. https://doi.org/10.1111/cgf.13679
Whittington R, Yakis-Douglas B, Ahn K (2016) Cheap talk? Strategy presentations as a form of chief executive officer impression management. Strateg Manag J 37:2413–2424. https://doi.org/10.1002/smj.2482
Wu CM, Meder B, Filimon F, Nelson JD (2017) Asking better questions: How presentation formats influence information search. J Exp Psychol Learn Mem Cogn 43:1274–1297. https://doi.org/10.1037/xlm0000374
Xu Y (2005) The effect of graphic disclosures on users’ perceptions: an experiment. J Account Finance Res 13:39–50
Yigitbasioglu OM, Velcu O (2012) A review of dashboards in performance management: Implications for design and research. Int J Account Inf Syst 13:41–59. https://doi.org/10.1016/j.accinf.2011.08.002
Yildiz E, Boehme R (eds) (2017) Effects of information security risk visualization on managerial decision making. Internet Society, Paris, France
Yoon SA (2011) Using social network graphs as visualization tools to influence peer selection decision-making strategies to access information about complex socioscientific issues. J Learn Sci 20:549–588. https://doi.org/10.1080/10508406.2011.563655
Zabukovec A, Jaklič J (2015) The impact of information visualisation on the quality of information in business decision-making. Int J Technol Hum Interact IJTHI 11:61–79. https://doi.org/10.4018/ijthi.2015040104
Zacks J, Levy E, Tversky B, Schiano DJ (1998) Reading bar graphs: effects of extraneous depth cues and graphical context. J Exp Psychol Appl 4:119–138. https://doi.org/10.1037/1076-898X.4.2.119
Zelazny G (2001) Say it with charts: the executive’s guide to visual communication. McGraw-Hill Education
Zhang P (1998) An image construction method for visualizing managerial data. Decis Support Syst 23:371. https://doi.org/10.1016/s0167-9236(98)00050-5
Funding
Open Access funding enabled and organized by Projekt DEAL.
Author information
Authors and Affiliations
Corresponding author
Ethics declarations
Conflict of interest
The author declares that there is no conflict of interest.
Additional information
Publisher's Note
Springer Nature remains neutral with regard to jurisdictional claims in published maps and institutional affiliations.
Rights and permissions
Open Access This article is licensed under a Creative Commons Attribution 4.0 International License, which permits use, sharing, adaptation, distribution and reproduction in any medium or format, as long as you give appropriate credit to the original author(s) and the source, provide a link to the Creative Commons licence, and indicate if changes were made. The images or other third party material in this article are included in the article's Creative Commons licence, unless indicated otherwise in a credit line to the material. If material is not included in the article's Creative Commons licence and your intended use is not permitted by statutory regulation or exceeds the permitted use, you will need to obtain permission directly from the copyright holder. To view a copy of this licence, visit http://creativecommons.org/licenses/by/4.0/.
About this article

Cite this article
Eberhard, K. The effects of visualization on judgment and decision-making: a systematic literature review. Manag Rev Q 73, 167–214 (2023). https://doi.org/10.1007/s11301-021-00235-8
Received:
Accepted:
Published:
Issue Date:
DOI: https://doi.org/10.1007/s11301-021-00235-8
Keywords
- Information visualization
- Strategic decision-making
- Decision quality
- Cognitive load
- User characteristics
- Task characteristics