
Abstract
A validation of recent theoretical results on the stability effects of asynchronous parametric excitation is presented. In particular, the coexistence of both resonance and anti-resonance at each combination resonance frequency is to be confirmed on a close-to-experiment simulation model. The simulation model reproduces the experimental setup developed by Schmieg in 1976, remaining the only experimental study on asynchronous excitation to this day. The model consists of two oscillating electronic circuits with feedback-free coupling through parametric excitation. In contrast to a mechanical system, the phase relations of the parametric excitation terms in an electronic system can be easily adjusted. The implementation of the simulation model is performed in the electronic circuit simulation software LTspice. The electronic model itself is first validated against the experimental results obtained by Schmieg and is then used to confirm the theoretical findings. The results of the electronic circuit simulation show excellent qualitative and quantitative agreement with analytical approximations confirming the coexistence of resonance and anti-resonance effects near a combination resonance frequency.
1 Introduction
Parametric excitation in mechanical systems is well known for its destabilizing resonance effect and, in recent decades, increasingly also for its stabilizing effect, i.e., parametric anti-resonance. While initially the presence of parametric excitation was rather an undesired feature affecting the system’s dynamics in an unfavorable way, nowadays, there is a rich field of applications with deliberately introduced time periodicity. On the one hand, the destabilizing effects are widely used in energy harvesting applications [2, 27] as well as in parametric amplifiers [12]; on the other hand, the anti-resonance effect is introduced in order to attenuate vibrations and to enhance dissipative properties [11]. Another quickly growing field of application is the microelectromechanical systems (MEMS). In the field of MEMS, there are several applications employing stabilizing and destabilizing effects, e.g., highly sensitive mass sensing [21] and rapid switching in mechanical resonators [22], respectively.
Most of the theoretical studies and practical applications on time-periodic systems deal with synchronous parametric excitation. In this case, all time-periodic excitation terms of a multi-dimensional system are varying in phase. The first theoretical study on a parametrically excited system with out-of-phase excitation terms was done by Cesari [5]. Cesari showed that in a system of two undamped Mathieu equations coupled via parametric excitation with a \(\pi /2\) phase shift, the trivial solution is unstable for all excitation frequencies. The effect was later called total instability [6]. In 1976, for the first time, the stability effects of different phase relations (i.e., asynchronous excitation) combined with non-uniform damping were extensively studied by Schmieg [25]. In this work, the stability problem was first approached theoretically using the method of slowly varying phase and amplitude for the derivation of stability boundaries and Lyapunov characteristic exponents (LCEs). However, while the very complex symbolic expression for LCEs was derived by Schmieg in general form allowing the study of both stabilizing and destabilizing effects of parametric excitation, the analysis was limited to the destabilizing effect only, as the anti-resonance effect was not yet known at that time. The theoretical findings were also validated experimentally. Since the required phase shift in the off-diagonal excitation terms cannot be easily realized in a mechanical system, the validation was performed on an equivalent electronic system, where arbitrary phase relations are readily implemented. Schmieg’s investigations remain the only experimental work done on asynchronous parametric excitation to this day.
Eicher [14, 15] and Dohnal [7, 9] also studied asynchronous parametric excitation from different perspectives. Eicher thoroughly studied the destabilizing behavior focusing, however, only on the stability boundaries. The symbolic expressions for the boundary curves were derived by the method of successive approximation [14]. The impact of asynchronous excitation was observed in terms of shifted stability boundaries, while the actual reason for the shift was not recognized. Dohnal extensively studied the stabilizing effect of general harmonic excitation focusing mostly on stability conditions and stability boundaries applying the averaging method. The LCEs, denoted by Dohnal as equivalent damping, were discussed in detail for the special cases of in-phase and anti-phase parametric excitation [7]. Further, equivalent damping for the general case of asynchronous excitation was discussed briefly in [9], focusing, however, again on the stabilizing effect. In this way, the stability effects of asynchronous parametric excitation were studied either from the destabilizing or the stabilizing perspective only.
Recently, it was found that total instability is only a special case for a uniformly damped system with asynchronous parametric excitation. In case with non-uniform damping, there are wide alternating areas of stabilized and destabilized behavior [18]. Further, it was shown that, contrary to the previous state of knowledge, resonance and anti-resonance may coexist at each combination resonance frequency resulting in a sharp transition between the stabilizing and the destabilizing behavior [19]. Analysis based on the LCEs evaluated over the whole region of excitation frequencies provided a deeper insight into the various stability effects of asynchronous excitation, which were previously observed only as shifts of the stability boundaries.
The theoretical results concerning these newly discovered stabilizing effects of asynchronous excitation have to be verified and validated in order to acquire credibility. The semi-analytical results obtained by the method of normal forms have already been verified by numerical integration, i.e., Floquet analysis [19]. The purpose of the present contribution is to validate the stabilizing effects, in particular, the coexistence of resonance and anti-resonance at a combination resonance frequency. As indicated by the previous analytical investigations [18], specific phase relations, depending on the structure of system matrices, are required for the coexistence of resonance and anti-resonance. For systems with purely symmetric system matrices, i.e., systems without circulatory terms, only the phase shift in the off-diagonal terms leads to such effects. For more complex systems featuring skew-symmetric coupling through circulatory terms, there are several additional phase relations possible, which are not limited to the phase shift in the off diagonal. Considering mechanical systems, the practical realization of the seemingly more simple case seems to be impossible—there are no mechanical systems known featuring phase-shifted off-diagonal parametric excitation terms. On the other hand, the more complex case with skew-symmetric system matrices and necessary phase relations of parametric excitation terms is more likely to appear in mechanical systems. For example, the minimal model of a disk brake with asymmetric bearing, as treated in [18, 26], does indeed fulfill all necessary conditions for the coexistence of resonance and anti-resonance. However, as to the question of validation, such a complex system featuring also gyroscopic terms along with circulatory terms is rather inadequate for this purpose—the interaction and superposition of different effects make it impossible to study the implications of individual system parameters. For this reason, the validation of the newly discovered stability effects is performed using a close-to-experiment simulation setup of an electronic system based on the real experiment conducted by Schmieg [25]. According to the IEEE Standard for Validation of Computational Electromagnetics Computer Modeling and Simulations, the suitable validation references are not limited to measurements, i.e., “silicon data.” Another suitable reference for validation may be also obtained from comparison of two different modeling techniques [16]. If the used techniques are different enough, then high confidence in the results can be obtained [13]. For this purpose, additionally to the solution of differential equations, a detailed electronic system is implemented in the electronic circuit simulation software LTspice XVII which is based on SPICE electronic circuit simulator [1]. SPICE, standing for Simulation Program with Integrated Circuit Emphasis, is the worldwide standard integrated circuit simulator widely used in education, research and industry. The invention of SPICE in 1970 was recognized as a significant technical achievement and awarded an IEEE Milestone [17]. With the simulation results being very close to real silicon data, SPICE is considered as a “golden reference” in industry and is also used for validation [23]. In the present contribution, the electronic simulation model itself is first validated by means of the existing experimental data. Based on this validated model, the theoretical findings concerning the coexistence of resonance and anti-resonance are to be confirmed. In this way, a simulation-based validation is performed due to the missing real world experimental data.
The contribution is structured as follows. In Sect. 2, the common as well as the newly discovered stability effects of parametric excitation are presented. Section 3 deals with the design of the electronic system used for the validation. The validation results are presented in Sect. 4 followed by conclusions.
2 Stability effects of parametric excitation
2.1 Stability criterion
In order to thoroughly study the various stability phenomena of parametric excitation and to establish a comparison between the results obtained by different methods, an appropriate stability criterion has to be adopted. For this purpose the Lyapunov characteristic exponents (LCEs) are chosen, which are equal to the characteristic numbers introduced by Lyapunov taken with the inverse sign [4, 20]. The LCEs are defined for both autonomous and time-periodic systems. For a linear autonomous dynamical system those are given by the real parts of the eigenvalues. For a time-periodic system with period T, the LCEs are given by
where \(\rho _{i}\) are the Floquet multipliers, i.e., the eigenvalues of the monodromy matrix.
An asymptotically stable trivial solution is characterized by all LCEs being negative. However, it is sufficient to consider only the largest LCE which will be denoted further as \(\Lambda \) with \(\Lambda =(\lambda _i)_{\max }\). This uniform stability criterion enables comparison between autonomous and time-periodic systems. Moreover, the LCEs, contrary to the Floquet multipliers, are not distorted by different periods T, enabling a comparison of the stability characteristics for different excitation frequencies as well.
2.2 Parametric resonance effects
In contrast to the stability effects of asynchronous excitation, the common stability effects of displacement-proportional synchronous parametric excitation are limited to narrow frequency ranges around the well-known resonance frequencies
with \(\omega _k\) and \(\omega _l\) denoting the k-th and the l-th circular eigenfrequencies (i.e., natural frequencies) of the underlying undamped autonomous system. The denominator \(p\in \mathbb {N}\) denotes the order of the resonance with higher orders quickly becoming less significant. The fundamental resonances with \(k=l\) involve only one eigenfrequency and have always a destabilizing effect in systems with positive definite stiffness matrix. On the other hand, combination resonances, involving two eigenfrequencies with \(k\ne l\), may have either a stabilizing (anti-resonance) or a destabilizing (resonance) effect in systems with non-uniform damping matrix [10]. In case of synchronous excitation, resonance and anti-resonances are always separated: If there is resonance at the sum combination resonance frequency \(\Omega =\omega _k+\omega _l\), there will be anti-resonance at the difference combination resonance frequency \(\Omega =\left| \omega _k-\omega _l\right| \) and vice versa.

Stability effects of synchronous parametric excitation in system (3): the largest LCE \(\Lambda \) for varying excitation frequency \(\Omega \) with \(\omega _1=1\), \(\omega _2=\sqrt{5}\), \(\delta _{11}=0.15\), \(\delta _{22}=0.05\)
As the different resonances involve at most two eigenfrequencies, all of the significant resonance effects can be quickly demonstrated with the following two degrees of freedom \(\mathbf {MDK}+\mathbf {C}(t)\) system
with synchronous displacement-proportional parametric excitation of amplitude \(\varepsilon \). Figure 1 shows the stability impact in terms of the largest LCE \(\Lambda \) obtained from numerical Floquet analysis. All of the characteristic features are clearly represented: dominating first-order fundamental and combination resonances, \(p=1\), with anti-resonance at the difference combination resonance frequency. These stability effects are well known and have also been demonstrated experimentally, e.g., in a recent study by Dohnal using electromagnetic variable-stiffness actuators [11].
In the following, a simple \(\mathbf {MDK}+\mathbf {C}(t)\) system with out-of-phase parametric excitation is considered
Initially, the case of asynchronous excitation was treated in 1940 by Cesari for a simple undamped two-degree-of-freedom system only revealing the so-called total instability, where any infinitesimally small parametric excitation leads to instability for all excitation frequencies [5]. Later in 1970s and 1980s, Schmieg [25] and Eicher [15] studied general non-uniformly damped two-degree-of-freedom systems with asynchronous harmonic excitation. As at that time the anti-resonance was not known yet, only the unstable case, i.e., the problem of stability boundaries, was treated. However, the expressions derived by Schmieg describe the stabilizing behavior as well. On the other hand, Dohnal studied similar systems from the anti-resonance perspective, while the phase shifts in the parametric excitation were expressed in terms of sine and cosine functions of different amplitude [8, 9]. Recent studies on asynchronous parametric excitation revealed that, in general, both effects—resonance and anti-resonance—coexist at each combination resonance frequency, while their strength depends strongly on the phase angle between the off-diagonal excitation terms [18, 19]. The coexistence of stabilizing and destabilizing effects for two different cases of asynchronous excitation is shown in Fig. 2.

Stability effects of asynchronous parametric excitation in system (4) with \(\omega _1=1\), \(\omega _2=\sqrt{5}\), \(\delta _{11}=0.15\), \(\delta _{22}=0.05\)
Based on the highly complex general analytical expressions for the LCEs, Schmieg derived concise expressions for the characteristic features of the destabilizing effect, including the location and the magnitude of the strongest destabilization. Extending the approach to the stabilizing effect as well, in [19] further characteristic points were derived by means of the method of normal forms: points \(P^{\,s}\) and \(P^{\,d}\) describing the location and the magnitude of the strongest stabilization \(\{\Omega ^{s},\Lambda ^{s}\}\) and of the strongest destabilization \(\{\Omega ^{d},\Lambda ^{d}\}, \) respectively, as well as point \(P^{\,0}\) describing the transition between the two effects \(\{\Omega ^{0},\max \{-\tfrac{\delta _{11}}{2},-\tfrac{\delta _{22}}{2}\}\}\), as shown in Table 1. In this way, the behavior is described only at specific points, i.e., without frequency detuning, characterizing the most important stability features and ensuring interpretability of the symbolic expressions. There are further quantities of importance in context of anti-resonance. As shown by Dohnal [7, 9] and as also clearly seen from the expressions for \(\Lambda ^s\) in Table 1, the maximum anti-resonance is limited to \(\Lambda ^{*,s}=-\frac{1}{4}(\delta _{11}+\delta _{22})\) for excitation amplitudes exceeding the threshold value \(\varepsilon ^*\). Depending on whether the maximum stabilization is reached or not, different formulas apply for the location of the strongest stabilizing effect, see Table 1.
The expressions for \(\Omega ^{d}\) and \(\Lambda ^{d}\) coincide with those derived by Schmieg [25], while the expressions for \(\Lambda ^{s}\) and \(\varepsilon ^*\) contain the special cases of in-phase and anti-phase excitation treated by Dohnal [7]. The general case of asynchronous excitation was studied by Dohnal exactly at the combination resonance frequencies with \(\Omega =|\omega _1\pm \omega _2|\) [9]. However, as seen in Table 1, the characteristic frequencies \(\Omega ^s\) and \(\Omega ^d\), i.e., the location of the strongest stability effects, in general, do not exactly coincide with the combination resonance frequencies. Even though the shift appears to be rather small, it has a substantial effect on the LCE due to the high sensitivity to the excitation frequency in this region.
The symbolic expressions in Table 1 clearly demonstrate the appearance of resonance and anti-resonance as well as their coexistence depending in a simple way on the phase shift \(\zeta _c\). Looking at \(\Lambda ^{s,d}\) and \(\Omega ^{s,d}\), it can be clearly seen that the case \(\zeta _c=\pi \) (skew-symmetric excitation) is opposite to \(\zeta _c=0\) (symmetric excitation) with resonance and anti-resonance swapping the locations—there is no coexistence for these phase angles. For another special case featuring coexistence with \(\zeta _c=\pm \pi /2\), the characteristic points are located symmetrically to the combination resonance frequencies due to the relation \(\tan \left( \zeta _c\right) =\cot \left( \zeta _c\right) \) and swap their positions depending on whether the upper or the lower sign applies.
Figure 2 shows the LCEs for two different phase angles with otherwise identical parameters. The characteristic points evaluated using the symbolic expressions from Table 1 show a very good agreement with the numerical results. In the first case with \(\zeta _c=-\pi /2\), the effects are equally strong near the sum and the difference combination resonance areas, while the amplitude of variation \(\varepsilon =0.2\) is very close to the threshold value \(\varepsilon ^*=0.21\). In the second case with \(\zeta _c=-\pi /4\), the anti-resonance is dominating in the difference combination resonance area with variation amplitude \(\varepsilon =0.2\) exceeding the threshold value \(\varepsilon ^*=0.16\), while in the sum combination resonance area the resonance is much more pronounced and the amplitude of variation \(\varepsilon =0.2\) is way below the threshold value \(\varepsilon ^*=0.39\). The complex stability behavior is very well captured by the few characteristic points.
The approximate analytical expressions from Table 1, derived by the semi-analytical method of normal forms, have been verified by comparing the results with the numerical results obtained via Floquet analysis [19]. However, while the unstable behavior has been validated by Schmieg by conducting experimental studies on an electronic circuit system, the stable behavior of an asynchronously excited system has yet to be validated on a physical system.
3 Electronic system design
Schmieg used an electronic system for the validation of the theoretical findings concerning the instability in case of asynchronous parametric excitation [25]. The stabilization effects could have been studied by the same experimental setup, but were not in the scope of interest and remained concealed by stability. In the present contribution, the same experimental setup is reproduced in detail in the electronic circuit simulation program LTspice. In order for the LTspice simulation model to provide a suitable validation reference in compliance with the IEEE standard [16], it has to be different enough from the other methods used for analysis. This is ensured by constructing a detailed electronic model containing various components like operational amplifiers and amplitude modulators, while the numerical and semi-analytical results are based on abstract differential equations representing the conceptual model of the underlying system. The close-to-experiment simulation model itself will be first validated against the available experimental data in order to establish confidence in the model and later used to confirm the theoretical results concerning the stabilizing effects of parametric excitation.
Analogously to mechanical oscillators, oscillating circuits can as well be realized using electronic components. An RLC electronic circuit consists of three main components: resistor (R), inductor (L) and capacitor (C). The behavior of an RLC circuit is analogous to a one-dimensional damped mechanical oscillator, while resistance corresponds to damping, inductance to mass and capacitance to the inverse of stiffness (compliance) [3]. The electronic system analyzed in the following consists of two RLC circuits (RLC1 and RLC2) coupled through parametric excitation without feedback. The voltage from one RLC circuit is transferred and amplified by means of a buffer amplifier enabling feedback-free coupling. The voltage signal is multiplied with cosine or sine signal (realized as amplitude modulation) introducing parametric excitation. After integration, the signal is then introduced to the second RLC circuit through a voltage-controlled current source. The simulation schematic is presented in Fig. 3.
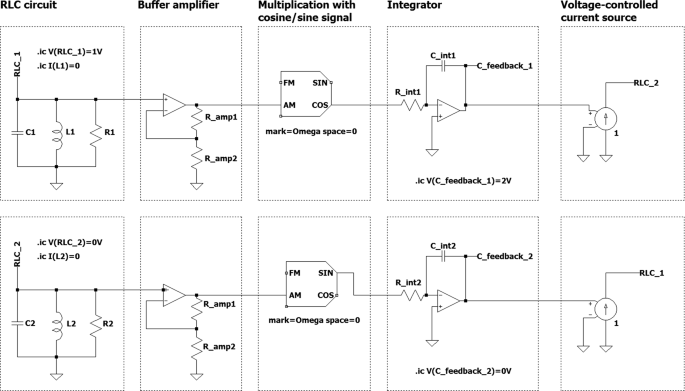
Simulation schematic: two RLC circuits with feedback-free coupling through asynchronous parametric excitation
The governing equations of the above system in terms of voltage \(u_i\), with \(i=1,2\), are obtained applying the Kirchhoff’s current law. After differentiation the equations are given as follows
where \(C_i\), \(R_i\) and \(L_i\) are the capacitance, resistance and inductance values of the RLC circuits, respectively. \(R_{int,i}\) represents the resistance in the integration block through which the amplitude of parametric excitation will be controlled. Obviously, Eqs. (4) and (5) have the same structure. According to the mechanical–electrical analogy, the following equivalence is given: The damping coefficients \(\delta _{ii}\) correspond to \(\frac{1}{C_i R_i}\), the squared natural frequencies \(\omega _i^2\) correspond to \(\frac{1}{C_i L_i}\), and the amplitude of variation \(\varepsilon \) is given by \(-\frac{1}{C_i R_{int,i}}\). In the following, the notation used in the general formulation in Eq. (4) will be used for the electrical system as well. In order to obtain the same natural eigenfrequencies and damping values as in the experiments done by Schmieg, the parameters of the RLC circuits are set according to Table 2.
Stability maps in terms of the variation amplitude \(\varepsilon \) and excitation frequency \(\Omega \) identify the transition between the stable and the unstable region and represent a common tool in the analysis of parametrically excited systems. However, they miss a great deal of information about what exactly is happening inside each of the regions. In particular, any potential stabilizing effects cannot be recognized. Therefore, a deeper insight requires the analysis of the Lyapunov characteristic exponents (LCEs). Schmieg investigated only the unstable region and determined the LCEs from the rate of exponential growth of the signals. While this is easily done in the case of an exponentially unstable trivial solution with monotonously growing amplitudes, determining the LCEs from the signals’ time history in the stable case is rather complicated and unreliable. The reason is that in the stable case the amplitudes are quickly decaying beating waves, so that an envelope function accounting for the beat effects has to be constructed. Here, the simulation approach in LTspice offers a significant advantage over the experimental setup: instead of analyzing the time histories, a proper Floquet analysis can be performed on the electronic system providing reliable LCE values. With the ability to precisely define the initial conditions of the simulations and to know the solution at any instant of time, the monodromy matrix, and with this the LCEs, can be calculated with high precision.
In order to perform the Floquet analysis of the electronic system in LTspice for different parameters and to efficiently process the results, a matlab script is written (ver. R2018a). The script coordinates the LTspice runs starting each simulation with appropriate parameters, including the amplitude of parametric excitation \(\varepsilon \), the excitation frequency \(\Omega \), the damping coefficients \(\delta _{ii} \) as well as the phase angle \(\zeta _c\). For the post-processing, the results of the LTspice simulation are imported to matlab using LTspice2Matlab function.
4 Validation of the theoretical findings
The electronic LTspice model itself is first validated with respect to its ability to identify the stability boundaries for different excitation frequencies \(\Omega \) and amplitudes of variation \(\varepsilon \). In particular, the ability of the model to represent the shift of the stability boundaries in case of asynchronous excitation is demonstrated. Further, a more detailed investigation of the stability effects in terms of the largest LCE is performed. Here, the electronic model is validated against the experimental data available for the unstable region. The validated model is then used to confirm the stability effects identified by analytical and numerical methods.
In the first step, the data from Schmieg’s experiments, available only in printed version, are extracted using the software WebPlotDigitizer [24]. However, Schmieg provides only scarce information on parameter values giving only the eigenfrequencies and the damping coefficients, while other parameters of the electronic circuit such as those defining the amplitude of variation are unknown. Instead, the amplitude is represented by an effective voltage \(U_\mathrm{{eff}}\) scaled with an unknown factor. Therefore, the amplitude of variation \(\varepsilon \) has to be determined, which is done by matching the stability boundaries between the experiment and the numerical Floquet analysis for one single value of variation \(U_\mathrm{{eff}}=6\, V\) for the uniformly damped system without a phase shift. The following relation is found and used for all subsequent calculations:
For a better representation, a new amplitude parameter \(\tilde{\varepsilon }\) is introduced, which is of the same magnitude as \(U_\mathrm{{eff}}\), i.e., \(\tilde{\varepsilon }=\varepsilon /362500\).
Figure 4 shows the stability boundaries for a uniformly damped system with \(\delta _{11}=\delta _{22}=70 \sec ^{-1}\) and varying phase angle \(\zeta _c\). For each case, \(\zeta _c=0\) and \(\zeta _c=\pi /2\), four sets of data are compared: Schmieg’s analytical and experimental data, numerical Floquet analysis and electronic circuit simulation with LTspice, denoted further as “analytical,” “experiment,” “Floquet” and “LTspice,” respectively. The comparison shows reasonable qualitative and quantitative agreement between all four data sets, while only for the case of \(\zeta _c=\pi /2\) a noticeable deviation can be seen in the lower excitation frequencies \(\Omega \). Partially, the deviation may be explained by errors during the data extraction process from the printed media. This is confirmed by comparing the analytical data obtained from the expressions derived by Schmieg against the same analytical data obtained from the digitized plot. Nevertheless, Fig. 4 shows that the reconstructed electronic LTspice model is performing well in predicting the stability boundary for synchronous and asynchronous parametric excitation over wide regions of \(\varepsilon \) and \(\Omega \).

Stability boundary of system (5): \(\delta _{11}=\delta _{22}=70 \sec ^{-1}\), variable phase shift \(\zeta _c\)

Stabilizing and destabilizing effects of asynchronous parametric excitation: \(\delta _{11}\!=\!220\sec ^{-1}\), \(\delta _{22}\!=\!22 \sec ^{-1}\), \(\tilde{\varepsilon }\!=\!6\), variable phase shift \(\zeta _c\)
Of greater importance is, however, the ability of the LTspice electronic model to reliably reproduce the LCEs of the underlying physical system. Schmieg’s experiments provide data for the unstable behavior, which are used for the validation of the LTspice model. Figure 5 shows the largest LCE of a non-uniformly damped system under parametric excitation with variable phase shift \(\zeta _c\). Again, four data sets are presented: analytical, experimental, Floquet and LTspice. A remarkable qualitative and quantitative agreement can be identified between all four data sets in the unstable region with \(\Lambda >0\). In particular, the electronic model predicts the experimental data with great accuracy.
So far, the close-to-experiment LTspice model has been validated with respect to its ability to predict the stability boundaries as well as the LCEs in the unstable region confirming the physical accuracy of the model. The validation domain includes the variation of the phase angle with \(\zeta _c=0,\pi /2\), the variation of the damping ratio with \(\delta _{11}/\delta _{22}=1,10\) and the variation of the excitation frequency in the frequency range \(\Omega =[2030, 2150]\) Hz. The intended application domain of the electronic simulation model lies completely within the validation domain, which additionally increases the confidence in prediction based on this model. Therefore, it is further assumed that the electronic model represents a suitable validation reference and reliably reproduces the stability behavior of the underlying physical system.
Further comparison between the LTspice electronic circuit simulation, Floquet and analytical results in the stable region is performed in order to prove the physical significance of the predicted stabilizing effects of asynchronous parametric excitation. Figure 5 shows that also in the stable region there is good agreement between the three data sets. Also the analytically derived expressions for the characteristic points \(P^{\,s}\), \(P^{\,d}\) and \(P^{\,0}\) match very well with the results of the electronic circuit simulation. In this way, the predicted coexistence of resonance and anti-resonance is confirmed by simulation of a physical system represented by the electronic circuit.
Figure 5 provides a comprehensive insight into the impact of asynchronous excitation covering both the stabilizing and the destabilizing behavior. In the studies performed by Schmieg [25], the impact was characterized as a mere shift of the stability boundaries, while the actual reason—merging of resonance and anti-resonance—was not recognized. In the same manner, Dohnal [9] studied the shifts of the stability boundaries in case of anti-resonance, where particular attention has to be paid to the adjacent resonance area with a sharp transition to possible instability.
5 Conclusions
An electronic simulation model was used to validate new theoretical findings on asynchronous parametric excitation. Recent studies revealed coexistence of resonance and anti-resonance at each combination resonance frequency for general phase relations between the excitation terms. While the effects of asynchronous excitation in case of instability were explored and validated by Schmieg in 1976, the more general behavior, including the coexistence of resonance and anti-resonance, remained unrecognized for a long time. The close-to-experiment simulation using the electronic circuit simulation software LTspice confirmed the recent theoretical findings. The use of a simulation model offers significant advantages over an experimental setup and enables a thorough study of stability phenomena in terms of stability boundaries, but also, more importantly, in terms of Lyapunov characteristic exponents, providing deeper insight into all possible stabilizing and destabilizing effects. Further, the simulation also confirmed the usefulness of the more practical characteristic points describing the most prominent stability features like the location and the magnitude of the strongest stabilization and destabilization.
Although the presented electronic system was designed exclusively to validation purposes, it also emphasizes the physical significance of the coexistence phenomenon. On the one hand, this new phenomenon helps to understand the stability behavior of complex dynamical systems, e.g., the minimal model of a disk brake with asymmetric bearing [26], where coexistence was found to be the key to understanding the previously observed but unexplained behavior [18]. On the other hand, it might be of importance in the design of future applications of parametric excitation, in particular in the field of microelectromechanical systems by making use of the steep transition between the stabilizing and the destabilizing behavior.
References
Analog Devices Inc.: LTspice XVII (2019). https://www.analog.com
Bobryk, R.V., Yurchenko, D.: On enhancement of vibration-based energy harvesting by a random parametric excitation. J. Sound Vib. 366, 407–417 (2016)
Busch-Vishniac, I.J.: Electromechanical Sensors and Actuators. Springer, New York (1999)
Bylov, B.F., Vinograd, R.E., Grobman, D.M., Nemytskii, V.V.: The Theory of Lyapunov Exponents and Its Applications to Problems of Stability. Nauka, Moscow (1966). (in Russian)
Cesari, L.: On the Stability of Systems of Linear Differential Equations with Periodic Coefficients. Reale Accademia d’Italia, Rome (1940)
Cesari, L.: Asymptotic Behavior and Stability Problems in Ordinary Differential Equations. Ergebnisse der Mathematik und ihrer Grenzgebiete. 2. Folge. Springer, Berlin (1963)
Dohnal, F.: Damping by parametric stiffness excitation: resonance and anti-resonance. J. Vib. Control 14(5), 669–688 (2008)
Dohnal, F.: General parametric stiffness excitation—anti-resonance frequency and symmetry. Acta Mech. 196(1), 15–31 (2008)
Dohnal, F.: Damping of Mechanical Vibrations by Parametric Excitation: Parametric Resonance and Anti-Resonance. Südwestdeutscher Verlag für Hochschulschriften, Saarbrücken (2009)
Dohnal, F.: A contribution to the mitigation of transient vibrations. Parametric anti-resonance: theory, experiment and interpretation. Habilitation thesis. Technical University of Darmstadt, Darmstadt, Germany (2012)
Dohnal, F.: Experimental studies on damping by parametric excitation using electromagnets. Proc. Inst. Mech. Eng. C J. Mech. Eng. Sci. 226(8), 2015–2027 (2012)
Dolev, A., Bucher, I.: Tuneable, non-degenerated, nonlinear, parametrically-excited amplifier. J. Sound Vib. 361, 176–189 (2016)
Drozd, A.L.: Selected methods for validating computational electromagnetic modeling techniques. In: 2005 International Symposium on Electromagnetic Compatibility, 2005. EMC 2005., vol. 1, pp. 301–306 Vol. 1. IEEE (2005)
Eicher, N.: An Iterative Method for Analysis of Stability Behavior of Time-Varying Vibration Systems. VDI-Verlag, Düsseldorf (1984)
Eicher, N.: Parametric resonances of first and second kind in vibration systems with general harmonic excitation matrices. Ingenieur-Archiv. 54(3), 188–204 (1984)
IEEE: IEEE Standard for Validation of Computational Electromagnetics Computer Modeling and Simulations. IEEE Std. 1597.1-2008 pp. c1–41 (2008)
IEEE: List of IEEE Milestones. Engineering and Technology History Wiki (2019)
Karev, A., Hagedorn, P.: Global stability effects of parametric excitation. J. Sound Vib. 448C, 34–52 (2019)
Karev, A., Hagedorn, P.: Simultaneous resonance and anti-resonance in dynamical systems under asynchronous parametric excitation. J. Comput. Nonlinear Dynam. (2020). https://doi.org/10.1115/1.4046499
Lyapunov, A.M.: General problem of the stability of motion. State Publishing House of Technical-Theoretical Literature (GITTL), Moscow-Leningrad, USSR, Classics of Natural Science (1950). (in Russian)
Moran, K., Burgner, C., Shaw, S., Turner, K.: A review of parametric resonance in microelectromechanical systems. Nonlinear Theory Appl. 4(3), 198–224 (2013)
Okamoto, H., Mahboob, I., Onomitsu, K., Yamaguchi, H.: Rapid switching in high-Q mechanical resonators. Appl. Phys. Lett. 105(8), 083114 (2014)
Peng, K., Huang, Y., Mallick, P., Cheng, W., Tehranipoor, M.: Full-circuit SPICE simulation based validation of dynamic delay estimation. In: 2010 15th IEEE European Test Symposium, pp. 101–106. IEEE (2010)
Rohatgi, A.: WebPlotDigitizer (2019). https://automeris.io/WebPlotDigitizer
Schmieg, H.: Combination Resonance in Systems with General Harmonic Excitation Matrix. Ph.D. Thesis. University of Karlsruhe, Karlsruhe, Germany (1976)
Spelsberg-Korspeter, G., Hagedorn, P.: Complex eigenvalue analysis and brake squeal: traps, shortcomings and their removal. SAE Int. J. Passeng. Cars Mech. Syst. 5(4), 1211–1216 (2012)
Yang, W., Towfighian, S.: A parametric resonator with low threshold excitation for vibration energy harvesting. J. Sound Vib. 446, 129–143 (2019)
Acknowledgements
Open Access funding provided by Projekt DEAL. The support of DFG through DFG SCHA 814/26-1 and DFG HA 1060/56-1 and of DAAD through PPP Brasilien 2019 (Project ID: 57390840) is gratefully acknowledged. We also thank Alexander Pavlov for assistance in constructing the electronic circuits.
Author information
Authors and Affiliations
Corresponding author
Ethics declarations
Conflict of interest
The authors declare that they have no conflict of interest.
Additional information
Publisher's Note
Springer Nature remains neutral with regard to jurisdictional claims in published maps and institutional affiliations.
Rights and permissions
Open Access This article is licensed under a Creative Commons Attribution 4.0 International License, which permits use, sharing, adaptation, distribution and reproduction in any medium or format, as long as you give appropriate credit to the original author(s) and the source, provide a link to the Creative Commons licence, and indicate if changes were made. The images or other third party material in this article are included in the article’s Creative Commons licence, unless indicated otherwise in a credit line to the material. If material is not included in the article’s Creative Commons licence and your intended use is not permitted by statutory regulation or exceeds the permitted use, you will need to obtain permission directly from the copyright holder. To view a copy of this licence, visit http://creativecommons.org/licenses/by/4.0/.
About this article

Cite this article
Karev, A., Hagedorn, P. Asynchronous parametric excitation: validation of theoretical results by electronic circuit simulation. Nonlinear Dyn 102, 555–565 (2020). https://doi.org/10.1007/s11071-020-05870-6
Received:
Accepted:
Published:
Issue Date:
DOI: https://doi.org/10.1007/s11071-020-05870-6