
Abstract
The severe progression of Diabetes Mellitus (DM) stands out as one of the most significant concerns for healthcare officials worldwide. Diabetic Retinopathy (DR) is a common complication associated with diabetes, particularly affecting individuals between the ages of 18 and 65. As per the findings of the International Diabetes Federation (IDF) report, 35–60% of individuals suffering from DR possess a diabetes history. DR emerges as a leading cause of worldwide visual impairment. Due to the absence of ophthalmologists worldwide, insufficient health resources, and healthcare services, patients cannot get timely eye screening services. Automated computer-aided detection of DR provides a wide range of potential benefits. In contrast to traditional observer-driven techniques, automatic detection allows for a more objective analysis of numerous images in a shorter time. Moreover, Unsupervised Learning (UL) holds a high potential for image classification in healthcare, particularly regarding explainability and interpretability. Many studies on the detection of DR with both supervised and unsupervised Deep Learning (DL) methodologies are available. Surprisingly, none of the reviews presented thus far have highlighted the potential benefits of both supervised and unsupervised DL methods in Medical Imaging for the detection of DR. After a rigorous selection process, 103 articles were retrieved from four diverse and well-known databases (Web of Science, Scopus, ScienceDirect, and IEEE). This review provides a comprehensive summary of both supervised and unsupervised DL methods applied in DR detection, explaining the significant benefits of both techniques and covering aspects such as datasets, pre-processing, segmentation techniques, and supervised and unsupervised DL methods for detection. The insights from this review will aid academics and researchers in medical imaging to make informed decisions and choose the best practices for DR detection.
1 Introduction
The medical decision support system aids doctors in analyzing patients' health records, encompassing various decisions. Moreover, experience and knowledge play crucial roles in their decision-making processes. Most computer-assisted diagnostic systems are built upon conventional Machine Learning (ML) techniques that depend on relevant data representation for their performance. These systems necessitate substantial domain expertise and meticulous manual engineering. There is a considerable need for manual efforts in traditional ML algorithms to extract hidden features. Deep Learning (DL) can be viewed as an emerging and latest development in this direction, aiming to broaden the scope of conventional ML.
Furthermore, the DL algorithm operates on the automatic representation of data, which is considered a vital advantage in the technique of DL models. However, it requires extensive training and a large, well-annotated dataset to enhance the model's performance. Supervised DL algorithms play a crucial role in predictive analysis, demonstrating the substantial potential and providing solutions for various issues (Raheja et al., 2021). Conversely, Unsupervised DL algorithms have the potential to identify multiple hidden patterns in healthcare data (Raza and Singh 2021). UL diverges from supervised methods by operating without labeled training data.
UL plays a crucial role in exploratory data analysis, delving into patterns and structures within data without the guidance of labeled outcomes. The challenge lies in evaluating the outcomes of UL methods due to the absence of a universally accepted mechanism for cross-validation or validation on independent datasets. Unlike SL, where predictive models can be assessed by predicting responses on unseen data, UL operates where the accurate answers are unknown (James et al. 2000). This inherent nature of unsupervised problems makes validating or cross-valid results challenging, emphasizing the need to understand the data better and carefully interpret the discovered patterns. Despite the absence of a straightforward validation process, UL remains a powerful tool for uncovering hidden insights and relationships within datasets(James et al. 2000).
Notably, UL, exemplified by clustering techniques, brings several advantages. It facilitates exploratory analysis, which proves valuable in scenarios where the nature of the data is not fully understood. UL methods alleviate the dependency on extensive labeled datasets (An et al. 2022), which is particularly beneficial in the medical field where expert annotation is time-consuming. Moreover, UL excels in handling complex and high-dimensional data structures, providing insights into intricate relationships within medical imaging data. Its effectiveness in anomaly detection and generalization to new, unseen data further enhances its utility for early disease detection and adaptability to diverse patient cases.
While acknowledging noteworthy advantages, challenges in parameter tuning and interpretation of learned representations are vital. Choosing between supervised and unsupervised approaches depends on dataset characteristics and the medical imaging problem's nature, requiring thorough evaluation for optimal model performance (A. Kumar et al. 2019).
The clustering algorithm, in particular, tends to group dissimilar elements based on their attributes without the need for supervision or labeled data (Chakradar et al., 2021). This method arranges data based on the discovery of knowledge. Deep clustering techniques represent a fusion of clustering and deep learning algorithms. The superior performance of DEC (Deep Embedded Clustering) techniques compared to UL methods is attributed to their effective clustering capabilities. The ability of clustering algorithms to combine feature learning with cluster assignment introduces new possibilities, overcoming challenges related to labeling in SL approaches (Enguehard et al., 2019).
According to the International Council of Ophthalmologists (data on ophthalmologists worldwide, n.d.), the data highlights the urgent need for ophthalmologists, as shown in Fig. 1. The global epidemic of diabetes intensifies this need, a primary cause of Diabetic Retinopathy (DR), with an estimated 780 million people facing diabetes by 2045, as shown in Fig. 2. Additionally, it is projected that 35% of these individuals are expected to suffer from DR (H. Sun et al. 2022). Furthermore, it is projected that 86 million individuals (11%) will have severe sight-threatening retinopathy by 2045.


DR is commonly identified through the Early Treatment Diabetic Retinopathy Study (ETDRS) scale, which assesses the severity of the condition. This scale is widely accepted and used for clinical research and in the management of DR (Singer et al. 2024). The classification is based on the findings from color fundus photographs of the retina. The ETDRS scale categorizes DR into the following stages.
No retinopathy (Level 10) | There are no signs of DR in the retina |
Mild non-proliferative DR (NPDR) (Level 20) | Microaneurysms (minor swelling in the retina's blood vessels) are present, but there is no evidence of more severe changes |
Moderate NPDR (Level 35) | In addition to microaneurysms, there are more severe retinal changes, such as hemorrhages and hard exudates (yellow deposits in the retina) |
Severe NPDR (Level 47) | More significant retinal changes are observed, including more hemorrhages and more widespread retinal damage |
Proliferative DR (PDR) (Level 53) | In the most advanced stage of DR., New blood vessels grow abnormally in the retina, and there is an increased risk of severe vision loss due to bleeding and scarring |
The severity scale helps guide treatment decisions and determine the need for intervention. Timely identification and effective handling of DR are essential in preventing the risk of vision impairment.
Therefore, the demand for effective healthcare solutions, such as advanced unsupervised algorithms for early DR detection, becomes increasingly imperative (Alhussein et al., 2020; IDF). This intersection of rising DR prevalence and the scarcity of ophthalmologists underscores the importance of innovative approaches, like those integrating DL and UL algorithms, to address the challenges DR poses on a global scale (Ishtiaq et al. 2020). DR is caused by Diabetes Mellitus (DM) when the retina's blood vessels are blocked, leading to fluids leaking into the macula and blocking vision (Johnson et al., 2018). Similarly, to increase blood flow into the retina and overcome the blockage, new blood cells form over the surface of the fragile retina, leading to further fluid leakage and vision impairment. Therefore, DR can be mainly categorized into two classes, as mentioned below and shown in Fig. 3. The severity of DR, characterized by lesions and stages detailed in Table 1, emphasizes the pressing need for timely diagnosis, aligning with the scarcity of ophthalmologists globally.

Samples of Proliferative Diabetic Retinopathy and Non-Proliferative Diabetic Retinopathy Fundus Images (a) Proliferative Diabetic Retinopathy Fundus Image (b) Non-Proliferative Diabetic Retinopathy Fundus Image (Niemeijer et al., 2010)
-
1.
Non-Proliferative Diabetic Retinopathy
-
2.
Proliferative Diabetic Retinopathy
Approximately 75% of individuals with DR are located in developing nations, emphasizing a deficiency in access to both diagnosis and treatment (Maritim et al., 2003). According to official statistics from the World Health Organization (WHO) (Broadbent et al., 2021) and the IDF, DR is considered a complex and widely spread eye disease (Sun et al. 2022). It can be observed that DR is one of the most common reasons for sightlessness among adults and the working-age population in developed countries. Therefore, substantial efforts have been made in previous years to mitigate the impact of DR and assist in its analysis by developing tools for early diagnosis. DR can be categorized into diverse stages, as shown in Fig. 4. Artificial Intelligence (AI) provides insights into the data for better DR classification and is widely used as a medical imaging method. It can potentially mitigate the workload of ophthalmologists, thereby reducing the associated burden (Mansour, 2018).

The early detection of DR can be achieved through the automated AI approach, including supervised and unsupervised ML approaches. The pros and cons of these approaches are also discussed, with several articles published on both SL and UL methods for DR detection, as depicted in Fig. 5. The SL algorithm has been a prevailing trend for quite a long time, while the potential of the unsupervised algorithm is yet to be fully explored (Nath and Dandapat 2012; Saeed et al. 2021). Several researchers have applied both methods for early DR detection. Consequently, this review paper examines the current supervised and unsupervised methods utilized for the early diagnosis of diabetes. The paper seeks to categorize the diverse functional models of both SL and UL. Furthermore, the article demonstrates the comparability between the effectiveness of both methods on different dimensionalities of DR data.

Number of Publications Selected for the Study in the DR Domain Using Unsupervised and Supervised Learning, Extracted from Web of Science, Science Direct, Scopus, and IEEE Xplore Databases (2010–2023)
The primary objectives of this review study include:
-
1.
The literature review initially focused on keywords associated with SL methods and then explored UL methods from 2018 to 2023.
-
2.
The proposed review identifies publicly available and functional datasets for a comprehensive study on DR classification.
-
3.
The review explores the widely used SL techniques for DR detection, encompassing features and classification methods.
-
4.
The review examines the widely used UL techniques for DR detection, detailing features and classification methods.
-
5.
The proposed review work conducted a comparative analysis of Unsupervised and Supervised methods for DR classification.
The remaining paper is arranged sequentially. The second section outlines the Article Selection Criteria for this review paper and details the methods employed for article extraction. The third section presents a systematic and categorical review of DR Detection using supervised and unsupervised approaches, which encompasses the functional datasets, image processing, blood vessel segmentation, and optic disk segmentation techniques for DR classification. The fourth section engages in the discussion and critical analysis of the study. The fifth section addresses open challenges in DR classification, focusing on the potential of SL and UL. The paper concludes in the sixth section with future discussions.
2 Article selection criteria
Figure 6 provides a visual representation of the detailed process used to select publications, outlining the identification of review targets. It is crucial to emphasize that this study deviates from the systematic review category, although it employs a similar methodological approach.

Selection process for choosing the article
The selection criteria for the 103 articles were meticulously crafted, incorporating both inclusion and exclusion criteria. Inclusion criteria focused on articles relevant to the study of SL and UL methods in DR detection, unsupervised or supervised methods for segmentation, pre-processing, or feature extraction. Exclusion criteria ensured the exclusion of articles not directly related to the targeted research area. Therefore, the publication period spanned from 2010 to 2023, capturing a comprehensive range of literature. The search process encompassed four diverse well-known databases, including Scopus, Science Direct, Web of Science, and IEEE, to ensure a thorough exploration of available literature on the subject. This rigorous selection process aimed to gather a representative and comprehensive set of articles for robust analysis in the review.
The keyword selection is made with the primary objective across four databases. Three diverse groups of keywords are formulated using a combination of search queries, as shown in Table 2. The prepared keyword search uses four databases: Scopus, Science Direct, Web of Science, and IEEE. Five filters, namely query-based, year-based, technique-based, article-based, abstract, and keywords-based filters, are applied for selecting primary work throughout these datasets. Moreover, the filters are applied to extract 23 documents from Scopus, 28 from Science Direct, 26 from Web of Science, and 26 from IEEE to detect DR using SL and UL techniques. Figure 7 shows the filters applied to extract the research and review papers for the extensive literature review.

Filter for selection criteria of articles
The first filter is applied to four databases, retrieving 1306 articles, including the research and review work on DR detection using unsupervised and supervised DL. Furthermore, the second filter (year-based) limits the selected articles to 761. The articles were chosen between the time duration of 2010 and 2023. The third filter selects the review and research articles among all papers, including only core conference papers for the review. Based on all these parameters, 525 articles were chosen among 761 papers. Furthermore, the fourth and fifth filters were applied to retrieve the 103 articles for review.
-
Filter 1 targets the formulated keywords for the selection of primary studies.
-
Filter 2 deals with the publication year, which is taken between 2010 to 2023.
-
Filter 3 considers the primary work's article title, keywords, and abstract selection.
-
Filter 4 targets the techniques for SL and UL to select related articles.
-
Filter 5 considers the abstract and keywords like diabetic retinopathy, DR detection, and DR prediction using SL and UL methods to select relevant articles.
The filters are applied to four databases and distributed among them, as shown in Table 3. Four presumed databases (Web of Science, Scopus, ScienceDirect, IEEE) are used to select the number of quality publications for the review work. In all these 90 articles, authors have applied unsupervised or supervised methods for segmentation, DR detection, pre-processing, or feature extraction. 224, 601, 434, and 47 articles (DR detection using supervised or unsupervised methods) are retrieved from Web of Science, Scopus, ScienceDirect, and IEEE databases using the query-based filter. Moving forward, filter two retrieves 142, 349, 237, and 36 manuscripts for all four databases from 2010 to 2023.
Furthermore, Filter Three retrieves only review and research articles related to specified topics and collects 84, 263, 145, and 33 articles, respectively. After applying the fourth filter, 43, 52, 82, and 26 manuscripts are retrieved. Finally, Filter 5 narrows the articles based on abstract and keyword-based searches and provides 26, 23, 28, and 26 manuscripts for further analysis, as shown in Fig. 8.

Number of publications selected for review
3 Review of diabetic retinopathy detection
Retinal abnormalities are considered vital and significant public health issues, with numerous cases prevalent in developing countries. These abnormalities can be categorized as systemic and non-systemic retinal abnormalities. Systemic retinal abnormalities can potentially affect multiple organs throughout the body, spreading from one point to the entire body(Madhusudhan et al. 2011). In contrast, non-systemic abnormalities only reside in the retina and originate through ocular manifestations (WHO 2023). Among various retinal abnormalities, diabetes can be considered a significant one. Diabetes can have a severe impact on different organs of the body, leading to problems such as cardiovascular disease and physical disability. Additionally, prolonged diabetes, accounting for 15% of all occurrences of blindness, is considered the leading cause of vision loss. The IDF states that the prevalence of diabetes is rising daily, affecting 451 million people worldwide, and is expected to impact 693 million people by 2045 (Cho et al., 2018).
The image acquisition system has significantly improved in recent years, as the disease detection and interpretation of results depend primarily on image quality. Therefore, magnetic resonance imaging (MRI) has enhanced the image acquisition and reconstruction process. The interpretation of extracted details from these images remains a crucial challenge, requiring expert knowledge to extract helpful information from numerous images. Automated medical image analysis methods have the potential to enhance interpretation and accurate prediction (Hervella et al., 2020). Moreover, it can reduce the burden on ophthalmologists. Automated DR classification can be achieved with ML/ DL techniques. However, DL methods have recently been observed to outperform most ML results, facilitating automated feature extraction and the interpretation of medical image information (Poonguzhali Elangovan 2022). Furthermore, these advantages make DL algorithms more suitable and widely accepted for medical image analysis (Chen et al., 2022). DL algorithms can be divided into supervised and unsupervised for medical imaging classification.
Most research (Anas Bilal et al. 2023; Anas Bilal et al. 2022c) has predominantly utilized supervised methods for the analysis of medical images, specifically for DR classification, and these algorithms have demonstrated human-level performance in most cases (Miotto et al., 2017). However, these systems have shown significant promise in advancing medical imaging and the healthcare sector over the last few years. Nevertheless, SL techniques require labeled or annotated data for model training, and preparing the model with labeled data proves beneficial for real-time applications. However, labeling that data requires manual effort (Alanazi, 2022). On the other hand, UL algorithms are highly suitable for medical domain applications to explore new possibilities (Chen & Yu, 2017; Anas Bilal et al. 2021a, b, c; Anas Bilal et al. 2022a, b, c). In general, biases are inherent in a specific set of rules that limit the ability of SL methods to discover other possibilities. Moreover, in cases of unavailable labeled data, there is a need for extra effort, manual work, and time for marking the data in the SL process. No existing work is available to discuss the utilization of supervised and unsupervised learning methodologies for diagnosing DR. Additionally, there is a lack of discussion on the preferred approach for detecting DR based on existing research.
This section reviews 103 selected articles, examining supervised and unsupervised deep learning methods for DR detection. The review covers 1) dataset characteristics, 2) pre-processing techniques, 3) DR detection modalities, 4) methods employed, comparative analyses, and 5) advantages, disadvantages, and issues associated with both approaches.
3.1 Functional datasets for DR detection
Multiple public and external datasets for detecting DR, comprising a diverse array of fundus images, are readily available. Some researchers have utilized open-access datasets in diverse studies, while others have employed primary ones. Dai et al. (Dai et al. 2021) utilized a comprehensive dataset comprising 466,627 fundus images from 121,342 diabetic patients. The authors evaluated both primary and secondary datasets, encompassing a cumulative total of 261,326 fundus images. Similarly, Yang et al. (Yehui Yang et al. 2017) utilized a publicly available DR dataset obtained from the Kaggle repository, which includes 22,795 images divided into training and testing sets. The author employed 800 fundus photos for testing the model and 21,995 for grading and detecting eye abnormalities.
Table 4 presents the dataset details for DR used in selected articles and other DR-related works focusing on detecting microaneurysms (MAs), hard exudates (HM), exudates, or DR screening. The table includes the names of the datasets and the corresponding publication years. Several researchers (Anas Bilal et al. 2021a, b, c; Anas Bilal et al. 2022a, b, c) have employed diverse publicly available or open-access datasets for DR detection. However, it is noteworthy that some investigators (Grzybowski et al. 2020) have utilized exclusive datasets with limited accessibility. Moreover, extensive datasets have been compiled from various colleges or hospitals employing different camera settings (Lim et al. 2022). Consequently, Table 4 also provides information about exclusive datasets and the specific camera settings used in the respective studies.
The comprehensive dataset details outlined in Table 4, including the number of fundus images, training/testing sizes, and availability links for open-access databases, specify that the open-access datasets like ROC (Retinopathy Open Challenge), E-ophtha, Messidor1 and 2, STARE, DIARETDB0, DIARETDB1, among others, have become standard in the field. As highlighted, researchers have explored these datasets with varied objectives, ranging from lesion detection and DR screening to identifying specific features such as HM, MAs, or exudates (Nagpal et al. 2021b). The last column of the table provides insights into the application of datasets for SL and UL. Further insights into dataset characteristics and specialties are represented in Fig. 9.

DR Dataset and Characteristics
Various datasets are available for DR detection, chosen based on the nature of the algorithms employed. In the work by Zhou et al. (Zhou et al. 2017a, b), unsupervised classification was applied to the ROC dataset for detecting DR using retinal fundus images. The ROC dataset comprises 100 images, partitioned into 50 for training and 50 for testing. Notably, a ground truth table is available exclusively for the training subset, necessitating the utilization of 37 fundus images for training and 13 for testing. The openly accessible nature of the ROC dataset facilitates its adoption by researchers in their research work. Another study by Hong Tan (Tan et al. 2017) employed the CLEOPATRA dataset, a large dataset designed explicitly for automated detecting exudates, MAs, and HM. (Bala & Vijayachitra, 2014). This dataset is divided into 149 photos for testing and 149 for training. The proposed model showcased notable performance, achieving sensitivities of 87.56% for detecting exudates and 75.67% for identifying dark lesions on the CLEOPATRA dataset.
The e-ophtha dataset combines 82 images from E-ophtha EX and 381 from E-ophtha MA. As per the literature review (Shuangling Wang et al. 2015, Orlando et al., 2018), exudates are traditionally identified in retinal images using older methods, while MAs are primarily detected automatically through more advanced techniques. Yu and Xiao utilized a CNN model to automatically identify exudates using the e-ophtha dataset (Shuangling Wang et al. 2015).
Furthermore, Orlando and Prokofyeva (Orlando et al., 2018) utilized the E-ophtha MA dataset along with two other databases, DIARETDB1 and Messidor, for automated detection of MAs and red lesions. Emphasizing the importance of open-access datasets, Kaggle EyePACS emerges as the largest publicly available eye fundus dataset for automatic DR detection. Accessible through EyePACS, this dataset serves as a valuable resource, providing an open platform for accessing and sharing retinal fundus images. The Kaggle EyePACS dataset encompasses approximately 5 million retinal fundus images, featuring a diverse population and varying degrees of DR. With a vast collection of images representing different retinas worldwide, this dataset is a robust resource for training DL algorithms. Researchers globally leverage this dataset, prompting EyePACS and the California Health Care Foundation to collaborate on a Kaggle competition, aiming for improved outcomes in DR detection using the Kaggle dataset.
Nevertheless, it is imperative to underscore that the Kaggle dataset exhibits an imbalanced class distribution, with a significantly higher number of images labeled as “no DR” than other categories. Hence, Xu Feng (D. Xiao et al. 2017a, b) collected a subset of medical images derived from the Kaggle EyePACS dataset for early prediction and detection of DR utilizing a Convolutional Neural Network (CNN). The authors specifically concentrated on 800 eyeballs within the Kaggle dataset, allocating 200 for model testing in the proposed study. Furthermore, Xu Feng (D. Xiao et al. 2017a, b) curated a subset of medical images from Kaggle EyePACS for early DR prediction using a CNN. The study focused on 800 eyes, reserving 200 for dedicated model testing.
Furthermore, DIARETDB1 and DIARETDB0 have gained prominence as frequently employed datasets in numerous studies focusing on the detection of DR, particularly notable since 2020. Somasundaram & Alli (2017) and Xu et al. (2017) have explored the combination of DIARETDB1 and DIARETDB0 for DR detection. However, DIARETDB1 and DIARETDB0 display inherent imbalance. Specifically, among the images, there are 89 with five standards, 84 featuring DR signs, and 130 comprising 20 measures, with 110 images depicting DR signs.
Additionally, various exclusive datasets mentioned in Table 4 are accessible upon request through the respective authorities. These datasets play a significant role in DR detection, including the Tianjin Medical University Metabolic Diseases Hospital dataset, RIM-ONE, RoDR, FIRE, CLEOPATRA, Jichi Medical University dataset, Moorfields Eye Hospital datasets, IDRID, FAZ, SGHS Hospital, Singapore National DR Screening Program, Lotus Eye Care Hospital Coimbatore, Department of Ophthalmology, Kasturba Medical College, ViCAVR Database, IDRID Dataset, and Manipal, India (KMCM). Considering the imbalances in most datasets and the necessity to align image dimensions with the model's requirements, image preprocessing becomes imperative. The subsequent section provides a comprehensive review of techniques applied to fundus images to augment the models' performance.
3.2 Pre-processing techniques
Pre-processing techniques are vital in standardizing and enhancing data quality in image processing. In medical imaging, these methods, including normalization and spatial transformations, ensure consistency and enable accurate diagnostic analysis. Image smoothing, noise reduction, and alignment contribute to refining medical images and improving clarity for precise evaluations. Medical image pre-processing utilizes 3-dimensional medical images obtained from Magnetic Resonance Imaging (MRI) or Computed Tomography (CT) to improve the overall quality of the image, which is achieved through various operations such as noise removal, contrast enhancement (CE), and edge detection. The pre-processed image enhances visualization for the network by making the image brighter and more precise and considering the Field of View (FoV). Multiple image processing techniques are available to enhance image quality. In this context, the authors have illustrated contrast enhancement (CE), green channel extraction, illumination correction, noise removal, and histogram equalization.
-
1.
Contrast Enhancement: These techniques aim to modify images' relative brightness and darkness, improving their quality and visibility, as shown in Fig. 10. Contrast and tone adjustments in the image are achieved by mapping grey levels to new pixels through a grey-level transform. Grayscale images can undergo CE using suitable techniques. Local CE techniques, or histogram-based contrast techniques, distribute brightness evenly across the entire image. This approach enhances the darker portions of the image without over-exposing the brighter regions (Joshi & Karule, 2018).
Fig. 10 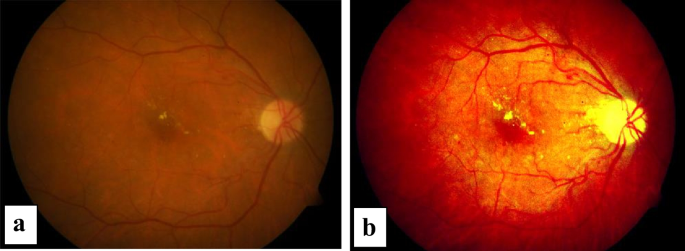
Contrast enhancement (a) Original image (b) Image corrected using contrast enhancement

Local contrast techniques become relevant due to the potential degradation of photograph quality by histogram equalization, which tends to over-enhance specific areas. This over-enhancement can result in information loss in the image's over-enhanced and darker parts. Several other equalization techniques aim to improve contrast and illumination for the further analysis and enhancement of small details in the image. Among these techniques, CLAHE (Contrast Limited Adaptive Histogram Equalization) is a popular choice in biomedical image processing. CLAHE is considered efficient in producing a precise pattern that is more visible, making it a valuable tool in this domain (Yamuna & Maheswari, 2013).
-
2.
Illumination Correction: The objective of the illumination correction technique is to eliminate uneven illumination in the image, which may arise from factors like vignetting or the orientation of the image surface, as shown in Fig. 11. Illumination correction can be implemented through prospective correction and retrospective correction methods. This technique primarily focuses on background correction to ensure a more even illumination across the image.
Fig. 11 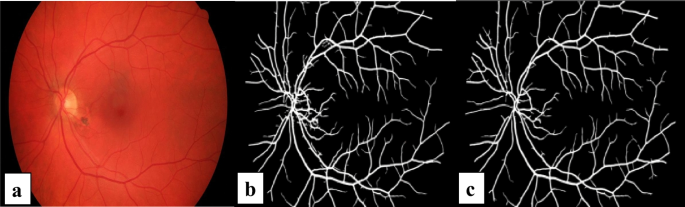
Illumination correction (a) original image (b) blood vessel segmentation without illumination correction pre-processing (c) blood vessel segmentation with illumination correction pre-processing

-
3.
Contrast Stretching: This technique improves image quality and contrast by expanding the intensity value range, commonly known as contrast stretching or normalization. Through this adjustment, the pixels of the image are modified to ensure that the features become visible within the displayable range (Dissopa et al. in 2021).
-
4.
Noise Removal: The images obtained from MRI or CT scans exhibit blurriness in their unprocessed state, characterized by hazy and blurry pixels commonly called blurred noise (Aurangzeb et al., 2021). Various types of noise, such as salt and pepper, Poisson, Gaussian, and speckle, may be present in medical images. Different filters can be applied according to the nature of the noise to enhance the image quality, as outlined in Table 5.
-
o
4.1. Gaussian Noise:—Due to the regularity of the probability density function (PDF) associated with this type of noise, gaussian noise is also known as the gaussian distribution (Patidar et al., 2010). The Gaussian random variable (k) PDF can be represented using Eq. (1).
$$P\left(k\right)=\left(\frac{1}{\sigma \sqrt{2\pi }}\right){e}^{{-(z-\mu )}^{2}/{2\sigma }^{2}}$$(1)k= grey level, μ= means of an average value of k, σ= standard deviation
-
o
4.2. Impulse (salt and pepper) Noise:—This noise can arise from sudden and shape changes in the image signal. Therefore, this type of noise is considered to be signal-dependent, and it is multiplied by the image values (Al-amri et al., 2010). The PDF is represented by Eq. (2).
$${\text{p}}\left(z\right)\left\{=\begin{array}{cc}{p}_{a}& z=a\\ {p}_{b}& z=b\\ 0& otherwise\end{array}\right.$$(2)a and b represent the grey levels. If b is measured as higher than a level, b is depicted as a light spot in the image, while level a is represented as a dark spot.
-
o
4.3. Poisson Noise:—Photon noise can be considered synonymous with Poisson noise. Poisson, or photon noise, occurs when the sensor does not receive sufficient photons to provide statistical information (Al-amri et al., 2010).
-
o
4.4. Speckle Noise:—The speckle noise can also be presented using Eq. (3).
$$k=lm+n*lm$$(3)\(k\) is referred to as speckle noise distribution, and \(lm\) as an input image. The uniform noise signal(N) comprises the mean \(O\) and variance \(V\). (Al-amri et al., 2010). The cause of this noise is the lucid processing of data spread across numerous distributed locations.
-
o
4.5. Uniform Noise:—The pixels of the image appear quantized to various effective pixels for some reason. This issue results in uniform noise following a uniform distribution. The PDF of the uniform distribution is represented using Eq. (4).
$$P\left(z\right)=\left\{\begin{array}{cc}\frac{1}{b-a}& if a\le z\le b\\ 0& otherwise\end{array}\right.$$(4)
Table 5 Details of Noise and filter -
o
-
5.
Clipping and Thresholding: Image Clipping is a specific case of contrast stretching (Alhussein et al., 2020), and thresholding is regarded as an image segmentation technique where the image pixels are modified to acquire pixel values rapidly. In thresholding, the grayscale or color image is converted to binary, i.e., 0 or 1.
-
6.
Histogram Equalization: An image's histogram illustrates the occurrence of each grey level. Histogram equalization involves redistributing the image's grey levels to achieve a uniform histogram (Mishra et al., 2020). Specific grey-level ranges are emphasized through histogram matching or histogram specification.
Retinal fundus images undergo pre-processing using the abovementioned techniques (Fig. 12) and additional existing algorithms to enhance image quality to aid diagnosis. Various researchers (Mumtaz et al. 2018; Zhou et al. 2017a, b; Vega et al. 2015) have applied diverse techniques in their studies, reflecting the summary of pre-processing methods employed in the selected articles for review.

Image pre-processing techniques for medical images
The inherent low contrast of the image poses challenges in identifying the blood vessels' network and detecting the progression of DR. Consequently, CE is employed to improve image contrast by extracting the green channel of the retinal fundus image. The pre-processing comprises CE, brightness preserving dynamic fuzzy histogram equalization (BPDFH), and decorrelation stretching. BPDFHE introduces a few additional steps to restore image quality by implementing the CE technique (Joshi & Karule, 2018). Illumination correction is typically performed after applying the CE technique to enhance the image's luminosity. Another issue, known as "vignette," leads to reduced brightness along the image boundary. Illumination equalization is applied to address this problem, and the CLAHE method is utilized to reduce noise (Joshi & Karule, 2018).
Gaussian filtering provides an alternative method to enhance the image's smoothness and eliminate unnecessary noise. The image is resized and adjusted in resolution to meet the required standards. The optic disc (OD) removal and masking are necessary for accurate DR lesion diagnosis. In most studies, the green channel is often extracted primarily for further processing. Zhou et al. (Zhou et al. 2017a, b) precisely select the green channel through pre-processing to detect MAs. However, augmentation techniques have proven helpful in addressing the class imbalance within the dataset (Mookiah et al., 2021). Various image rotation, flipping, and mirroring methods generate synthetic images for the minority class. Augmentation involves processes such as mirroring, contrast scaling, and rotation. According to Meindert Niemeijer et al. (Niemeijer et al., 2010), authors employed augmentation by rotating images from 0 to 360 degrees and translating them by distances ranging from -10 to 10 pixels.
Additionally, scaling from 85 to 115% was applied to synthesize the minority class in the DiaretDB1 dataset. Moreover, Storath and Weinmann (Storath & Weinmann, 2018) proposed a fast-filtering algorithm for denoising images using unit circle values based on arc distance median. The proposed median filter is robust, preserves values, and maintains edges, making it the most widely employed filtering tool for smoothing real-valued data.
The authors (Dissopa et al., 2021) conducted a comparative study on pre-processing techniques for CE and illumination correction in DR retinal images. The authors scrutinized dividing methods using median and quotient methods employing homomorphic filtering. The authors also explored CLAHE and the polynomial grey level transformation operator to enhance CE in fundus images. Dissopa et al. (Dissopa et al., 2021) concluded that the division method employing median filtering is the most successful technique for estimating the background in the red component based on visual and statistical evaluations. Nevertheless, (Satpathy et al., 2016) compared various filters, including the box filter, Gabor filter, median filter, and Gaussian filter, for filtering medical images. Their survey revealed that the median filter produced better outcomes, as evidenced by the estimated peak signal-to-noise ratio (PSNR) values for Gaussian noise.
Moreover, (Satpathy et al., 2016) compared various filters, including the box filter, Gabor filter, median filter, and Gaussian filter, to filter medical images. Based on the estimated PSNR values for Gaussian noise, the survey revealed that the median filter exhibited superior outcomes. Several studies from selected articles have applied diverse pre-processing techniques to enhance their results. Table 6 presents the research objectives along with the corresponding pre-processing methods and their achieved performance. The techniques are denoted as T1 to T6.
3.3 Diagnostic modalities for DR detection
DR can be evaluated through diverse imaging modalities, each offering distinct insights into the disease. Fundus photography provides a broad, two-dimensional perspective facilitating the identification of tumors and hemorrhages. Optical Coherence Tomography (OCT) delivers high-resolution cross-sectional views of retinal layers, aiding in detecting structural changes and fluid accumulation. The non-invasive Optical Coherence Tomography Angiography (OCTA) technique produces detailed vascular maps crucial for assessing microvascular alterations by visualizing blood flow in the retinal and choroidal vasculature, as shown in Fig. 13.

DR Diagnostic Modalities a) Fundus Images of the normal eye with optic disk and blood vessel b) An OCT Angiogram of a healthy eye reveals intricate macular microvasculature, showcasing the foveal avascular zone at its center (Pichi et al. 2017) c) A full-thickness macular hole is evident in the Time-domain OCT scan (Salchow et al. 2006)
OCT presents a robust capability for producing high-resolution cross-sectional images, enabling early detection of microstructural changes characteristic of DR while also allowing for precise quantitative measurements of retinal thickness and morphology. Specifically, the introduction of 3D OCT enhances these capabilities further. By capturing volumetric data, 3D OCT provides a more comprehensive assessment of retinal structures, facilitating the detection of subtle changes and offering improved visualization compared to traditional 2D OCT scans. However, despite its advantages, OCT has its drawbacks, including its higher cost, longer imaging acquisition times, and the need for specialized equipment and expertise. On the other hand, fundus imaging provides a wide-field view of the retina, offering a comprehensive assessment of retinal abnormalities associated with DR. Fundus images are relatively cost-effective, quick to capture, and widely available in most eye care settings. However, they lack the detailed structural information and quantitative measurements that OCT, mainly 3D OCT, offers.
The application of 3D OCT is advisable when necessitating structural visualization, quantitative analyses, and precise monitoring of disease progression in diabetic retinopathy. The volumetric data provided by 3D OCT allows for more accurate assessments of retinal thickness and morphology changes over time. In contrast, fundus imaging may be used when prioritizing cost-effectiveness, accessibility, and ease of implementation, particularly in settings constrained by resources or when evaluating peripheral retinal changes in diabetic populations. Figure 14 illustrates some of the different and common advantages and disadvantages of OCT and fundus modalities for DR detection.

Advantages and disadvantages of OCT and fundus images for DR detection
Recognizing the significance of each modality in DR diagnosis, researchers (Elsharkawy et al. 2022; Pichi et al. 2017; Z. Sun et al. 2021) have explored the implementation of OCT and OCTA for detecting DR. Elsharkawy et al. (Elsharkawy et al. 2022) proposed a system for automatic segmentation of retinal layers in 3D OCT scans using prior share knowledge, texture feature, and a Markov-Gibbs random field model for DR diagnosis. Cumulative distribution function descriptors represent image-derived features, feeding into an artificial neural network for layer-wise classification. The proposed approach achieves an impressive accuracy of 96.88%. Additionally, Zang et al. (Zang et al. 2022) conducted a study involving 456 OCT and OCTA volumes obtained from 50 healthy individuals and 305 patients with diabetes. A framework trained on volumetric OCT and OCTA achieved a high AUC of 0.96 ± 0.01 for referable DR (rDR) and 0.92 ± 0.02 for vision-threatening DR.
Another retrospective study (Sandhu et al. 2020) was conducted at an academic medical center in the United States to collect demographic and health data using OCT and OCTA modalities. Applying ML to OCT and OCTA features, combined with clinical data, achieved an accuracy of 92%, sensitivity of 95%, specificity of 98%, and an AUC of 0.92 for NPDR classification, compared to clinical grading. Another study (Ahmed Sharafeldeen et al. 2023) focuses on a computer-aided diagnostic system for DR using 3D OCT features, computing thickness and first-order reflectivity per retinal layer. Classification is achieved by backpropagation neural networks, demonstrating performance with 94.74% ± 5.55% accuracy in tenfold cross-validation on 188 cases.
Moreover, the segmentation of retinal OCT layers is done in different studies to precisely quantify retinal thickness and identify specific pathological changes associated with DR (Galdran et al., 2022; Hao et al. 2021). Segmentation techniques in OCT imaging can precisely detect and measure the retinal nerve fiber layer (RNFL), ganglion cell layer (GCL), inner plexiform layer (IPL), and inner nuclear layer (INL), all of which are frequently impacted by DR. Despite the implementation of 2D segmentation algorithms, they fail to fully leverage contextual information and exhibit inconsistencies when applied to 3D applications. (Wang et al., 2023). In their work, (Wang et al., 2023)introduced a novel graph pyramid structure incorporating construction elements derived from graph theory alongside a segmentation network employing 3D convolution. The authors introduced a segmentation network employing 3D convolution and a novel graph pyramid structure with graph-inspired building blocks. They collected and manually corrected a large OCT segmentation dataset comprising normal and diseased cases. Their proposed method notably reduced segmentation errors from 38.47% to 11.43%. Another study (Galdran et al., 2022) highlighted that retinal vessel segmentation remains challenging, notably when test images differ significantly from training data, suggesting domain adaptation techniques are needed. The study demonstrates that a simplified version of a standard U-Net achieves comparable performance to more intricate techniques with significantly fewer parameters. Additionally, a cascaded extension (W-Net) achieves outstanding results on various datasets using substantially fewer learnable weights than previous methods (Galdran et al., 2022).
Moreover, a novel method is proposed for the segmentation of retinal blood vessels to address the challenge of low accuracy encountered during the removal of small blood vessels from retinal images (Hao et al. 2021). The method integrates local and global enhancement techniques alongside a multi-scale linear detector, combining a multi-scale linear detector with local and global enhancement techniques. The response functions at different scales are fused to obtain the final retinal vascular structure. Experimental results on the STARE and DRIVE databases demonstrate high segmentation accuracy, with average vascular accuracy rates of 96.62% and 96.45% and average true positive rates of 75.52% and 83.07%, respectively. This approach yields improved blood vessel segmentation results, indicating its potential for enhancing the accuracy of OCT image segmentation (Hao et al. 2021).
Similarly, segmentation is also significant in fundus imaging for DR diagnosis. In fundus images, Automated segmentation algorithms can assist clinicians in identifying and quantifying these DR-related features, providing valuable information for disease staging and monitoring (Li et al. 2022). Additionally, segmentation techniques can help differentiate between different lesions, such as distinguishing between hard and soft exudates or identifying the presence of clinically significant macular edema (Saranya et al., 2022). This level of detail enables more accurate diagnosis and personalized treatment planning for patients with DR. Additional studies on DR detection utilizing OCT and OCTA are summarized in Table 7.
Each modality carries unique significance, contributing to improved DR detection based on the scenario and data availability. While OCT and OCTA have demonstrated promising results in recent years, excelling in retinal layer segmentation and neovascularisation detection, fundus images are widely accessible and abundant. They are extensively used for diagnosis and training deep learning models for DR detection. Table 8 provides a detailed overview of the appropriate DR modalities and their applications, offering comprehensive insights into their utilization.
3.4 Blood vessels segmentation methods
Among the structural components of the retina, there exists a variation in the lengths and widths of the retinal blood vessels. The initial stage in acquiring diagnostic data for the early detection of various retinal disorders involves precisely segmenting blood vessels. Consequently, multiple techniques for detecting and segmenting retinal blood vessels have been presented recently, as discussed in Table 9.
3.5 Retinal optic disc detection methods
An essential step in establishing systems for the automated diagnosis of various ocular illnesses involves the detection of OD. Chaudhuri et al. (Chaudhuri et al. 1989) introduced a novel template-based method for segmenting the OD from digital retinal images. Following the Circular Hough Transform, this method utilized edge detection and morphological approaches to approximate the circular OD boundary. Subsequently, the retinal vasculature is sectioned, and the vessel positions are processed to filter, highlighting the features of the vessels near the OD. Authors (Staal et al. 2004) proposed a new method for extracting ODs and exudates with adjustable and stable thresholds in another approach. Soares et al. (Soares et al. 2006) also tested a novel computerized segmentation approach for stereo-color images within the glaucoma series dimension. Moreover, Mendonça and Campilho (Mendonça and Campilho 2006) employed a two-step technique to identify the border of the OD for accurate boundary recognition.
The iterative component analysis is employed, followed by the iterative thresholding procedure to establish the approximate location of the OD center. This integrated approach provides a starting point for determining its precise boundaries. Finally, the accurate border of the OD is determined using an implicit active contour model based on a geometric model. Geometric models differ from parametric models because they are less dependent on the image gradient and less sensitive to the initial contour's placement. Consequently, they can be more effectively applied to objects with weak borders, such as the OD (Mendonça and Campilho 2006).
Furthermore, several approaches with disc restrictions using the OD and cup borders are available (Ricci and Perfetti 2007). A deformable representation of regional statistics is utilized to detect the borderline of ODs with manifestations in color space and the expected cup regularity. A habitual OD parameterization system evaluates the regions derived from monocular retinal pictures (Franklin and Rajan 2014). However, it is essential to note that this evaluation does not offer a method for identifying eye conditions.
Youssif et al. (Youssif et al. 2008) applied a precise method for OD segmentation, detecting the OD's image dissimilarity and round shape through spherical conversion. However, the proposed method struggled with separating the diagonally detected OD border for an extended period. In another approach, Meindert Niemeijer et al. (Niemeijer et al., 2009) proposed a novel template-based method for OD segmentation using digital fundus retinal images. This method utilizes the circular hough transform, employing morphological and border identification strategies to obtain a rough estimate of the spherical OD boundary. However, it requires additional pixels positioned inside the OD as a starting point.
Furthermore, Welfer et al. proposed an algorithm based on analytical methods (Welfer et al. 2010) capable of identifying red and bright lesions without pre-processing to detect DR-related abnormalities in fundus pictures. Authors introduced a feature extraction technique (Khaing et al. 2022) that captures the universal distinctiveness of fundus images and distinguishes standard images. However, the method's performance is not evaluated with a large set of databases. The summary of OD detection methods is presented in Table 10.
3.6 Supervised and unsupervised model for DR detection
Handling vast data is a significant challenge for many enterprises and established sectors. The complexity of analyzing this information is formidable. To address this challenge, ML techniques, particularly DL algorithms, are crucial in advancing contemporary technologies and enabling in-depth analysis. SL demonstrates high potential and can solve many problems, with labeled data guiding the algorithm's training. Conversely, UL algorithms hold great promise for extracting hidden patterns from unlabelled data, providing insights into complex relationships within the dataset. Figure 15 illustrates the categorization of SL and UL methods.

Categorization of Supervised and Unsupervised DL
3.6.1 Using supervised deep learning
Supervised DL algorithms offer the advantage of creating models from unstructured labeled data. DL has demonstrated promising results in various natural language comprehension tasks, such as subject categorization, medical picture analysis, sentiment analysis, question answering, and language translation (Alyoubi et al. 2020). With its deep architecture, DL can address substantially more complex AI problems. DL employs methods like autoencoders, DBN, CNN, and RNN for feature representation. Supervised DL methods have outperformed traditional ML algorithms in the analysis of medical images (Table 11).
Consequently, several automated and computer-assisted systems have been developed for identifying DR, including Artificial Neural Networks (ANN), CNN, Recurrent Neural Networks (RNN), and hybrid models, as summarized in Table 12. Moreover, Within the realm of supervised deep learning approaches, the widespread success of Transformers in natural language processing has prompted numerous researchers (Huang et al. 2022; Lian and Liu 2024; Nazih et al. 2023; Yaoming Yang et al. 2024) to investigate their suitability in clinical applications, particularly in recognizing various ophthalmic diseases. Table 12 provides insights into recent studies on DR detection using vision transformers.
Artificial neural network
Early detection of DR is critical as it is directly related to vision loss. For many patients, it is challenging and exhausting for medical experts to give the whole emphasise on the diagnosis of DR as well as to provide proper medical treatment. On the other hand, if DR is not detected early, the medical treatments are also more expensive for the patients in their later stages. Therefore, early diagnosis of DR is very much essential. An increasing variety of complex real-world issues have been tackled with ANNs. (Dutta et al. 2018). These neural networks have a significant advantage in solving complex problems for conventional technologies(Anas Bilal et al. 2022a, b, c). ANN is a networked collection of artificial neurons that processes information using a mathematical or computational model. ANNs mimic the human brain's information processing, learning from examples and detecting complex features in data sets. ANNs, with their nonlinear, distributed structure, operate without explicit instructions, making them effective for feature extraction and DR classification (Williamson et al. 1996).
Convolutional neural network (CNN)
CNN, a type of neural network, extracts higher representations of image content, featuring input, hidden, and output layers for image and video recognition. Comprising convolutional, pooling, and fully connected layers, CNN utilizes activation functions and dropout layers for effective processing, requiring less pre-processing than other machine or DL techniques (Mazlan et al. 2020). Table 11 discusses various studies on retinal lesion detection using CNN and its variants, presenting the information in a more structured form.
Feed forward and recurrent neural network
Neural networks, including Feed Forward Neural Network (FNN) and RNN, vary in architecture. FNNs (Chakraborty et al. 2020) process information unidirectionally through layers, while RNNs use feedback loops, enabling real-time and time-series data analysis (W. Zhang et al. 2019). RNNs stand out for their memory.
Hybrid ML-DL model
Several hybrid or ensemble models have been employed in DR screening to enhance model performance. This section discusses how ML techniques can be integrated as a layer within DL models to improve performance further. Various applied methods in this context are explored here.
S. Qummar et al. (Qummar et al. 2019) introduced an ensemble DL model for DR screening, utilizing five deep CNN models—Inceptionv3, Dense-121, Resnet-50, Dense-169, and Xception. Trained on the Kaggle dataset, the model detects various DR stages, achieving an early-stage detection accuracy of 80.8%. The ensemble method exhibits precision, specificity SP, recall, and F-scores of 63.8%, 86.7%, 51.5%, and 53.7%, respectively, addressing the challenge of manual DR screening by experts. Furthermore, Gupta et al. (Gupta et al. 2022) introduced a cost-effective smartphone-based DR detection technique, addressing the limitations of fundus cameras. Their hybrid method, integrating artificial neural networks (ANN) and deep convolutional neural networks (DCNN) within the social sky-driver (SSD), optimizes weight values for enhanced DR screening performance. The proposed system, tested on APTOS-2019-Blindness-Detection and EyePACS datasets, outperforms state-of-the-art algorithms, demonstrating promising results in smartphone-based DR detection.
Continuing the exploration of a hybrid method for DR detection, (Sreng et al., 2015) employ contrast and color illumination methods for pre-processing, followed by detecting fovea and red features. Lesions with blood vessels are identified, noise is eliminated, and HM is automatically detected. (Seoud et al., 2014) propose a method using CE and green histogram for image pre-processing, employing morphological flooding. Feature extraction involves various characteristics, and a random forest classifier achieves automated classification of both MAs and HM in fundus images.
Furthermore, (Khaing et al. 2022) present a fully automatic hybrid method with a smartphone-based approach, utilizing mobile cameras and standardized equipment datasets. The technique employs the exclusion method for analyzing vessel structure and integrates the active contour method with the hierarchical level set method (HLM) for OD segmentation. Achieving 98% OD localization accuracy for mobile camera datasets, the proposed method demonstrates impressive average precision and recall of 92.64% and 82.38%, outperforming state-of-the-art algorithms in OD segmentation performance.
3.6.2 Unsupervised DL methods
UL presents many undiscovered opportunities, mainly through clustering techniques that organize anonymous data into meaningful structures. These methods leverage knowledge discovery to autonomously group data without supervision. Deep clustering methods, such as the DEC algorithm introduced by (Ren et al., 2019), combine the strengths of DL and clustering, showcasing enhanced clustering capabilities. (Enguehard et al., 2019) Further emphasize DEC's potential, highlighting its ability to fill gaps left by supervised methods. Several algorithms have significantly influenced the fundamental processes of DEC. Additional UL algorithms for DR detection and lesion segmentation are detailed in Table 13.
Autoencoder
Autoencoders, a type of FNN, represent both inputs and outputs as identical, trained for unsupervised representation learning. They comprise encoder, code, and decoder components. Autoencoders compress input into a latent feature space and reconstruct the output. Autoencoders fall under UL, operating without explicit data labels, and despite generating their labels, they are classified as Semi-SL techniques.
Clustering with deep learning
The DEC algorithm is a hybrid approach that merges clustering and DL functionalities, yielding superior outcomes compared to UL processes. Through cluster assignment and feature learning, DEC algorithms unlock additional opportunities and bridge the gap typically addressed by SL methods.
Autoencoder based DEC
The autoencoder with DEC can implemented using a feature space to transform actual data into latent space features. The pre-training and fine-tuning operations are influenced during the training phase of the autoencoder. The clustering algorithm determines initial parameters such as convergence criteria and cluster centers during pre-training. These parameters are utilized in different sequences during fine-tuning (Kampffmeyer et al., 2019). DEC efficiently utilizes autoencoders for data reconstruction, and the DL network, such as CNN, is employed to study low-dimensional properties. The DEC implementation involves two stages: initialization of the autoencoder and pre-processing of the data in the first stage and optimization of parameters using an iterative technique and auxiliary target distribution computation in the second stage.
In the second stage, a gradient loss function is applied to calculate backpropagation, considering the t-distribution's degree of freedom \((\alpha =1\)). After achieving the clustering score (CS), the algorithm progresses to find the cluster centers. The Kullback–Leibler (KL) loss is employed to calculate clustering and reconstruction losses. The clustering loss \({L}_{c}\) is based on the calculated gradient loss function. During the reconstruction, the loss \({L}_{R}\) is determined by the DNN. The learning parameters are then updated using these losses, forming the training network for subsequent sessions. As a Stacked Autoencoder (SAE), DEC simultaneously implements clustering and DL methods for effective UL processes. The architecture of autoencoder-based DEC is shown in Fig. 16.

Autoencoder-based DEC
Clustering
UL plays a pivotal role in clustering, aiming to derive meaningful connections between data points with minimal supervision. Clustering, categorized into supervised, unsupervised, and semi-supervised types (Fig. 17), serves crucial practical purposes across applications such as information retrieval, text mining, web analysis, spatial databases, and medical diagnosis. Examining parameters in clustering algorithms involves considerations of clustering goals, types of data items, and data accessibility. Noteworthy clustering algorithms in research communities include Hierarchical Agglomerative Clustering (HAC), Density-based Hierarchical Agglomerative Clustering (DHAC), and K-Means (Camastra and Vinciarelli 2008).

Clustering (a) Dataset Sample (b) Unsupervised Clustering (c) Semi-Supervised Clustering d) Supervised Clustering
Hierarchical clustering
Hierarchical clustering creates a tree-like structure, often called dendrograms, by assessing relationships between data points. It encompasses two approaches: agglomerative, where clusters are successively merged, and divisive, which involves iteratively splitting clusters. Unlike K-Means, hierarchical clustering does not require a predefined number of clusters. The method evaluates relationships between data elements, utilizing centroids in an optimization algorithm. The effectiveness of the clusters can be assessed using different fitness functions and criteria.
In summary, the choice between supervised and unsupervised DL DR detection hinges on factors such as the availability of labeled data, the desire for high accuracy, and the exploration of data patterns. While supervised methods aim for precision with labeled datasets, unsupervised methods offer flexibility in scenarios with limited annotations, albeit with challenges in evaluation and interpretability.
4 Discussion & critical analysis
DR is a prevalent eye disease and a leading cause of global blindness. Early detection is crucial to prevent vision loss, making regular patient screening imperative. This study comprehensively reviews supervised and unsupervised DL methods for early DR detection. While numerous reviews exist on automated DR detection (Alyoubi et al. 2020; A. Bilal et al. 2021a, b, c; Cleland et al. 2023; Kar et al. 2021; Mayya et al. 2021; Subramanian et al. 2022), there is a scarcity of reviews explicitly addressing the supervised and unsupervised DL techniques. Furthermore, no reviews have systematically compared the performance of unsupervised and supervised DL methods. By addressing this gap, the review study offers an illustrious understanding of the strengths and limitations of supervised and unsupervised DL techniques for DR detection. The systematic comparison presented in this review contributes to a more informed decision-making process when selecting an appropriate DL approach for early DR detection, ultimately enhancing the efficiency and accuracy of diagnostic systems. The study analyzes 103 articles retrieved from four databases, employing diverse queries, papers, years, and keyword-based filters to extract relevant manuscripts. The review explores publicly available and exclusive datasets for automated DR detection, detailing image processing techniques such as CE, noise removal, optic disc and blood vessel segmentation, green channel extraction, and more to enhance image quality.
The author utilized open access or comprehensive datasets for DR detection in the selected manuscripts. Many researchers (Z. Xiao et al. 2015; Su Wang et al. 2017; Tan et al. 2017; Takahashi et al. 2017; Takahashi et al. 2017; Fumero et al. 2011) have assembled datasets from fundus images collected at specific hospitals or through particular camera devices. The review highlights challenges associated with the use of exclusive datasets. Firstly, classification models trained on such datasets may not generalize well to different data modalities. Given the limited scope of data collected from one or two hospitals with specific devices, it is essential to ensure that the detection of DR applies to various data modalities. Therefore, collecting multimodal data is recommended, considering the diversity of medical devices used in DR diagnosis. Secondly, the small number of images in exclusive datasets can lead to lower model performance. It is noted that exclusive datasets tend to exhibit lower accuracy and other metric performances compared to open-access datasets.
Conversely, numerous researchers (Naqvi et al. 2015; Kusakunniran et al. 2018; Budak et al. 2017; Chudzik et al. 2018; Fraz et al. 2017; X. Li et al. 2018; Shuangling Wang et al. 2015) have focused on automated DR detection using open access datasets. However, these datasets often encounter a class imbalance problem. Notably, most publicly available datasets exhibit this issue. For instance, the Kaggle dataset comprises 35,426 images categorized into Mild, Moderate, Severe, No DR, and Proliferative signs. This dataset is highly imbalanced, with the majority class containing 25,810 images, making up 73% of the total, while the minority class consists of 9,316 images. Researchers working with imbalanced datasets typically employ techniques such as downsampling or augmenting the minority class to enhance the model's performance.
Several studies (Simonyan & Zisserman, 2015; Takahashi et al. 2017) have employed Data Augmentation (DA) techniques to synthesize data points from minority classes. However, it is recommended that DA be applied during training rather than testing. Exclusive datasets comprising images from different hospitals may exhibit noisy pixels or features, making pre-processing crucial for enhancing model performance. Image resizing is a pre-processing method that can remove noisy features, and cropping is an effective technique for eliminating extraneous pixels that do not contribute to classification. Additionally, resizing images can decrease computational time by converting high-resolution images to low-resolution. Green channel extraction is another applied technique, extracting the green channel from the RGB channel and facilitating the easy identification of blood vessels, as outlined in Table 6.
Contrarily, CE serves to enhance picture quality and sharpen fundus images. Nevertheless, these techniques come with certain limitations. Similarly, image augmentation methods generate synthetic data points, potentially introducing bias in the model's performance when confronted with real-life DR detection. Image cropping may result in the loss of crucial information. Therefore, comparing the model's performance with and without preprocessing is advisable for a comprehensive evaluation. Various supervised deep-learning methods for diabetic retinopathy detection are discussed in Table 12. However, unsupervised techniques demonstrate significant potential for extracting hidden patterns.
CNNs dedicated to image-related tasks are widely used and exhibit remarkable performance records. GAN performed exceptionally well in unsupervised classification, but their application in DR is limited. Moreover, no specific model is universally suitable for DR classification. Table 14 compares both models, aiding in understanding their performance across various applications, contingent upon the data's variability and dimension. Consequently, scholars face diverse challenges in exploration and should prioritize the model's explainability.
5 Future scope and open challenges
There is still a need for improvement in the existing approach to enhance performance in DR detection. Thus, this section addresses the future scope and open challenges researchers should focus on to enhance DR classification performance. The challenges that need to be addressed include-
-
1.
Explainability and Interpretability: The interpretability of DL models in DR detection is a pressing challenge. Enhancing the explainability of model predictions is crucial for gaining the trust of healthcare practitioners. Future studies should aim to develop models capable of providing clear and understandable concerning their decision-making processes.
-
2.
Integration of Multimodal Data: Integrating data from various imaging modalities, such as OCT and fundus photography, poses a challenge. Future studies should explore methods to effectively integrate and leverage multimodal data for a more comprehensive understanding of DR progression and severity.
-
3.
Virtual and Augmented Reality for Training and Visualization: The application of Virtual and Augmented Reality (VR/AR) in DR studies will evolve to enhance medical training and visualization. Future directions include the development of immersive VR/AR platforms for training healthcare professionals in DR diagnosis and creating AR tools that allow practitioners to visualize retinal structures in three-dimensional space.
-
4.
3D Medical Imaging for Detailed Retinal Assessment: The future of DR detection will see advancements in 3D medical imaging techniques for more detailed and comprehensive retinal assessment. This includes the development of imaging technologies such as 3D OCT for capturing volumetric data, providing a deeper understanding of structural changes associated with DR.
-
5.
Wearables for Continuous Monitoring: Wearable devices will play a pivotal role in continuously monitoring individuals at risk of DR. Future directions involve integrating wearable technologies for real-time tracking of retinal health parameters. These wearables can provide early warnings and enable proactive management.
-
6.
Human-AI Collaboration in Clinical Decision-Making: Integrating AI models into clinical decision-making processes requires collaboration between healthcare professionals and AI systems. Future research should focus on developing frameworks for effective human-AI collaboration, ensuring that AI complements clinical expertise rather than replacing it.
6 Concluding remarks
DR stands out as a leading cause of global blindness, often remaining asymptomatic until reaching a severe stage. Early treatment of DR can effectively prevent vision loss. Consequently, various supervised DL models, such as CNN, DNN, BPNN, semi-supervised, and ensemble DL models, have been employed for automated DR detection. The superiority of DL models in image analysis within the DR detection domain is notable. However, a significant challenge persists due to the unavailability of labeled data in medical imaging.
The review delves into a literature survey on keywords associated with supervised and unsupervised methods from 2018 to 2023. One hundred and three articles were meticulously selected from four diverse databases, employing five specific filters—a process detailed further in the discussion section. Additionally, publicly and exclusively utilized datasets for DR classification studies are presented with their available links and essential details. Kaggle and DIARETDB1 emerge as the primary datasets across all included studies. Among various pre-processing techniques, green channel extraction followed by CE consistently yielded more accurate outcomes and was deemed a fundamental approach. Subsequently, the review comprehensively explores widely employed SL and UL techniques in DR detection, covering features and classification methods. A comparison of Unsupervised and Supervised methods for DR classification is presented in Table 13.
In the specific application context, the literature underscores a notable lack of emphasis on unsupervised methods for DR classification. Supervised DL methods exhibit superior performance when extensive training data is available. However, these methods rely heavily on labeled datasets, which are invaluable for real-time training and classification but demand substantial manual labeling efforts. In instances where labeled datasets are unavailable, the efficacy of supervised DL algorithms diminishes. Most studies have predominantly employed CNN-based DL models for DR detection. Nevertheless, CNNs are more adept at handling supervised problems with annotated or labeled data, necessitating the availability of large datasets for optimal performance. This review thoroughly explores the challenges inherent in medical images and DR detection, revealing a shift towards the emergence of unsupervised, semi-supervised, and hybrid learning approaches in medical imaging and DR detection.
While the presented reviews aim to cover a comprehensive spectrum, it is conceivable that the authors may have inadvertently omitted certain vital elements. This review emphasizes that while supervised DL methods excel with extensive labeled data, the attention to unsupervised methods is relatively scant, opening avenues for future exploration. This comprehensive study is valuable for scholars and academicians in DR detection. It sets the stage for upcoming research that advances unsupervised methodologies across various medical imaging domains, especially with emerging medical diseases. Future work will concentrate exclusively on UL methodologies across all medical imaging areas, particularly addressing emerging medical diseases.
Abbreviations
- ACC :
-
Accuracy
- AMD :
-
Age-related macular degeneration
- ANN :
-
Artificial Neural Network
- ARIA :
-
Automated Retinal Image Analysis
- AUC :
-
Area under the ROC curve
- BPNN :
-
Back Propagation Neural networks
- BPDFHE :
-
Brightness preserving dynamic fuzzy histogram equalization
- CE :
-
Contrast Enhancement
- CLAHE :
-
Contrast limited adaptive histogram equalization
- CNN :
-
Convolutional Neural Network
- CS :
-
Convergence State
- CT :
-
Computed Tomography
- DA :
-
Data Augmentation
- DBN :
-
Deep Belief Network
- DEC :
-
Deep Embedded Clustering
- DM :
-
Diabetes Mellitus
- DHAC :
-
Distributed hierarchical agglomerative clustering
- DL :
-
Deep Learning
- DNN :
-
Deep Neural Network
- DR :
-
Diabetic Retinopathy
- FAZ :
-
Foveal Avascular Zone
- FAZID :
-
Foveal Avascular Zone Image Database
- FIRE :
-
Fundus Image Registration dataset
- FNN :
-
Feed Forward Neural Network
- FoV :
-
Field of View
- FPPI :
-
False Positive per Image
- GAN :
-
Generative adversarial network
- HAC :
-
Hierarchical Agglomerative Clustering
- HM :
-
Hemorrhages
- IDF :
-
International Diabetes Federation
- IEEE :
-
Institute of Electrical and Electronics Engineers
- IDRID :
-
Indian diabetic retinopathy Image dataset
- KCM :
-
K-Means Clustering with MapReduce
- MAs :
-
Microaneurysms
- MIL :
-
Multiple Instance Learning
- ML :
-
Machine Learning
- NPDR :
-
Non-Proliferative Diabetic Retinopathy
- MLP :
-
Multilayer Perceptron
- MRI :
-
Magnetic Image Resonance
- MSE :
-
Mean Square Error
- OD :
-
Optic Disc
- PDF :
-
Probability density function
- PDR :
-
Proliferative Diabetic Retinopathy
- PPV :
-
Positive predictive value
- RAUNet :
-
Residual-Attention UNet
- RNN :
-
Recurrent Neural Network
- RMSE :
-
Root Mean Square Error
- ROC :
-
Retinopathy Open Challenge
- SL :
-
Supervised Learning
- SN :
-
Sensitivity
- SP :
-
Specificity
- SVM :
-
Support Vector Machine
- UL :
-
Unsupervised Learning
- WHO :
-
World Health Organization
References
Abbasi S, Tavakoli M, Boveiri HR, MoslehShirazi MA, Khayami R, Khorasani H, Javidan R, Mehdizadeh A (2022) Medical image registration using unsupervised deep neural network: A scoping literature review. Biomed Sig Process Control 73(December 2021):103444. https://doi.org/10.1016/j.bspc.2021.103444
Al-amri SS, Kalyankar NV, Khamitkar SD (2010) A comparative study of removal noise from remote sensing image 7(1):32–36. http://arxiv.org/abs/1002.1148
Alanazi A (2022) Using machine learning for healthcare challenges and opportunities. Informatics in Medicine Unlocked 30(February):100924. https://doi.org/10.1016/j.imu.2022.100924
Albo C, Sanchez G, Sellers B, Wolfel L, Mankad RN, Lee TJ, Sharma A, Melendez RF (2023) A survey of ophthalmologists in 52 cities in the Southern United States. Open Ophthalmol J 17(1):1–15. https://doi.org/10.2174/0118743641254729231031101350
Alfonso-Francia G, Pedraza-Ortega JC, Badillo-Fernández M, Toledano-Ayala M, Aceves-Fernandez MA, Rodriguez-Resendiz J, Ko SB, Tovar-Arriaga S (2022) Performance evaluation of different object detection models for the segmentation of optical cups and discs. Diagnostics 12(12). https://doi.org/10.3390/diagnostics12123031
Alhussein M, Aurangzeb K, Haider SI (2020) An unsupervised retinal vessel segmentation using hessian and intensity based approach. IEEE Access 8:165056–165070. https://doi.org/10.1109/ACCESS.2020.3022943
Alyoubi WL, Shalash WM, Abulkhair MF (2020) Diabetic retinopathy detection through deep learning techniques: A review. Informa Med Unlocked 20:100377. https://doi.org/10.1016/j.imu.2020.100377
An FP, Ma XM, Bai L (2022) Image fusion algorithm based on unsupervised deep learning-optimized sparse representation. Biomed Sig Process Control 71(PB):103140. https://doi.org/10.1016/j.bspc.2021.103140
Association of American Medical Colleges (2023) 2022 physician specialty data report: executive summary. 1–5. https://www.aamc.org/data-reports/data/2020-physician-specialty-data-report-executivesummary%0Ahttps://www.aamc.org/data-reports/data/2020-physician-specialty-data-report-executivesummary%0Ahttps://www.aamc.org/media/50476/download. Accessed 16 Oct 2023
Atwany MZ, Sahyoun AH, Yaqub M (2022) Deep learning techniques for diabetic retinopathy classification: A survey. IEEE Access 10:28642–28655. https://doi.org/10.1109/ACCESS.2022.3157632
Aurangzeb K, Aslam S, Alhussein M, Naqvi RA, Arsalan M, Haider SI (2021) Contrast enhancement of fundus images by employing modified PSO for improving the performance of deep learning models. IEEE Access 9:47930–47945. https://doi.org/10.1109/ACCESS.2021.3068477
Bala MP, Vijayachitra S (2014) Early detection and classification of microaneurysms in retinal fundus images using sequential learning methods. Int J Biomed Eng Technol 15(2):128–143. https://doi.org/10.1504/IJBET.2014.062743
Bengani S, Angel Arul Jothi J, Vadivel S (2021) Automatic segmentation of optic disc in retinal fundus images using semi-supervised deep learning. Multimed Tools Appl 80(3):3443–3468. https://doi.org/10.1007/s11042-020-09778-6
Bhardwaj C, Jain S, Sood M (2021) Transfer learning based robust automatic detection system for diabetic retinopathy grading. Neural Comput Appl 33(20):13999–14019. https://doi.org/10.1007/s00521-021-06042-2
Bidwai P, Gite S, Gupta A, Pahuja K (2024) Multimodal dataset using OCTA and fundus images for the study of diabetic retinopathy. Data Brief 52:110033. https://doi.org/10.1016/j.dib.2024.110033
Bilal A, Sun G, Mazhar S (2021a) Survey on recent developments in automatic detection of diabetic retinopathy. J Fr d’Ophtalmol 44(3):420–440. https://doi.org/10.1016/j.jfo.2020.08.009
Bilal A, Sun G, Li Y, Mazhar S, Khan AQ (2021b) Diabetic retinopathy detection and classification using mixed models for a disease grading database. IEEE Access 9:23544–23553. https://doi.org/10.1109/ACCESS.2021.3056186
Bilal A, Sun G, Mazhar S (2021c) Diabetic retinopathy detection using weighted filters and classification using CNN. 2021 Int Conf Intell Technol CONIT 2021 1–6. https://doi.org/10.1109/CONIT51480.2021.9498466
Bilal A, Sun G, Mazhar S, Imran A (2022a) Improved grey wolf optimization-based feature selection and classification using CNN for diabetic retinopathy detection. In Lecture Notes Data Eng Commun Technol 116(July 2022). Springer Singapore. https://doi.org/10.1007/978-981-16-9605-3_1
Bilal A, Sun G, Mazhar S, Imran A, Latif J (2022b) A transfer learning and U-net-based automatic detection of diabetic retinopathy from fundus images. Comput Methods Biomech Biomed Eng Imaging Vis 10(6):663–674. https://doi.org/10.1080/21681163.2021.2021111
Bilal A, Zhu L, Deng A, Lu H, Wu N (2022c) AI-based automatic detection and classification of diabetic retinopathy using U-Net and deep learning. Symmetry 14(7). https://doi.org/10.3390/sym14071427
Bilal A, Liu X, Baig TI, Long H, Shafiq M (2023) EdgeSVDNet: 5G-enabled detection and classification of vision-threatening diabetic retinopathy in retinal fundus images. Electronics (Switzerland) 12(19). https://doi.org/10.3390/electronics12194094
Broadbent DM, Wang A, Cheyne CP, James M, Lathe J, Stratton IM, Roberts J, Moitt T, Vora JP, Gabbay M, García-Fiñana M, Harding SP (2021) Safety and cost-effectiveness of individualised screening for diabetic retinopathy: the ISDR open-label, equivalence RCT. Diabetologia 64(1):56–69. https://doi.org/10.1007/s00125-020-05313-2
Buchan JC, Norridge CFE, Low L, Shah V, Donachie PHJ (2024) The Royal College of Ophthalmologists’ National Ophthalmology Database Study of Cataract Surgery: Report 13, monitoring post-cataract surgery endophthalmitis rates—the rule of X. Eye (Basingstoke). https://doi.org/10.1038/s41433-023-02917-x
Budak U, Şengür A, Guo Y, Akbulut Y (2017) A novel microaneurysms detection approach based on convolutional neural networks with reinforcement sample learning algorithm. Health Inf Sci Syst 5(1). https://doi.org/10.1007/s13755-017-0034-9
Camastra F, Vinciarelli A (2008) Clustering methods. In: Machine learning for audio, image and video analysis, pp 117–148. https://doi.org/10.1007/978-1-84800-007-0_6
Chakraborty S, Jana GC, Kumari D, Swetapadma A (2020) An improved method using supervised learning technique for diabetic retinopathy detection. Int J Inf Technol (Singapore) 12(2):473–477. https://doi.org/10.1007/s41870-019-00318-6
Chakradar M, Aggarwal A, Cheng X, Rani A, Kumar M, Shankar A (2021) A non-invasive approach to identify insulin resistance with triglycerides and HDL-c ratio using machine learning. Neural Process Lett 0123456789. https://doi.org/10.1007/s11063-021-10461-6
Chaudhuri S, Chatterjee S, Katz N, Nelson M, Goldbaum M (1989) Detection of blood vessels in retinal images using two-dimensional matched filters. IEEE Trans Med Imaging 8(3):263–269. https://doi.org/10.1109/42.34715
Chen J, Yu H (2017) Unsupervised ensemble ranking of terms in electronic health record notes based on their importance to patients. J Biomed Inform 68:121–131. https://doi.org/10.1016/j.jbi.2017.02.0
Chen X, Wang X, Zhang K, Fung KM, Thai TC, Moore K, Mannel RS, Liu H, Zheng B, Qiu Y (2022) Recent advances and clinical applications of deep learning in medical image analysis. Med Image Anal 79:102444. https://doi.org/10.1016/j.media.2022.102444
Cho NH, Shaw JE, Karuranga S, Huang Y, da Rocha Fernandes JD, Ohlrogge AW, Malanda B (2018) IDF diabetes atlas: global estimates of diabetes prevalence for 2017 and projections for 2045. Diabetes Res Clin Pract 138:271–281. https://doi.org/10.1016/j.diabres.2018.02.023
Chudzik P, Majumdar S, Calivá F, Al-Diri B, Hunter A (2018) Microaneurysm detection using fully convolutional neural networks. Comput Methods Programs Biomed 158:185–192. https://doi.org/10.1016/j.cmpb.2018.02.016
Cleland CR, Rwiza J, Evans JR, Gordon I, MacLeod D, Burton MJ, Bascaran C (2023) Artificial intelligence for diabetic retinopathy in low-income and middle-income countries: a scoping review. BMJ Open Diabetes Res Care 11(4):1–13. https://doi.org/10.1136/bmjdrc-2023-003424
Costa P, Galdran A, Smailagic A, Campilho A (2018) A weakly-supervised framework for interpretable diabetic retinopathy detection on retinal images. IEEE Access 6:18747–18758. https://doi.org/10.1109/ACCESS.2018.2816003
Dai L, Wu L, Li H, Cai C, Wu Q, Kong H, Liu R, Wang X, Hou X, Liu Y, Long X, Wen Y, Lu L, Shen Y, Chen Y, Shen D, Yang X, Zou H, Sheng B, Jia W (2021) A deep learning system for detecting diabetic retinopathy across the disease spectrum. Nat Commun 12(1). https://doi.org/10.1038/s41467-021-23458-5
Data on Ophthalmologists Worldwide (n.d.). https://icoph.org/advocacy/data-on-ophthalmologists-worldwide/. Accessed 25 Jan 2024
Dissopa J, Kansomkeat S, Intajag S (2021) Enhance contrast and balance color of retinal image. Symmetry 13(11). https://doi.org/10.3390/sym13112089
Dutta S, Manideep BCS, Basha SM, Caytiles RD, Iyengar NCSN (2018) Classification of diabetic retinopathy images by using deep learning models. Int J Grid Distrib Comput 11(1):89–106. https://doi.org/10.14257/ijgdc.2018.11.1.09
Elsharkawy M, Sharafeldeen A, Soliman A, Khalifa F, Ghazal M, El-Daydamony E, Atwan A, Sandhu HS, El-Baz A (2022) A novel computer-aided diagnostic system for early detection of diabetic retinopathy using 3D-OCT higher-order spatial appearance model. diagnostics 12(2). https://doi.org/10.3390/diagnostics12020461
Enguehard J, O’Halloran P, Gholipour A (2019) Semi-supervised learning with deep embedded clustering for image classification and segmentation. IEEE Access 7:11093–11104. https://doi.org/10.1109/ACCESS.2019.2891970
Franklin SW, Rajan SE (2014) Computerized screening of diabetic retinopathy employing blood vessel segmentation in retinal images. Biocybernetics Biomed Eng 34(2):117–124. https://doi.org/10.1016/j.bbe.2014.01.004
Fraz MM, Jahangir W, Zahid S, Hamayun MM, Barman SA (2017) Multiscale segmentation of exudates in retinal images using contextual cues and ensemble classification. Biomed Signal Process Control 35:50–62. https://doi.org/10.1016/j.bspc.2017.02.012
Fumero F, Alayon S, Sanchez JL, Sigut J, Gonzalez-Hernandez M (2011) RIM-ONE: An open retinal image database for optic nerve evaluation. In: Proceedings - IEEE symposium on computer-based medical systems, vol 2–7. https://doi.org/10.1109/CBMS.2011.5999143
Galdran A, Anjos A, Dolz J, Chakor H, Lombaert H, Ayed IB (2022) State-of-the-art retinal vessel segmentation with minimalistic models. Sci Rep 12(1):1–13. https://doi.org/10.1038/s41598-022-09675-y
Gao G, Li J, Yang L, Liu Y (2023) A multi-scale global attention network for blood vessel segmentation from fundus images. Meas: J Int Meas Confederation 222(Septemeber):113553. https://doi.org/10.1016/j.measurement.2023.113553
Grzybowski A, Brona P, Lim G, Ruamviboonsuk P, Tan GSW, Abramoff M, Ting DSW (2020) Artificial intelligence for diabetic retinopathy screening: a review. Eye (Basingstoke) 34(3):451–460. https://doi.org/10.1038/s41433-019-0566-0
Guo X, Chen C, Lu Y, Meng K, Chen H, Zhou K, Wang Z, Xiao R (2020) Retinal vessel segmentation combined with generative adversarial networks and dense U-net. IEEE Access 8:194551–194560. https://doi.org/10.1109/ACCESS.2020.3033273
Guo L, Yu Y, Duan A, Gao H, Zhang J (2022) An unsupervised feature learning based health indicator construction method for performance assessment of machines. Mech Syst Signal Process 167(PB):108573. https://doi.org/10.1016/j.ymssp.2021.108573
Gupta S, Thakur S, Gupta A (2022) Optimized feature selection approach for smartphone based diabetic retinopathy detection. In: Proceedings of 2nd international conference on innovative practices in technology and management, ICIPTM 2022, pp 350–355. https://doi.org/10.1109/ICIPTM54933.2022.9754021
Haggag S, Elnakib A, Sharafeldeen A, Elsharkawy M, Khalifa F, Farag RK, Mohamed MA, Sandhu HS, Mansoor W, Sewelam A, El-Baz A (2022) A computer-aided diagnostic system for diabetic retinopathy based on local and global extracted features. Applied Sci (Switzerland) 12(16). https://doi.org/10.3390/app12168326
Hanúsková V, Pavlovićová J, Oravec M, Blaško R (2013) Diabetic rethinopathy screening by bright lesions extraction from fundus images. J Electr Eng 64(5):311–316. https://doi.org/10.2478/jee-2013-0045
Hao Y, Xie H, Qiu R (2021) Construction and application of color fundus image segmentation algorithm based on multi-scale local combined global enhancement. Pak J Med Sci 37(6-WIT):1595–1599. https://doi.org/10.12669/pjms.37.6-WIT.4848
Hatanaka Y, Ogohara K, Sunayama W, Miyashita M, Muramatsu C, Fujita H (2018) Automatic microaneurysms detection on retinal images using deep convolution neural network. In: 2018 international workshop on advanced image technology, vol 2018. IWAIT, pp 1–2. https://doi.org/10.1109/IWAIT.2018.8369794
Hervella ÁS, Rouco J, Novo J, Ortega M (2020) Self-supervised multimodal reconstruction of retinal images over paired datasets. Expert Syst Appl 161. https://doi.org/10.1016/j.eswa.2020.113674
Hoover A (2000) Locating blood vessels in retinal images by piecewise threshold probing of a matched filter response. IEEE Trans Med Imaging 19(3):203–210. https://doi.org/10.1109/42.845178
Huang S, Li J, Xiao Y, Shen N, Xu T (2022) RTNet: relation transformer network for diabetic retinopathy multi-lesion segmentation. IEEE Trans Med Imaging 41(6):1596–1607. https://doi.org/10.1109/TMI.2022.3143833
Hussain S, Guo F, Li W, Shen Z (2022) DilUnet: A U-net based architecture for blood vessels segmentation. Comput Methods Programs Biomed 218:106732. https://doi.org/10.1016/j.cmpb.2022.106732
Ishtiaq U, Abdul Kareem S, Abdullah ERMF, Mujtaba G, Jahangir R, Ghafoor HY (2020) Diabetic retinopathy detection through artificial intelligent techniques: a review and open issues. Multimed Tools Appl 79(21–22):15209–15252. https://doi.org/10.1007/s11042-018-7044-8
James G, Witten D, Hastie T, Tibshirani R (2000) An introduction to statistical learning. Curr Med Chem 7(10). https://doi.org/10.1007/978-1-4614-7138-7
Johnson KW, Torres Soto J, Glicksberg BS, Shameer K, Miotto R, Ali M, Ashley E, Dudley JT (2018) Artificial Intelligence in Cardiology. J Am Coll Cardiol 71(23):2668–2679. https://doi.org/10.1016/j.jacc.2018.03.521
Joshi S, Karule PT (2018) Detection of hard exudates based on morphological feature extraction. Biomed Pharmacol J 11(1):215–225. https://doi.org/10.13005/bpj/1366
Kampffmeyer M, Løkse S, Bianchi FM, Livi L, Salberg AB, Jenssen R (2019) Deep divergence-based approach to clustering. Neural Netw 113:91–101. https://doi.org/10.1016/j.neunet.2019.01.015
Kar MK, Nath MK, Neog DR (2021) A review on Progress in semantic image segmentation and its application to medical images. SN Comput Sci 2(5). https://doi.org/10.1007/s42979-021-00784-5
Kauppi T, Kälviäinen H (2008) Simple and robust optic disc localisation using colour decorrelated templates. In: Lecture notes in computer science (including subseries lecture notes in artificial intelligence and lecture notes in bioinformatics), 5259 LNCS, pp 719–729. https://doi.org/10.1007/978-3-540-88458-3_65
Khaing TT, Aimmanee P, Makhanov S, Haneishi H (2022) Vessel-based hybrid optic disk segmentation applied to mobile phone camera retinal images. Med Biol Eng Compu 60(2):421–437. https://doi.org/10.1007/s11517-021-02484-x
Khojasteh P, Aliahmad B, Arjunan SP, Kumar DK (2018) Introducing a novel layer in convolutional neural network for automatic identification of diabetic retinopathy. In: Conference proceedings : annual international conference of the IEEE engineering in medicine and biology society. IEEE engineering in medicine and biology society. Annual conference, 2018, pp 5938–5941. https://doi.org/10.1109/EMBC.2018.8513606
Kumar S, Kumar B (2018) Diabetic retinopathy detection by extracting area and number of microaneurysm from colour fundus image. In: 2018 5th international conference on signal processing and integrated networks, SPIN 2018, pp 359–364. https://doi.org/10.1109/SPIN.2018.8474264
Kumar A, Bi L, Kim J, Feng DD (2019) Machine learning in medical imaging. Elsevier Inc., In Biomedical Information Technology. https://doi.org/10.1016/B978-0-12-816034-3.00005-5
Kusakunniran W, Wu Q, Ritthipravat P, Zhang J (2018) Hard exudates segmentation based on learned initial seeds and iterative graph cut. Comput Methods Programs Biomed 158:173–183. https://doi.org/10.1016/j.cmpb.2018.02.011
Li X, Pang T, Xiong B, Liu W, Liang P, Wang T (2018) Convolutional neural networks based transfer learning for diabetic retinopathy fundus image classification. In: Proceedings - 2017 10th international congress on image and signal processing, BioMedical engineering and informatics, CISP-BMEI 2017, 2018-Janua(978), pp 1–11. https://doi.org/10.1109/CISP-BMEI.2017.8301998
Li Y, Zhu M, Sun G, Chen J, Zhu X, Yang J (2022) Weakly supervised training for eye fundus lesion segmentation in patients with diabetic retinopathy. Math Biosci Eng 19(5):5293–5311. https://doi.org/10.3934/mbe.2022248
Lian J, Liu T (2024) Lesion identification in fundus images via convolutional neural network-vision transformer. Biomed Sig Process Control 88(PA):105607. https://doi.org/10.1016/j.bspc.2023.105607
Lim WX, Chen ZY, Ahmed A (2022) The adoption of deep learning interpretability techniques on diabetic retinopathy analysis: a review. Med Biol Eng Compu 60(3):633–642. https://doi.org/10.1007/s11517-021-02487-8
Madhusudhan M, Malay N, Nirmala SR, Samerendra D (2011) Image processing techniques for glaucoma detection. Commun Comput Inf Sci 192 CCIS(PART 3):365–373. https://doi.org/10.1007/978-3-642-22720-2_38
Makarov S, Horner M, Noetscher G, Modeling CH (2021) Brain and human body modeling 2020. In: Brain and human body modeling 2020. https://doi.org/10.1007/978-3-030-45623-8
Mansour RF (2018) Deep-learning-based automatic computer-aided diagnosis system for diabetic retinopathy. Biomed Eng Lett 8(1):41–57. https://doi.org/10.1007/s13534-017-0047-y
Mateen M, Wen J, Nasrullah N, Sun S, Hayat S (2020) Exudate detection for diabetic retinopathy using pretrained convolutional neural networks. Complexity 2020:1744–1747. https://doi.org/10.1155/2020/5801870
Maritim AC, Sanders RA, Watkins JB (2003) Diabetes, oxidative stress, and antioxidants: a review. J Biochem Mol Toxicol 17(1):24–38. https://doi.org/10.1002/jbt.10058
Mayya V, Kamath-Se S, Kulkarni U (2021) Automated microaneurysms detection for early diagnosis of diabetic retinopathy: A Comprehensive review. Comput Methods Programs Biomed Update 1(February):100013. https://doi.org/10.1016/j.cmpbup.2021.100013
Mazlan N, Yazid H, Arof H, Mohd Isa H (2020) Automated microaneurysms detection and classification using multilevel thresholding and multilayer perceptron. J Med Biol Eng 40(2):292–306. https://doi.org/10.1007/s40846-020-00509-8
Melo T, Mendonça AM, Campilho A (2020) Microaneurysm detection in color eye fundus images for diabetic retinopathy screening. Comput Biol Med 126(September). https://doi.org/10.1016/j.compbiomed.2020.103995
Mendonça AM, Campilho A (2006) Segmentation of retinal blood vessels by combining the detection of centerlines and morphological reconstruction. IEEE Trans Med Imaging 25(9):1200–1213. https://doi.org/10.1109/TMI.2006.879955
Mishra S, Hanchate S, Saquib Z (2020) Diabetic retinopathy detection using deep learning. Proceedings of the International Conference on Smart Technologies in Computing, Electrical and Electronics, ICSTCEE 2020:515–520. https://doi.org/10.1109/ICSTCEE49637.2020.9277506
Miotto R, Wang F, Wang S, Jiang X, Dudley JT (2017) Deep learning for healthcare: review, opportunities and challenges. Brief Bioinform 19(6):1236–1246. https://doi.org/10.1093/bib/bbx044
Mookiah MRK, Hogg S, MacGillivray TJ, Prathiba V, Pradeepa R, Mohan V, Anjana RM, Doney AS, Palmer CNA, Trucco E (2021) A review of machine learning methods for retinal blood vessel segmentation and artery/vein classification. Med Image Anal 68:101905. https://doi.org/10.1016/j.media.2020.101905
Mumtaz R, Hussain M, Sarwar S, Khan K, Mumtaz S, Mumtaz M (2018) Automatic detection of retinal hemorrhages by exploiting image processing techniques for screening retinal diseases in diabetic patients. Int J Diabetes Dev Countries 38(1):80–87. https://doi.org/10.1007/s13410-017-0561-6
Nagpal D, Panda SN, Malarvel M, Pattanaik PA, Zubair Khan M (2021a) A review of diabetic retinopathy: Datasets, approaches, evaluation metrics and future trends. J King Saud Univ - Comput Inf Sci 34(9):7138–7152. https://doi.org/10.1016/j.jksuci.2021.06.006
Nagpal D, Panda SN, Malarvel M, Pattanaik PA, Zubair Khan M (2021b) A review of diabetic retinopathy: Datasets, approaches, evaluation metrics and future trends. J King Saud Univ - Comput Info Sci xxxx. https://doi.org/10.1016/j.jksuci.2021.06.006
Naqvi SAG, Zafar MF, Haq I ul (2015) Referral system for hard exudates in eye fundus. Comput Biol Med 64:217–235. https://doi.org/10.1016/j.compbiomed.2015.07.003
Nath MK, Dandapat S (2012) Differential entropy in wavelet sub-band for assessment of glaucoma. Int J Imaging Syst Technol 22(3):161–165. https://doi.org/10.1002/ima.22017
Nazih W, Aseeri AO, Atallah OY, El-Sappagh S (2023) Vision transformer model for predicting the severity of diabetic retinopathy in fundus photography-based retina images. IEEE Access 11(October):117546–117561. https://doi.org/10.1109/ACCESS.2023.3326528
Nazir T, Irtaza A, Shabbir Z, Javed A, Akram U, Mahmood MT (2019) Diabetic retinopathy detection through novel tetragonal local octa patterns and extreme learning machines. Artif Intell Med 99(January):101695. https://doi.org/10.1016/j.artmed.2019.07.003
Niemeijer M, Abràmoff MD, Van Ginneken B (2008) Automated localization of the optic disc and the fovea. In: Proceedings of the 30th annual international conference of the IEEE engineering in medicine and biology society, EMBS’08 - “Personalized healthcare through technology”, pp 3538–3541. https://doi.org/10.1109/iembs.2008.4649969
Niemeijer M, Abràmoff MD, Van Ginneken B (2009) Information fusion for diabetic retinopathy CAD in digital color fundus photographs. IEEE Trans Med Imaging 28(5):775–785. https://doi.org/10.1109/TMI.2008.2012029
Niemeijer M, Van Ginneken B, Cree MJ, Mizutani A, Quellec G, Sanchez CI, Zhang B, Hornero R, Lamard M, Muramatsu C, Wu X, Cazuguel G, You J, Mayo A, Li Q, Hatanaka Y, Cochener B, Roux C, Karray F et al (2010) Retinopathy online challenge: automatic detection of microaneurysms in digital color fundus photographs. IEEE Trans Med Imaging 29(1):185–195. https://doi.org/10.1109/TMI.2009.2033909
Omar M, Khelifi F, Tahir MA (2016) Detection and classification of retinal fundus images exudates using region based multiscale LBP texture approach. Int Conf Control Decis Inf Technol CoDIT 2016:227–232. https://doi.org/10.1109/CoDIT.2016.7593565
Orlando JI, Prokofyeva E, del Fresno M, Blaschko MB (2018) An ensemble deep learning based approach for red lesion detection in fundus images. Comput Methods Prog Biomed 153:115–127. https://doi.org/10.1016/j.cmpb.2017.10.017
Patidar P, Gupta M, Srivastava S, Nagawat AK (2010) Image De-noising by various filters for different noise. Int J Comput Appl 9(4):45–50. https://doi.org/10.5120/1370-1846
Pei D, Zhang C, Quan Y, Guo Q (2019) Identification of potential type II diabetes in a Chinese population with a sensitive decision tree approach. J Diab Res 2019:1–7. https://doi.org/10.1155/2019/4248218
Pichi F, Sarraf D, Arepalli S, Lowder CY, Cunningham ET, Neri P, Albini TA, Gupta V, Baynes K, Srivastava SK (2017) The application of optical coherence tomography angiography in uveitis and inflammatory eye diseases. Prog Retin Eye Res 59:178–201. https://doi.org/10.1016/j.preteyeres.2017.04.005
PoonguzhaliElangovan MKN (2022) En-ConvNet: A novel approach for glaucoma detection from color fundus images using ensemble of deep convolutional neural networks. Int J Imaging Syst Technol 32(6):2034–2048
Pratt H, Coenen F, Broadbent DM, Harding SP, Zheng Y (2016) Convolutional neural networks for diabetic retinopathy. Procedia Comput Sci 90(July):200–205. https://doi.org/10.1016/j.procs.2016.07.014
Qummar S, Khan FG, Shah S, Khan A, Shamshirband S, Rehman ZU, Khan IA, Jadoon W (2019) A deep learning ensemble approach for diabetic retinopathy detection. IEEE Access 7:150530–150539. https://doi.org/10.1109/ACCESS.2019.2947484
Raheja S, Kasturia S, Cheng X, Kumar M (2021) Machine learning-based diffusion model for prediction of coronavirus-19 outbreak. Neural Comput & Applic 0123456789. https://doi.org/10.1007/s00521-021-06376-x
Raza K, Singh NK (2021) A tour of unsupervised deep learning for medical image analysis. Curr Med Imaging Formerly Curr Med Imaging Rev 17(9):1059–1077. https://doi.org/10.2174/1573405617666210127154257
Ren Y, Hu K, Dai X, Pan L, Hoi SCH, Xu Z (2019) Semi-supervised deep embedded clustering. Neurocomputing 325:121–130. https://doi.org/10.1016/j.neucom.2018.10.016
Rezaee K, Haddadnia J, Tashk A (2017) Optimized clinical segmentation of retinal blood vessels by using combination of adaptive filtering, fuzzy entropy and skeletonization. Appl Soft Comput J 52:937–951. https://doi.org/10.1016/j.asoc.2016.09.033
Ricci E, Perfetti R (2007) Retinal blood vessel segmentation using line operators and support vector classification. IEEE Trans Med Imaging 26(10):1357–1365. https://doi.org/10.1109/TMI.2007.898551
Rupanagudi SR, Bhat VG, Revana BK, Chandramouli JG, Devegowda S, Darshan G, Kumaran K, Malepati N, Manjunath L, Shwetha N, Ramsali V, Shekar VC, Tarun MV, Narayan Y, Sanjay S (2021) Optic disk extraction and hard exudate identification in fundus images using computer vision and machine learning. In: 2021 IEEE 11th annual computing and communication workshop and conference, CCWC 2021, pp 655–661. https://doi.org/10.1109/CCWC51732.2021.9376018
Ryu G, Lee K, Park D, Park SH, Sagong M (2021) A deep learning model for identifying diabetic retinopathy using optical coherence tomography angiography. Sci Rep 11(1):1–9. https://doi.org/10.1038/s41598-021-02479-6
Saeed F, Hussain M, Aboalsamh HA (2021) Automatic diabetic retinopathy diagnosis using adaptive fine-tuned convolutional neural network. IEEE Access 9:41344–41359. https://doi.org/10.1109/ACCESS.2021.3065273
Saeedi P, Petersohn I, Salpea P, Malanda B, Karuranga S, Unwin N, Colagiuri S, Guariguata L, Motala AA, Ogurtsova K, Shaw JE, Bright D, Williams R (2019) Global and regional diabetes prevalence estimates for 2019 and projections for 2030 and 2045: Results from the International Diabetes Federation Diabetes Atlas, 9th edition. Diabetes Res Clin Pract 157:107843. https://doi.org/10.1016/j.diabres.2019.107843
Safi H, Safi S, Hafezi-Moghadam A, Ahmadieh H (2018) Early detection of diabetic retinopathy. Surv Ophthalmol 63(5):601–608. https://doi.org/10.1016/j.survophthal.2018.04.003
SakthiSree Devi M, Ramkumar S, Vinuraj Kumar S, Sasi G (2021) Detection of diabetic retinopathy using OCT image. Mater Today: Proc 47:185–190. https://doi.org/10.1016/j.matpr.2021.04.070
Salchow DJ, Oleynikov YS, Chiang MF, Kennedy-Salchow SE, Langton K, Tsai JC, Al-Aswad LA (2006) Retinal nerve fiber layer thickness in normal children measured with optical coherence tomography. Ophthalmology 113(5):786–791. https://doi.org/10.1016/j.ophtha.2006.01.036
Sandhu HS, Elmogy M, Taher Sharafeldeen A, Elsharkawy M, El-Adawy N, Eltanboly A, Shalaby A, Keynton R, El-Baz A (2020) Automated diagnosis of diabetic retinopathy using clinical biomarkers, optical coherence tomography, and optical coherence tomography angiography. Am J Ophthalmol 216:201–206. https://doi.org/10.1016/j.ajo.2020.01.016
Saranya P, Prabakaran S, Kumar R, Das E (2022) Blood vessel segmentation in retinal fundus images for proliferative diabetic retinopathy screening using deep learning. Vis Comput 38(3):977–992. https://doi.org/10.1007/s00371-021-02062-0
Sarwinda D, Siswantining T, Bustamam A (2019) Classification of diabetic retinopathy stages using histogram of oriented gradients and shallow learning. In: 2018 international conference on computer, control, informatics and its applications: recent challenges in machine learning for computing applications, IC3INA 2018 - Proceeding, pp 83–87. https://doi.org/10.1109/IC3INA.2018.8629502
Satpathy S, Pradhan MC, Sharma S (2016) Comparative study of noise removal algorithms for Denoising medical image using LabVIEW. In: Proceedings - 2015 international conference on computational intelligence and communication networks, CICN 2015, pp 300–305. https://doi.org/10.1109/CICN.2015.67
Séoud L, Faucon T, Hurtut T, Chelbi J, Cheriet F, Langlois JMP (2014) Automatic detection of microaneurysms and haemorrhages in fundus images using dynamic shape features. In: 2014 IEEE 11th international symposium on Biomedical imaging, vol 2014. ISBI, pp 101–104. https://doi.org/10.1109/isbi.2014.6867819
Sharafeldeen A, Elsharkawy M, Khalifa F, Soliman A, Ghazal M, AlHalabi M, Yaghi M, Alrahmawy M, Elmougy S, Sandhu HS, El-Baz A (2021) Precise higher-order reflectivity and morphology models for early diagnosis of diabetic retinopathy using OCT images. Sci Rep 11(1):1–16. https://doi.org/10.1038/s41598-021-83735-7
Sharafeldeen A, Elgafi M, Elnakib A, Mahmoud A, Elgarayhi A, Alghamdi NS, Sallah M, El-Baz A (2023) Diabetic retinopathy detection using 3D OCT features. Proc - Int Symp Biomed Imaging 1–4. https://doi.org/10.1109/ISBI53787.2023.10230785
Singer M, O’Brien P, Mein L, Olvera A (2024) Corneal sensitivity is inversely correlated with severity of diabetic retinopathy in a predominantly underrepresented population. Am J Ophthalmol 259:53–61. https://doi.org/10.1016/j.ajo.2023.08.010
Simonyan K, Zisserman A (2015) Very deep convolutional networks for large-scale image recognition. In: 3rd international conference on learning representations, ICLR 2015 - conference track proceedings, pp 1–14
Sleman AA, Soliman A, Elsharkawy M, Giridharan G, Ghazal M, Sandhu H, Schaal S, Keynton R, Elmaghraby A, El-Baz A (2021) A novel 3D segmentation approach for extracting retinal layers from optical coherence tomography images. Med Phys 48(4):1584–1595. https://doi.org/10.1002/mp.14720
Soares JVB, Leandro JJG, Cesar RM, Jelinek HF, Cree MJ (2006) Retinal vessel segmentation using the 2-D Gabor wavelet and supervised classification. IEEE Trans Med Imaging 25(9):1214–1222. https://doi.org/10.1109/TMI.2006.879967
Somasundaram SK, Alli P (2017) A machine learning ensemble classifier for early prediction of diabetic retinopathy. J Med Syst 41(12). https://doi.org/10.1007/s10916-017-0853-x
Sreng S, Maneerat N, Isarakorn D, Hamamoto K, Panjaphongse R (2015) Automatic hemorrhages detection based on fundus images. In: Proceedings - 2015 7th international conference on information technology and electrical engineering: envisioning the trend of computer, information and engineering, ICITEE 2015, pp 253–257. https://doi.org/10.1109/ICITEED.2015.7408951
Staal J, Abràmoff MD, Niemeijer M, Viergever MA, Van Ginneken B (2004) Ridge-based vessel segmentation in color images of the retina. IEEE Trans Med Imaging 23(4):501–509. https://doi.org/10.1109/TMI.2004.825627
Storath M, Weinmann A (2018) Fast median filtering for phase or orientation data. IEEE Trans Pattern Anal Mach Intell 40(3):639–652. https://doi.org/10.1109/TPAMI.2017.2692779
Subramanian S, Mishra S, Patil S, Shaw K, Aghajari E (2022) Machine learning styles for diabetic retinopathy detection: a review and bibliometric analysis. Big data and cognitive. Computing 6(4). https://doi.org/10.3390/bdcc6040154
Sun Z, Yang D, Tang Z, Ng DS, Cheung CY (2021) Optical coherence tomography angiography in diabetic retinopathy: an updated review. Eye (Basingstoke) 35(1):149–161. https://doi.org/10.1038/s41433-020-01233-y
Sun H, Saeedi P, Karuranga S, Pinkepank M, Ogurtsova K, Duncan BB, Stein C, Basit A, Chan JCN, Mbanya JC, Pavkov ME, Ramachandaran A, Wild SH, James S, Herman WH, Zhang P, Bommer C, Kuo S, Boyko EJ, Magliano DJ (2022) IDF Diabetes Atlas: Global, regional and country-level diabetes prevalence estimates for 2021 and projections for 2045. Diabetes Res Clin Pract 183:109119. https://doi.org/10.1016/j.diabres.2021.109119
Takahashi H, Tampo H, Arai Y, Inoue Y, Kawashima H (2017) Applying artificial intelligence to disease staging: Deep learning for improved staging of diabetic retinopathy. PLoS ONE 12(6):1–11. https://doi.org/10.1371/journal.pone.0179790
Tan JH, Acharya UR, Bhandary SV, Chua KC, Sivaprasad S (2017) Segmentation of optic disc, fovea and retinal vasculature using a single convolutional neural network. J Comput Sci 20:70–79. https://doi.org/10.1016/j.jocs.2017.02.006
Ting DSW, Cheung CYL, Lim G, Tan GSW, Quang ND, Gan A, Hamzah H, Garcia-Franco R, Yeo IYS, Lee SY, Wong EYM, Sabanayagam C, Baskaran M, Ibrahim F, Tan NC, Finkelstein EA, Lamoureux EL, Wong IY, Bressler NM, …, Wong TY (2017) Development and validation of a deep learning system for diabetic retinopathy and related eye diseases using retinal images from multiethnic populations with diabetes. JAMA - J Am Med Assoc 318(22):2211–2223. https://doi.org/10.1001/jama.2017.18152
Van Grinsven MJJP, Van Ginneken B, Hoyng CB, Theelen T, Sánchez CI (2016) Fast convolutional neural network training using selective data sampling: Application to hemorrhage detection in color fundus images. IEEE Trans Med Imaging 35(5):1273–1284. https://doi.org/10.1109/TMI.2016.2526689
Vanithamani R, Renee Christina R (2018) Exudates in detection and classification of diabetic retinopathy. Adv Intell Syst Comput 614(SoCPaR 2016):252–261. https://doi.org/10.1007/978-3-319-60618-7_25
Vega R, Sanchez-Ante G, Falcon-Morales LE, Sossa H, Guevara E (2015) Retinal vessel extraction using Lattice Neural Networks with dendritic processing. Comput Biol Med 58:20–30. https://doi.org/10.1016/j.compbiomed.2014.12.016
Wang S, Yin Y, Cao G, Wei B, Zheng Y, Yang G (2015) Hierarchical retinal blood vessel segmentation based on feature and ensemble learning. Neurocomputing 149(12):708–717. https://doi.org/10.1016/j.neucom.2014.07.059
Wang Su, Tang HL, Al Turk LI, Hu Y, Sanei S, Saleh GM, Peto T (2017) Localizing microaneurysms in fundus images through singular spectrum analysis. IEEE Trans Biomed Eng 64(5):990–1002. https://doi.org/10.1109/TBME.2016.2585344
Wang B, Wang S, Qiu S, Wei W, Wang H, He H (2021) CSU-Net: A context spatial U-Net for accurate blood vessel segmentation in fundus images. IEEE J Biomed Health Inform 25(4):1128–1138. https://doi.org/10.1109/JBHI.2020.3011178
Wang Y, Galang C, Freeman WR, Warter A, Heinke A, Bartsch DUG, Nguyen TQ, An C (2023) Retinal OCT layer segmentation via joint motion correction and graph-assisted 3D neural network. IEEE Access 11(September):103319–103332. https://doi.org/10.1109/ACCESS.2023.3317011
Welfer D, Scharcanski J, Kitamura CM, Dal Pizzol MM, Ludwig LWB, Marinho DR (2010) Segmentation of the optic disk in color eye fundus images using an adaptive morphological approach. Comput Biol Med 40(2):124–137. https://doi.org/10.1016/j.compbiomed.2009.11.009
WHO (2023) (5 April 2023). https://www.who.int/news-room/fact-sheets/detail/diabetes. Accessed 16 Dec 2023
Williamson TH, Gardner GG, Keating D, Kirkness CM, Elliott AT (1996) Automatic detection of diabetic retinopathy using neural networks. Invest Ophthalmol vis Sci 37(3):940–944
Wisaeng K, Sa-Ngiamvibool W (2019) Exudates detection using morphology mean shift algorithm in retinal images. IEEE Access 7:11946–11958. https://doi.org/10.1109/ACCESS.2018.2890426
Xiao Z, Li F, Geng L, Zhang F, Wu J, Zhang X, Su L, Shan C, Yang Z, Sun Y, Xiao Y, Du W (2015) Hard exudates detection method based on background-estimation. Lect Notes Comput Sci (Including Subseries Lecture Notes in Artificial Intelligence and Lecture Notes in Bioinformatics) 9218:361–372. https://doi.org/10.1007/978-3-319-21963-9_33
Xiao D, Yu S, Vignarajan J, An D, Tay-Kearney ML, Kanagasingam Y (2017a) Retinal hemorrhage detection by rule-based and machine learning approach. Proc Annu Int Conf IEEE Eng Med Biol Soc EMBS 660–663. https://doi.org/10.1109/EMBC.2017.8036911
Xiao Z, Zhang X, Geng L, Zhang F, Wu J, Tong J, Ogunbona PO, Shan C (2017b) Automatic non-proliferative diabetic retinopathy screening system based on color fundus image. Biomed Eng Online 16(1):1–19. https://doi.org/10.1186/s12938-017-0414-z
Xu K, Feng D, Mi H (2017) Deep convolutional neural network-based early automated detection of diabetic retinopathy using fundus image. Molecules 22(12). https://doi.org/10.3390/molecules22122054
Yamuna T, Maheswari S (2013) Detection of abnormalities in retinal images. In: 2013 IEEE international conference on emerging trends in computing, communication and nanotechnology, ICE-CCN 2013, ICECCN, pp 236–240. https://doi.org/10.1109/ICE-CCN.2013.6528500
Yang Y, Li T, Li W, Wu H, Fan W, Zhang W (2017) Lesion detection and grading of diabetic retinopathy via two-stages deep convolutional neural networks. In: Lecture notes in computer science (including subseries lecture notes in artificial intelligence and lecture notes in bioinformatics), 10435 LNCS, pp 533–540. https://doi.org/10.1007/978-3-319-66179-7_61
Yang Y, Cai Z, Qiu S, Xu P (2024) A novel transformer model with multiple instance learning for diabetic retinopathy classification. IEEE Access 12(December 2023):6768–6776. https://doi.org/10.1109/ACCESS.2024.3351473
Youssif AAHAR, Ghalwash AZ, Ghoneim AASAR (2008) Optic disc detection from normalized digital fundus images by means of a vessels’ direction matched filter. IEEE Trans Med Imaging 27(1):11–18. https://doi.org/10.1109/TMI.2007.900326
Zeng X, Chen H, Luo Y, Ye W (2019) Automated diabetic retinopathy detection based on binocular siamese-like convolutional neural network. IEEE Access 7:30744–30753. https://doi.org/10.1109/ACCESS.2019.2903171
Zhang L, Lim CP (2020) Intelligent optic disc segmentation using improved particle swarm optimization and evolving ensemble models. Appl Soft Comput J 92:106328. https://doi.org/10.1016/j.asoc.2020.106328
Zhang W, Zhong J, Yang S, Gao Z, Hu J, Chen Y, Yi Z (2019) Automated identification and grading system of diabetic retinopathy using deep neural networks. Knowl-Based Syst 175:12–25. https://doi.org/10.1016/j.knosys.2019.03.016
Zhang X, Xiao Z, Zhang F, Ogunbona PO, Xi J, Tong J (2020) Shape-based filter for micro-aneurysm detection. Comput Electr Eng 84. https://doi.org/10.1016/j.compeleceng.2020.106620
Zang P, Hormel TT, Wang X, Tsuboi K, Huang D, Hwang TS, Jia Y (2022) A diabetic retinopathy classification framework based on deep-learning analysis of OCT angiography. Transl Vision Sci Technol 11(7):1–13. https://doi.org/10.1167/tvst.11.7.10
Zhou W, Wu C, Chen D, Wang Z, Yi Y, Du W (2017a) Automatic microaneurysms detection based on multifeature fusion dictionary learning. Comput Math Methods Med 2017. https://doi.org/10.1155/2017/2483137
Zhou W, Wu C, Chen D, Yi Y, Du W (2017b) Automatic microaneurysm detection using the sparse principal component analysis-based unsupervised classification method. IEEE Access 5:2563–2572. https://doi.org/10.1109/ACCESS.2017.2671918
Zhou Y, Wang B, Huang L, Cui S, Shao L (2021) A benchmark for studying diabetic retinopathy: segmentation, grading, and transferability. IEEE Trans Med Imaging 40(3):818–828. https://doi.org/10.1109/TMI.2020.3037771
Author information
Authors and Affiliations
Contributions
Huma Naz authored the main manuscript text and formulated the primary methodology. Huma Naz also prepared figures 1-2 and figures 5-19. Revisions were conducted by Huma Naz. Neelu Jyothi Ahuja and Rahul Nijhawan reviewed the text and proposed potential changes.
Permission has been obtained from the authors to reprint figures 3 and 4.
Corresponding author
Ethics declarations
Competing interests
The authors declare no competing interests.
Additional information
Publisher's Note
Springer Nature remains neutral with regard to jurisdictional claims in published maps and institutional affiliations.
Rights and permissions
Open Access This article is licensed under a Creative Commons Attribution 4.0 International License, which permits use, sharing, adaptation, distribution and reproduction in any medium or format, as long as you give appropriate credit to the original author(s) and the source, provide a link to the Creative Commons licence, and indicate if changes were made. The images or other third party material in this article are included in the article's Creative Commons licence, unless indicated otherwise in a credit line to the material. If material is not included in the article's Creative Commons licence and your intended use is not permitted by statutory regulation or exceeds the permitted use, you will need to obtain permission directly from the copyright holder. To view a copy of this licence, visit http://creativecommons.org/licenses/by/4.0/.
About this article

Cite this article
Naz, H., Ahuja, N.J. & Nijhawan, R. Diabetic retinopathy detection using supervised and unsupervised deep learning: a review study. Artif Intell Rev 57, 131 (2024). https://doi.org/10.1007/s10462-024-10770-x
Accepted:
Published:
DOI: https://doi.org/10.1007/s10462-024-10770-x