
Abstract
In this study, the Learning Search Algorithm (LSA) is introduced as an innovative optimization algorithm that draws inspiration from swarm intelligence principles and mimics the social learning behavior observed in humans. The LSA algorithm optimizes the search process by integrating historical experience and real-time social information, enabling it to effectively navigate complex problem spaces. By doing so, it enhances its global development capability and provides efficient solutions to challenging optimization tasks. Additionally, the algorithm improves the collective learning capacity by incorporating teaching and active learning behaviors within the population, leading to improved local development capabilities. Furthermore, a dynamic adaptive control factor is utilized to regulate the algorithm’s global exploration and local development abilities. The proposed algorithm is rigorously evaluated using 40 benchmark test functions from IEEE CEC 2014 and CEC 2020, and compared against nine established evolutionary algorithms as well as 11 recently improved algorithms. The experimental results demonstrate the superiority of the LSA algorithm, as it achieves the top rank in the Friedman rank-sum test, highlighting its power and competitiveness. Moreover, the LSA algorithm is successfully applied to solve six real-world engineering problems and 15 UCI datasets of feature selection problems, showcasing its significant advantages and potential for practical applications in engineering problems and feature selection problems.
1 Introduction
All production or social activities that human beings are engaged in are purposeful. The activity is always under the control of specific values or aesthetic orientations, and it often faces a decision problem of the feasible or even optimal scheme, i.e., an optimization problem (Martello et al. 1984). In recent years, the importance of optimization in engineering design, disease identification, and other issues has been recognized. Specifically, taking the objective function as the predefined measure of decision quality, the best decision or solution to predefined design problems can be obtained by evaluating various methods. Optimization is a problem that people often encounter in the production practice of scientific research and social transformation. It has the characteristics of unknown search space, non-differentiability of the objective function, high-dimensional, and non-convex (Ezugwu 2022). Generally, optimization techniques can be roughly divided into deterministic and non-deterministic ones (Parsopoulos and Vrahatis 2002). Deterministic methods are usually gradient-based and are further divided into linear and nonlinear ones. Although these methods help to solve linear and nonlinear optimization problems, they will fall into local optimization when dealing with non-differentiable optimization problems, so they cannot solve such problems in the minimum time or with accurate complexity. The non-deterministic method uses a random generation strategy to find the near-optimal solution in the problem space, which has the advantage of simple implementation and no gradient-related information (Li et al. 2011; Liu et al. 2013).
With the continuous expansion of engineering application fields and the continuous improvement of the complexity and difficulty of optimization problems, the need for optimization technology is becoming more and more obvious. As a class of non-deterministic methods (random search methods), meta-heuristic algorithms have demonstrated excellent performance when tackling challenges involving multiple-peak, discontinuous, and non-differentiable problems. Therefore, meta-heuristic algorithms have gained significant popularity in efficiently tackling diverse practical optimization problems across numerous fields, such as function optimization (Seo et al. 2006; Pan et al. 2006), pipeline scheduling (Rejowski and Pinto 2003; Li et al. 2021), optimization of neural network parameters (Abdolrasol et al. 2021; Abd Elaziz et al. 2021), key gene identification (Mandal and Mukhopadhyay 2015), image segmentation (Chander et al. 2011; Pham et al. 2018), parameter identification of photovoltaic module models (Ibrahim et al. 2020; Liang et al. 2020), optimization of engineering design, etc. (Kundu and Garg 2022; Onay and Aydemı̇r, S. B. 2022).
In terms of formation principle, meta-heuristic methods can be categorized into four distinct groups, each offering unique approaches to solving optimization problems encountered in various disciplines: the methods based on the evolutionary mechanism, the methods based on physical principles, the methods based on swarm intelligence, and the methods based on human social activities (Sharma et al. 2022; Wilson et al. 2022; Tian et al. 2022; Ewees et al. 2022). Section 2 offers an extensive compilation of the comprehensive literature on the development and application of numerous novel metaheuristics across various domains.
Meanwhile, many scholars have optimized the original basic algorithm to solve the optimization problems of real-world engineering applications more efficiently. For example, due to the large randomness and uncertainty of the randomly generated initial population, many scholars have improved the initial population by using chaos mapping (Tutueva et al. 2020), reverse learning (Ruan et al. 2022), Sobol sequence (Sun et al. 2021), square neighborhood topology (Rachdi et al. 2020), and other strategies to achieve algorithm optimization and convergence performance improvement. Some scholars have adopted strategies such as sine–cosine optimization (Chen et al. 2020a), Gaussian walk (Khalilpourazari et al. 2021), Levy flight (Kaidi et al. 2022), and quantum behavior (Zhang et al. 2021a) to optimize individual iterative updates. Also, nonlinear inertia weight (Yu et al. 2020), horizontal cross (Chen et al. 2019), spiral update (Lin et al. 2022), and other approaches have been employed to achieve the balance between the global and local development of the algorithm. Moreover, some scholars have combined the advantages of two or more algorithms and proposed an improved hybrid strategy algorithm (Shi et al. 2005; Yaghini et al. 2013; Qiao et al. 2020), such as the exploratory cuckoo search (ECS) algorithm proposed by Abed-Alguni et al. (Abed-Alguni et al. 2021) and the improved SSA algorithm proposed by Dorian (Dorian Sidea 2024).
In metaheuristic algorithms, the exploration phase of the global search space has the ability to escape local optima, while the exploitation phase enhances the algorithm’s precise search capability within local regions. Balancing exploration and exploitation is a challenging task in every metaheuristic algorithm, as it affects whether the algorithm can find the global optimum solution. In general, metaheuristic algorithms offer different performances in solving optimization problems due to their different operations and mechanisms. According to the “No Free Lunch” (NFL) theorem (Qiao et al. 2020), all metaheuristic algorithms have the same average performance when solving optimization problems. In other words, there is no optimal algorithm that can solve all optimization problems, which means that the performance of different algorithms varies when providing prior knowledge to solve specific problems with metaheuristic algorithms. Finding the most suitable algorithm for each specific type of optimization problem remains a challenge. Each metaheuristic algorithm has its unique characteristics as they draw inspiration from different natural or biological behaviors. To evaluate performance and find suitable application areas, metaheuristic algorithms require comprehensive testing on various benchmark functions and real-world applications, and continual improvement. These reasons support the innovation and design of metaheuristic algorithms to solve a wide range of optimization problems.
This paper proposes a novel optimization algorithm, called the learning search algorithm (LSA), which is inspired by human learning behaviors and promotes both global exploration and local development phases simultaneously. The LSA algorithm involves dynamic adaptive global exploration to local development phase control parameters, which enhance its global search ability and avoid falling into local optima. In the local development phase, the algorithm exploits the teaching behavior of the model in the current population to actively learn behaviors from role models and improve the learning ability of the entire population. The proposed LSA algorithm is evaluated on 40 benchmark functions from IEEE CEC2014 and CEC2020, 6 real-world engineering optimization problems and 15 feature selection cases in the UCI dataset. Contrasted with nine high-performance algorithms and eleven recently proposed algorithms, the LSA algorithm shows promising results in terms of convergence speed, search accuracy, and scalability. The experiment results suggest that the LSA algorithm outperforms the selected comparison algorithms on most of the selected test problems. The statistical analysis further confirms the proposed algorithm’s superiority by conducting the Wilcoxon signed-rank test and the Friedman rank-sum test.
The paper presents several significant contributions:
-
In terms of learning mechanism, the LSA algorithm simulates the process of human knowledge acquisition. In this algorithm, a historical experience knowledge base is established, from which humans learn knowledge. Humans also possess the ability of active learning and knowledge acquisition from exemplary radiations. Additionally, the learning outcomes continuously update the historical experience knowledge base.
-
Regarding its adaptability, the LSA algorithm exhibits a high level of adaptability. In each iteration process, knowledge and information flow constantly between the historical experience knowledge base and the current individuals. This enables the LSA algorithm to adaptively adjust the search strategy based on the complexity and characteristics of the problem, thereby enhancing the search efficiency and solution quality.
-
The concept of idea transmission is another important aspect of the LSA algorithm. It improves the solutions of individuals through the transmission of ideas. The algorithm transfers excellent search ideas to learning individuals based on historical experiences and the most outstanding solutions of the population.
-
Furthermore, the LSA algorithm possesses interpretability and ease of implementation. Its ideas are relatively simple and intuitive, making it easy to understand and implement. The role switch between individuals and the process of knowledge transmission can be explained and analyzed, allowing users of the algorithm to better understand the optimization process.
The remaining sections of this paper are organized as follows: In Section 2, an overview of the literature on metaheuristic algorithms is provided. Section 3 provides a detailed introduction to the principle and mathematical model of the LSA algorithm. In Section 4, comprehensive experiments are conducted to demonstrate the superiority of the LSA algorithm over comparative optimization algorithms. Finally, Section 5 presents the conclusions of this paper.
2 Literature review
This section provides an overview of the current advancements in metaheuristics. In recent times, numerous metaheuristic algorithms have been introduced and extensively studied. These algorithms primarily fall into four categories: (1) swarm-based algorithms that emulate swarm intelligence, (2) evolutionary-based algorithms that draw inspiration from natural evolutionary processes, (3) physics or chemistry-based algorithms that are inspired by physical or chemical phenomena, and (4) social or human-based algorithms that are influenced by human or social behaviors. Table 1 presents a compilation of notable and recently developed metaheuristic algorithms.
Natural evolution algorithms are developed from biological phenomena such as natural evolution, and the representative algorithm is the GA algorithm (Mirjalili 2019); Other algorithms include the differential evolution (DE) algorithm (Das and Suganthan 2010), evolution strategy (ES) (Schwefel and Rudolph 1995), memetic algorithm (MA) (Moscato et al. 2004), and genetic programming (GP) (Sette and Boullart 2001). Swarm intelligence optimization algorithms, which simulate the social behavior of animals based on group foraging behaviors, have attracted increasing attention. Notable algorithms in this domain include the particle swarm optimization (PSO) algorithm (Poli et al. 2007), the crow search algorithm (CSA) (Askarzadeh 2016), cuckoo search (CS) algorithm (Yang and Deb 2014), the social spider algorithm (SSA) (James and Li 2015), the sparrow search algorithm (SSA) (Xue and Shen 2020), the red fox optimization (RFO) algorithm (Połap and Woźniak 2021), the salp swarm algorithm (SSA) (Mirjalili et al. 2017), dolphin partner optimization (DPO) (Dhanya and Arivudainambi 2019), Lion Optimization Algorithm (LOA) (Yazdani and Jolai 2016), dingoes hunting strategies (DHS) (Peraza-Vázquez et al. 2021), mycorrhiza tree optimization algorithm (MTOA) (Carreon-Ortiz and Valdez 2022), charged system search (CSS) (Kaveh and Talatahari 2010), chameleon swarm algorithm (CSA) (Braik 2021), wild horse optimizer (WHO) (Naruei and Keynia 2022), mayfly optimization algorithm (MOA) (Zervoudakis and Tsafarakis 2020), capuchin search (CSA) (Braik et al. 2021), Zebra Optimization Algorithm (ZOA) (Trojovská et al. 2022), Tasmanian Devil Optimization (TDO) (Dehghani et al. 2022a), Artificial rabbits optimization (RSO) (Wang et al. 2022a), Osprey Optimization Algorithm (OOA) (Dehghani and Trojovský 2023), Exponential distribution optimizer (EDO) (Abdel-Basset et al. 2023), and others. These algorithms have demonstrated promising performance in solving various complex optimization problems. Besides, there is a class of physical search algorithms based on the simulation of physical phenomena, such as the simulated annealing (SA) (Bertsimas and Tsitsiklis 1993), gravitational search algorithm (GSA) (Saremi et al. 2017), curved space optimization (CSO) (Moghaddam and Moghaddam 2012), lighting attachment procedure optimization (LAPO) (Nematollahi et al. 2017), black hole mechanics optimization (BHMO) (Kaveh et al. 2020a), plasma generation optimization (PGO) (Kaveh et al. 2020b), solid system algorithm (SSA) (Zitouni et al. 2020), atomic search algorithm (ASO) (Li et al. 2020a), Heap-based Optimization (HBO) (Askari et al. 2020), Weighted mean of vectors algorithm(INFO) (Ahmadianfar et al. 2022), Exponential distribution optimizer(EDO) (Ayyarao et al. 2022), Subtraction-Average-Based Optimizer(SABO) (Trojovský and Dehghani 2023), etc. Some intelligent algorithms have been designed based on human social activities, such as the teaching–learning-based optimization (TLBO) (Rao et al. 2012), skill optimization algorithm (SOA) (Ramshanker and Chakraborty 2022), cooperative search algorithm (CSA) (Feng et al. 2021), human urbanization algorithm (HUA) (Kılkış and Kılkış 2019), heap-based optimization (HBO) (Askari et al. 2020), stock exchange trading optimization (SETO) (Emami 2022), arithmetical optimization algorithm (AOA) (Abualigah et al. 2021), Driving Training-Based Optimization (DTBO) (Dehghani et al. 2022b), Chef-Based Optimization Algorithm (CBOA) (Trojovská and Dehghani 2022), War Strategy Optimization Algorithm (WSO), and so on. Additionally, in the past three years, many relatively new meta-heuristic algorithms have been proposed, and they are not classified into the mentioned categories. For example, inspired by the management strategy of the constitutional monarchy government, Ahmia et al., proposed the monarchy meta-heuristic (MN) optimization algorithm (Ahmia and Aider 2019). Brammya et al. utilized a simulation of human deer hunting behavior to propose a deer hunting optimization algorithm (DHOA) (Brammya et al. 2019). In a similar vein, Hayyolalam and Kazem devised a black widow optimization (BWO) algorithm (Hayyolalam and Kazem 2020), drawing inspiration from the mating behavior of black widow spiders. Nematollahi et al. introduced the Golden Ratio Optimization Method (GROM) as an optimization approach (Nematollahi et al. 2020). Li et al. developed the virus propagation optimization (VSO) algorithm (Li et al. 2020b), which simulates the propagation process of the virus. Alsattar et al. proposed the bald eagle search (BES) algorithm (Alsattar et al. 2020) based on the hunting process of the bald eagle.
3 Learning search algorithm
This section provides the details and optimization procedure of the proposed learning search algorithm (LSA). The algorithm is inspired by human learning behaviors in the social environment, including the global learning behavior guided by historical experience and other social individuals, and the local learning behavior guided by role models. The analysis of the mathematical model and the realization process and time complexity of LSA is presented below.
3.1 The basics of MHSs and the proposed LSA method
The general framework of meta-heuristic search algorithms (MHSs) typically consists of three essential components: the selection guides mechanism, the search operators design, and the update mechanism design, as demonstrated in Fig. 1 (Kahraman et al. 2023).

General steps involved in the MHS process
The process of selecting candidate solutions from a population to guide the search process is a fundamental aspect of the MHS algorithm. Various methods exist for guiding this selection (Fig. 1), but the dominant approach is currently the survival theorem, which compares the fitness values of individuals within the population (Forrest 1993; Holland 1992). More recently, the Fitness-Distance Balance (FDB) has emerged as a promising new method for guiding selection in the MHS algorithm (Kahraman et al. 2022; Guvenc et al. 2021; Duman et al. 2023). Selecting excellent individuals as guidance is a critical step in MHS algorithms. Reasonable selection of individuals, balancing diversity and convergence, directly affects the efficiency and quality of search results. The driving force behind human progress is the ability to learn different perspectives and interpretations from different historical periods, cultivating critical thinking and analytical skills. By comparing and evaluating different historical events and interpretations, people can gain a better understanding of the complexity and diversity of history and draw their own conclusions. Additionally, role models serve as symbols of successful experiences, having achieved excellence in a particular field or skill. Humans can use the behavior, thinking, and decision-making of role models to guide the application of knowledge, avoiding some common mistakes and dilemmas. Following the mechanism of MHS algorithms, we can use historical experience and role models as guidance leaders in the search process, emphasizing the balance between diversity and convergence.
The design of search operators is a crucial element of MHS algorithms as it shapes the models simulating the distinct behaviors and survival skills unique to each population. The search operators for various MHS algorithms differ, including genetic-based crossover and mutation operators (Chen et al. 2020a; Mirjalili 2019; Das and Suganthan 2010; Schwefel and Rudolph 1995; Holland 1992), operators based on swarm foraging behavior (Poli et al. 2007; Askarzadeh 2016; Yang and Deb 2014; James and Li 2015; Xue and Shen 2020; Połap and Woźniak 2021), operators based on physical natural phenomena (Bertsimas and Tsitsiklis 1993; Moghaddam and Moghaddam 2012; Li et al. 2020a), and operators based on human social activities (Wilson et al. 2022; Tian et al. 2022; Ewees et al. 2022). A high capacity for summarizing experiences and imitative learning, as well as autonomous learning ability, is why human learning surpasses that of other organisms. The proposed algorithm embodies the subjective autonomy of human learning behavior and the diversity of learning approaches, fully embodying its potential for breakthroughs in MHS.
In MHS algorithms, the majority of update mechanisms employ a greedy approach based on fitness values (Yang and Deb 2014; Carreon-Ortiz and Valdez 2022; Saremi et al. 2017). This approach guarantees a balanced turnover of individuals within the population, ensuring that the introduction of a specific number of new individuals is accompanied by the removal of an equivalent number of existing individuals. An alternative approach for update mechanisms, referred to as the “direct” approach, is depicted in Fig. 1, exemplified by the SCA (Trojovský and Dehghani 2022) and SMA (Li et al. 2020c). In these algorithms, mutated individuals survive at each step of the search process, while previous individuals are eliminated. Furthermore, the NSM score-based approach has also proven to be an efficient method for update mechanisms (Kahraman et al. 2023). Human learning behavior can be characterized as “taking the essence, discarding the dross.” Unlike other organisms, humans possess the ability for reflection, critical thinking, and abstract reasoning. They can selectively choose valuable content that aids in personal learning and understanding, assimilating and integrating it into their own knowledge system. Thus, the update mechanism designed for the LSA algorithm adopts a greedy strategy based on fitness values.
3.2 Inspiration
A learning behavior encompasses the acquisition of behaviors by individuals, resulting from a combination of genetic and environmental factors and shaped by life experiences. For human beings, learning is not only an activity of simply adapting to the environment but also has social significance. Therefore, human learning has social characteristics, and this is mainly manifested in its indirect experience and positive initiatives.
Interaction with others allows individuals to acquire knowledge not only from their direct experiences but also from the collective historical experiences of human society. As human culture has evolved, society has accumulated a vast body of knowledge and experience, which has been transmitted through social inheritance. From birth, individuals in human society have the ability to assimilate the wisdom passed down by previous generations through interactions with teachers in educational institutions. Additionally, they also have the opportunity to acquire valuable social experiences through interactions with their contemporaries. This mode of indirect experiential learning is characterized by its rich and diverse content and form, setting it apart from learning processes observed in animals (McFarland et al. 1993; Bennett 2011), as depicted in Fig. 2(a).

Depicts human learning behavior through two distinct avenues. Panel (a) highlights the role of historical experience and interaction with other individuals in the learning process. Panel (b) illustrates how active learning and mentorship from role models also contribute to effective learning outcomes
Animal learning is primarily an adaptive process driven by environmental factors, making it a passive endeavor. In contrast, human learning encompasses not only a desire to understand the world but also a determination to shape and alter it. Thus, humans engage in active interactions with their surroundings, learning through integration with the individuals they encounter. The purpose of human learning extends beyond merely satisfying physiological needs; it also encompasses the demands of social life. Consequently, humans possess a wide range of learning motivations and objectives. In their pursuit of these objectives, humans actively explore diverse and effective learning methods, a capability that surpasses the realm of animal learning (Schoenewolf 1990; Bruner 2009, 1971), exemplified in Fig. 2(b).
Inspired by the behaviors observed in human life and learning, this paper presents the Learning Search Algorithm (LSA) as a groundbreaking meta-heuristic approach. The LSA’s mathematical model is outlined below.
3.3 Mathematical model of the proposed algorithm
Human learning exhibits two distinct modes of behavior, characterized by different approaches to acquiring knowledge. One mode involves the utilization of historical experience and interactions with others, enabling a global search process. In this mode, individuals benefit from the indirect aspect of human learning, where accumulated wisdom and collective experiences guide their learning journey. The other mode involves the active participation of individuals, particularly the role model who represents the current optimal individual. This role model not only imparts knowledge to others but also actively engages in learning, thereby facilitating local search within the learning algorithm. This active aspect of human learning contributes to the refinement and fine-tuning of the individual’s knowledge. By incorporating these two modes of learning behavior, the Learning Search Algorithm (LSA) enriches and comprehensively expands the overall knowledge of the population. This algorithm integrates the global exploration facilitated by historical experiences and interactions, along with the localized refinement through active learning from the role model. Such integration leads to a synergistic effect, where the collective wisdom accumulated through historical experiences is combined with the adaptability and learning capabilities of individuals. Furthermore, the LSA incorporates autonomous control factor dynamics, ensuring a seamless wide-ranging exploration to precise refinement. This dynamic adaptation mechanism enables the algorithm to strike a balance between exploration and exploitation, allowing for efficient knowledge acquisition and optimization.
3.3.1 Initialization
In this investigation, we utilized a population-based swarm intelligence optimization technique referred to as the Learning Search Algorithm (LSA). LSA is designed to find optimal solutions by iteratively updating the individual candidate solutions within the population. The population’s position is modeled using a matrix, as demonstrated in Formula (1):
where, \(n\) represents the number of individuals, \(\dim\) indicates the dimensionality of the search space, and \(x_{i,j}\) represents jth dimension of individual i. It is noteworthy that each position is generated through uniform distribution, as illustrated in Formula (2):
where, \(rand(0,1)\) denotes a random number between 0 and 1, while \(ub_{j}\) and \(lb_{j}\) correspond to the upper and lower bound values, respectively.
Formula (3) provides a means of evaluating the fitness score for each individual in the search population. This score serves as a metric to assess their overall level of fitness within the context of the study.
In the LSA algorithm, the balance control factor \(\delta\) realizes the conversion from global exploration to fine-tuning in a dynamic and self-adaptive way, and the calculation method is:
where, the balance factors \({\delta}_{init}\) and \({\delta}_{final}\) refer to the initial and eventual values, respectively, while \({t}_{\max }\) signifies the maximum iteration count. Additionally, \(y^{t} \in ( - 1,1)\) is a chaotic sequence. The multiplication factors λ and γ are defined.
The selection of multiplication factors λ and γ is discussed herein. To ensure that the balance control factor δ remains within the interval (0, 1), we first analyze the selection of various values for γ (see Figs. 3 and 4) . Figure 4 indicates that the requirement is satisfied when 1.4 < γ < 2.2. Building on this observation, we further refine the selection of γ by testing values of 1.5, 1.6, 1.7, 1.8, 1.9, 2.0, and 2.1 on 30 benchmark functions from CEC 2014. Test results show that the choice of γ minimally affects the LSA algorithm’s outcomes; however, slightly superior performance is observed when γ equals 2 (refer to Appendix Table 27). Therefore, for brevity, we set γ to 2 in this paper. Additionally, we explore the impact of λ on the LSA algorithm across various values. To ensure a balance between global exploration and local exploitation capabilities, the LSA algorithm should exhibit strong global exploration abilities in early iterations and potent local exploitation capabilities along with the ability to escape from local optima in later iterations. Consequently, some individuals in later iterations of LSA should conduct global exploration operations to prevent the algorithm from converging to local optima. As depicted in Fig. 3, the value of λ should range between (0.5, 0.85) (when λ is too large, δ exceeds 1). To precisely determine the value of λ, experiments are conducted with λ set to 0.5, 0.6, 0.7, 0.75, and 0.8, respectively. Statistical analysis of the results in Appendix Table 26 reveals that setting λ to 0.75 yields 10 optimal results, making it the most favorable choice among these scenarios. In summary, setting λ to 0.75 and γ to 2 is deemed reasonable. Initially, \(\delta\) continually decreases, indicating the transition from wide-ranging exploration to focused searching. However, as the process proceeds, some individuals fall into local optimization, resulting in an increase of \(\delta\). To mitigate this issue, \({\delta}_{init}\) and \({\delta}_{final}\) are assigned the values 1 and 0, respectively, to enable dynamic balancing between international and regional development in the proposed algorithm.

The range of the balance control factor δ when the multiplication factors λ take different values

The range of the balance control factor δ when the multiplication factors γ take different values
This approach ensures that the algorithm maintains a balance between wide-ranging exploration and local refinement during the entire iteration process, thus enabling it to achieve both objectives effectively. It increases the likelihood of conducting extensive global search in the initial stages of evolution and progressively shifts focus towards thorough local search in later stages. Consequently, this method optimally balances the algorithm’s capacity for broad-based exploration and targeted growth.
3.3.2 Exploration phase
The historical experiences of humanity offer valuable insights for the education of posterity and individual learning journeys. To make the algorithm have a strong global exploitation ability, this paper used the historical experience and other individual information to guide the search progress. The individuals in the population learn from past events and the current inhabitants at a random probability, and the corresponding updated schematic diagram is illustrated in Fig. 5(c). The mathematical model is shown in Formula (6).
where, \({x}_{i}^{t}\) represents the ith learning individual, while \({x}_{j}^{t}\) denotes an individual selected at random from the identical population. The new individual is denoted by \({x}_{i}^{t + 1}\), and \(rand\) is randomly generated with support [0,1]. Additionally, \({history}_{r}^{t}\) represents an individual randomly selected from the past experience database. In the initial phase of populating, Formula (2) is utilized to produce a population of equal size, with \(x\) being assigned random values. In every iteration, \(history\) is modified using Eq. (7), and the matrix of \(history\) suffers random variations according to Formula (8).
where, \({\text{a}}\) and \({\text{b}}\) are randomly generated with support [0,1]. The variable \(permuting\) represents a random permutation operation.

Different search patterns of the individuals in 2D search space (a) The individual's active learning mode (b) The radiation pattern of role models (c) Global exploration mode
3.3.3 Exploitation phase
The learning process involves learners acquiring knowledge from historical experiences, while simultaneously enhancing the overall learning ability of the population. This is achieved through active learning from role models, who are identified as optimal individuals exhibiting effective teaching behaviors. Nonetheless, equitable benefits from these role models are not experienced by all individuals within the population due to limited capacity to acquire knowledge. Thus, it is imperative to ascertain the ideal number of beneficiaries derived from the role models to attain optimal enhancement efficacy. Psychological research has indicated that the average attention span of an individual typically ranges from 7 to 9 (Schoenewolf 1990; Bruner 1971, 2009). Consequently, an excessive number of teachers can hinder the teaching process, leading to challenges in fully utilizing the instructional potential of role models. Considering the aforementioned analysis, it is evident that certain individuals actively learn from role models, while role models specifically instruct select individuals on particular occasions. The learning schematic diagrams for the algorithm are presented in Fig. 5(a) and (b), accompanied by the corresponding mathematical model illustrated in Formula (9).
where, \(rand\) and \(r\) are randomly generated with support [0,1]. \(x_{best}^{t}\) denote the position of the role model. The degree to which the learner acquires knowledge from the role model is modulated by the learning factor denoted as”\(\beta\)”, which is computed using Formula (10). Moreover, we also compute the \(x_{average}^{t}\) using Formula (11).
where, we investigate the relationship between the number of objects taught by role models \(\left(sub\right)\), the algorithm effectiveness \(\left(sub=3\right)\), and a random integer \(\left(randi\right)\). The experimental measurement process reveals that the algorithm achieves optimal performance when \(sub = 3\). Additionally, \(randi\) is a randomly selected integer within the range of 1 to sub, where sub represents a specific value.
During this stage, learners enhance their knowledge acquisition through the teaching method employed by role models. This directed learning from role models effectively enhances the overall learning ability of the learners.
3.3.4 Cross boundary processing
During the search process, individuals in the population may exceed the constraint of the problem domain, so it is necessary to handle individuals outside the boundary. Meanwhile, different boundary processing methods have the particular effect on the efficiency. The processing method adopted by this algorithm is shown in Formula (12):
where, \(lb\) and \(ub\) correspond to the upper and lower bound values, respectively.
3.4 The procedure of LSA
Based on the earlier theoretical analysis, the LSA consists of two primary stages: global discovery and regional growth. In the global discovery stage, the algorithm simulates learning behaviors by drawing upon previous learning and unique learning tendencies observed in contemporary society. Conversely, the regional growth stage emulates instruction and acquisition behaviors. In this section, we present a comprehensive overview of the key procedures employed by LSA. Additionally, to assist with implementation, we provide the pseudo-code of the algorithm in Fig. 6 and Algorithm 1.

Flow chart of LSA algorithm
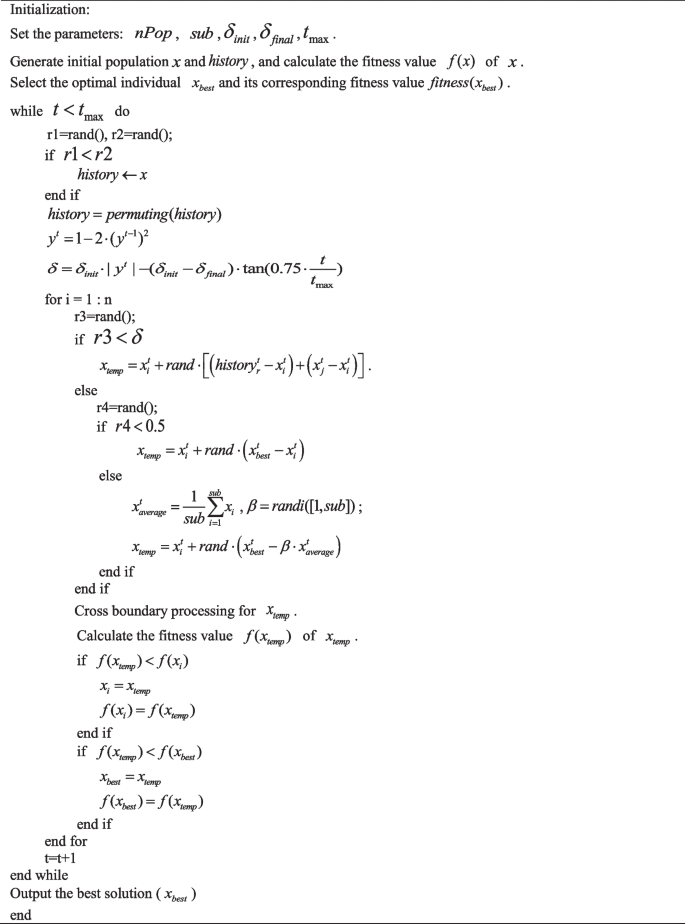
The pseudo code of LSA
3.5 Time complexity analysis
The time complexity of the proposed LSA algorithm serves as a crucial performance indicator. The entire LSA process consists of three key steps: the initial setup, evaluation of fitness value, and refinement of the learning search process. The computation complexity of the initialization process is \(O(nPop)\). During each iteration, approximately \(\delta \cdot nPop\) individuals engage in global development operations, \((1 - \delta ) \cdot nPop/2\) participants utilize the role model guidance strategy, and \((1 - \delta ) \cdot nPop/2\) individuals utilize the active learning strategy from role models. As a result, the time complexity of LSA can be estimated as approximately \(O(nPop) + O(t_{\max } \cdot \delta \cdot nPop) + O(t_{\max } \cdot (1 - \delta ) \cdot nPop/2) + O(t_{\max } \cdot (1 - \delta ) \cdot nPop/2) = O(n + t_{\max } \cdot nPop)\).
A heatmap visually represents data using color gradients to illustrate variations in data magnitude, aiding in the comprehension of correlations and trends. In Fig. 7, darker hues indicate longer algorithm runtimes. Here, we examine the time efficiency of the LSA algorithm in addressing optimization problems from two angles. Firstly, we analyze its overall time complexity, which hinges on factors such as population size, iteration count, and problem intricacy. Figure 7(a) illustrates that, with a set number of iterations, larger populations incur greater time costs (as depicted by colors closer to red), albeit with improved algorithmic precision (as indicated in Appendix Table 28). Conversely, Fig. 7(b) demonstrates that, with a fixed evaluation count, solving more complex problems consumes more time (evident in functions F26 and F27, represented by darker colors), albeit with marginal gains in precision (as shown in Appendix Table 29). Secondly, we scrutinize algorithm runtime and precision through specific execution strategies, comparing outcomes with varied balance control values (denoted by δ) using formula (5). Figure 7 reveals that setting δ to 0 results in maximal execution times (reflected by red hues), while δ set to 1 minimizes execution times (reflected by blue hues). This disparity arises from δ’s influence on the algorithm’s tendency towards local exploitation (Eqs. (10)-(11)) or global exploration (Eq. (6)), impacting time costs. However, employing a fixed δ value compromises search precision compared to formula (5) (as detailed in Appendix Table 30).

Time consumption of the LSA algorithm under different parameters. a Time spent executing CEC 2014 functions with fixed number of iterations. b Time spent executing CEC 2014 functions with fixed number of evaluations. c Time spent executing CEC 2014 functions with different values of δ
3.6 Convergence analysis
3.6.1 Markov chain model of the LSA algorithm
Definition 1: The state of a learning agent and state space of a learning agent.
The state of a learning agent is composed of the position \(x\) and the global best position \(best\), denoted as \(I = (x,best)\), where \(x \in A,best \in A\) and \(f(best) \le f(x)\), \(A\) is a feasible solution within the spatial range. The possible states of all learning agents constitute the state space of a learning agent, denoted as:
Definition 2: The state of a learning swarm and state space of a learning swarm.
The states of all individual learners within a learning swarm constitute the state of the learning swarm. The state of the \(m\) learners in the learning swarm at time \(t\) is denoted as \(s_{t} = (I_{{_{1} }}^{t} ,I_{{_{2} }}^{t} ,...,I_{{_{i} }}^{t} ,...I_{{_{m} }}^{t} )\), where \(I_{{_{i} }}^{t}\) represents the i-th learner in the population at time \(t\), and \(m\) is the total number of learners in the population. The collection of all possible states of the learning swarm forms the state space of the learning swarm, denoted as:
Definition 3: The state transition of individual learners.
For \(\forall I_{i} = (x_{i} ,best_{i} ){|} \in I,\forall I_{j} = (x_{j} ,best_{i} ){|} \in I\), the state \(I_{i}\) of an individual learner transitions to another state \(I_{j}\) in one step, denoted as \(T_{I} (I_{i} ) = I_{j}\).
Theorem 1: In the LSA algorithm, the probability of the state transition from state \(I_{i}\) to state \(I_{j}\) of an individual learner can be expressed as:
Proof:
In the LSA algorithm, the algorithm primarily consists of two phases: the exploration phase and the exploitation phase. The exploitation phase is further comprised of two distinct update modes: “Active learning” and “Role models teaching”.
In each position update strategy, the state of an individual learner is formed by the position \(x\) and the global best position \(best\). Therefore, the corresponding one-step transition probability also varies. Considering that the learner’s vector is multidimensional and the population forms a set of points in a multidimensional hyperspace, the process of the learner’s position change can be regarded as the transformation between points in this hyperspace.
-
(i)
According to Definition 3 and the geometric interpretation of the LSA algorithm, the one-step transition probability from state \(I_{i}\) to another state \(I_{j}\) in the exploration phase is given by:
$$p(T_{e} (I_{i} ) = I_{j} ) = p_{e} (x_{i} \to x_{j} ) \cdot p_{best} (best_{i} \to best_{j} )$$(16)where, the one-step transition probability from the individual’s global best solution to another state is given by:
$$p_{best} (best_{i} \to best_{j} ){ = }\left\{ \begin{gathered} {1, }f(best_{i} ) \le f(best_{j} ) \hfill \\ {\text{0, other}} \hfill \\ \end{gathered} \right.$$(17)The probability of the learning individual transitioning from position \(x_{i}\) to position \(x_{j}\) through the exploration phase search strategy is:
$$p_e(x_i\rightarrow x_j)=\left\{\begin{array}{l}\frac1{\left|rand\cdot\left[\left(history_r-x_i\right)+\left(x_j-x_i\right)\right]\right|},x_j\in\left[x_i,x_i+rand\cdot\left(\left(history_r-x_i\right)+\left(x_j-x_i\right)\right)\right],\,r<\delta\\0,\,other\end{array}\right.$$(18) -
(ii)
The transition probability from state \(I_{i}\) to another state \(I_{j}\) through the active learning strategy is:
$$p_{a} (T_{I} (I_{i} ) = I_{j} ) = p_{a} (x_{i} \to x_{j} ) \cdot p_{best} (best_{i} \to best_{j} )$$(19)where, the probability of the learning individual transitioning from position \(x_{i}\) to position \(x_{j}\) in one step is:
$$p_a(x_i\rightarrow x_j)=\left\{\begin{array}{l}\frac1{\left|x_i+rand\cdot\left(x_{best}-x_i\right)\right|},x_j\in\left[x_i,x_i+rand\cdot\left(x_{best}-x_i\right)\right],\;r\geq\delta\&r1<0.5\\0,\;other\end{array}\right..$$(20) -
(iii)
The transition probability from state \(I_{i}\) to another state \(I_{j}\) through the Role models teaching strategy is:
$$p_{r} (T_{I} (I_{i} ) = I_{j} ) = p_{r} (x_{i} \to x_{j} ) \cdot p_{best} (best_{i} \to best_{j} )$$(21)where, the probability of the learning individual transitioning from position \(x_{i}\) to position \(x_{j}\) in one step is:
$$p_r(x_i\rightarrow x_j)=\left\{\begin{array}{l}\frac1{\left|x_i+rand\cdot\left(x_{best}-\beta\cdot x_{average}\right)\right|},x_j\in\left[x_i,x_i+rand\cdot\left(x_{best}-\beta\cdot x_{average}\right)\right],\;r\geq\delta\&r1\geq0.5\\0,\;other\end{array}.\right.$$(22)
Definition 4: The state transition of learning community.
For \(\forall s_{i} \in S,\forall s_{j} \in S\), in the iteration of LSA algorithm, the learning community transition from state \(s_{i}\) to another state \(s_{j}\) in a single step, denoted as \(T_{S} (s_{i} ) = s_{j}\). The transition probability for the learning community state \(s_{i}\) to transition to another state \(s_{j}\) in a single step is:
where, \(m\) represents the number of individuals in the population. This equation states that the one-step transition from learning group state \(s_{i}\) to state \(s_{j}\) is the transition of the individual states from all individuals in group space \(s_{i}\) to the corresponding individual states in \(s_{j}\).
3.6.2 Convergence analysis of LSA algorithm
Definition 5: Markov chain.
In a stochastic process, let process \({\{x_{n} {,}n \in T\}}\) have parameter set T as a discrete time series, denoted as \(T = \{ 0,1,2,...\}\), where the entire set of possible values \(x_{n}\) constitutes a discrete state space \(I = {\{i_{1} {,}i_{2} ,i_{3} ,...\}}\). If for any integer \(n \in T\) and any \(i_{1} {,}i_{2} ,i_{3} ,...,i_{n + 1} \in I\), the following conditional probability \(p{\{x_{n + 1} = i_{n + 1} {|}x_{n} = i_{n} \}}\) holds, then \({\{x_{n} {,}n \in \mathrm{T}\} }\) is termed as a Markov chain.
Definition 6: Finite Markov chain.
If the state space \(I\) is finite, then the Markov chain is referred to as a finite Markov chain.
Definition 7: Homogeneous Markov chain.
\(p{\{x_{n + 1} = i_{n + 1} {|}x_{n} = i_{n} \}}\) represents the conditional probability that the system, in state \(i_{n}\) at time \(n\), transitions to a new state \(x_{n + 1}\). If this probability depends only on the state at time \(n\) and not on time \(n\), then the Markov chain is referred to as a homogeneous Markov chain.
Theorem 2: In the LSA algorithm, the state sequence \(\left\{ {s(n);n \ge 0} \right\}\) of the learning community is a finite homogeneous Markov chain.
Proof:
-
(i)
According to Definition 4, it is known that in the state transition of the learning community, there exists a state \(\forall {\text{s}}(n) \in S,\forall {\text{s}}(n + 1) \in S\) in the sequence \({\{ \text{s(n);n}} \ge {0\}}\), and its transition probability \(p(T_{S} (s(n)) = s(n + 1))\) is determined by the transition probabilities \(p(T_{S} (I_{i} (n)) = I_{j} (n + 1))\) of all learning individuals in the community. From Eqs. (15) to (22), it is known that the state transition probability of any individual in the learning community is only related to the control factors \(\delta\), the states \((x_{i} ,best)\) at time \(n\), \(x_{average}\), a random number \(r,r_{1}\) between [0,1], and \(\beta\), but is independent of time \(n\). Based on the above analysis, the state transition probability \(p(T_{S} (s(n)) = s(n + 1))\) of the learning community only depends on the individual states at time \(n\), therefore, the sequence \({\{ \text{s(n);n}} \ge {0\}}\) exhibits the Markov property.
-
(ii)
From Eqs. (16) to (22), it can be seen that \(p(T_{S} (s(n)) = s(n + 1))\) is independent of the time \(n\). Combining with (i), it can be inferred that the sequence \({\{ \text{s(n);n}} \ge {0\}}\) is a homogeneous Markov chain.
-
(iii)
When optimizing any problem in a computer, the variables used to describe the optimization problem are represented with a certain precision, and the search space is finite. In any individual \(I_{i} = (x_{i} ,best)\) of the learners, the dimensions of \(x_{i}\) and \(best\) are finite, and \(x_{i}\) and \(best\) are also constrained by \([x_{\min } ,x_{\max } ]\). Therefore, the space of learning individuals \(I\) is finite. And the learning community composed of \(m\) learning individuals is also finite.
Based on (i), (ii), and (iii), it can be inferred that the state sequence \({\{ \text{s(n);n}} \ge {0\}}\) of the learning community is a finite homogeneous Markov chain.
Convergence criterion
The LSA algorithm belongs to the category of stochastic search algorithms, thus in this paper, the convergence behavior of the LSA algorithm is determined using a convergence criterion based on random algorithms (Solis and Wets 1981).
For the optimization problem < A, f > , where A is the feasible solution space and f is the fitness function, if there is a stochastic optimization algorithm D and the result of the k-th iteration is \(x_{k}\), then the result of the next iteration is \(x_{k} { = }D(x_{k} ,\zeta )\), where \(\zeta\) represents solutions previously encountered during the iterative search process of algorithm D. The lower bound of the search is defined as:
where, \(v(x)\) represents the Lebesgue measure on the set \(x\). The region of optimal solutions is defined as:
where, \(\varepsilon > 0\) and \(C\) are sufficiently large positive numbers. If the stochastic algorithm D finds one point in \(R_{\varepsilon ,M}\), it can be considered that the algorithm has found an acceptable global optimal or approximately global optimal point.
Condition H1: If \(f(D(x_{k} ,\zeta ) \le f(x))\), then \(\zeta \in A\) implies \(f(D(x_{k} ,\zeta ) \le f(\zeta ))\).
Condition H2: For \(\forall B \in A\), s.t. \(v(B) > 0\), there exists \(\prod\limits_{k = 0}^{\infty } {(1 - u_{k} (B))} = 0\), where \(u_{k} (B)\) is the probability measure of the k-th iteration search solution of algorithm D on set \(B\).
Theorem 3: Let \(f\) be measurable, and let \(A\) be a measurable subset of \(R^{n}\). Suppose algorithm D satisfies conditions H1 and H2, and \(\{ x_{k} \}_{k = 0}^{\infty }\) is the sequence generated by algorithm D. Then, there exists a probability measure \(\mathop {\lim }\limits_{k \to \infty } P(x_{k} \in R_{\varepsilon ,M} ) = 1\),where \(R_{\varepsilon ,M}\) is the optimal region, i.e., algorithm D globally converges.
LSA Algorithm Convergence
Theorem 4: The LSA algorithm satisfies condition H1.
Proof: In the LSA algorithm, individual current optimal positions are updated at each iteration, denoted as follows.
Therefore, the LSA algorithm preserves the best position of the population at each iteration, satisfying condition H1.
Definition 8: Set of optimal states of learners, denoted as G.
Let \(g^{*}\) be the optimal solution of the optimization problem < A, f > , and let \(G = \{ s{ = (}x{)|}f(x) = f(g^{*} ),s \in S\}\) denote the set of optimal states of learners. If \(G = S\), then each solution in the feasible solution space is not only feasible but also optimal. In this case, optimization is meaningless, and the following discussions are based on \(G \subset S\).
Definition 9: Absorbing state Markov chain.
Based on the population sequence from the LSA algorithm, a Markov chain \(\{ s(t),t \ge 0\}\) and the set of optimal states \(G = S\) are defined. If \(\{ s(t),t \ge 0\}\) satisfies the conditional probability \(p\{ x_{k + 1} \notin G|x_{k} \in G\} = 0\), then this Markov chain is called an absorbing state Markov chain.
Theorem 5: The Markov chain generated by the LSA algorithm is an absorbing state Markov chain.
Proof:
In the optimization of LSA, the update of individuals adopts the mechanism of preserving the best individuals. That is, only when the fitness value of the current best individual is better than the fitness value of the original individual, will the original best individual be replaced, as shown in Eq. (26). This ensures that in each iteration of the algorithm’s evolution process, the newly generated individuals are not inferior to those generated before. Therefore, the conditional probability \(p\{ x_{k + 1} \notin G|x_{k} \in G\} = 0\) is satisfied, that is, the population sequence \(\{ s(t),t \ge 0\}\) of the LSA algorithm forms an absorbing state Markov chain.
Definition 10: Let set \(D\) be a non-empty subset of the state space \(S\). If \(\forall i \in D,\forall j \notin D\), there exists \(p(i \notin D|j \in D){ = 0}\), then \(D\) is called a closed set.
Definition 11: Let the set of optimal learning individual states be denoted as \(M\), the set of optimal learning group states be denoted as \(G\), and the global optimal solution of the optimization problem be denoted as \(best^{*}\), then
where, \(I_{{\text{t}}}^{*} \in S\) represents the optimal learning individual state.
where \({\text{S}}_{n}^{*} = {\text{(I}}_{{_{1} }}^{*} {\text{,I}}_{{_{2} }}^{*} {,}...{\text{,I}}_{{_{i} }}^{*} {,}...{\text{I}}_{{_{m} }}^{*} {)}\) represents the optimal state of the population.
Theorem 6: The set of optimal states for individual learning, denoted as \(M\), is a closed set.
Proof:
Let the learning individual state \(I_{{^{i} }}^{n} = (x_{i}^{n} ,best^{*} )\) be the optimal state. According to the execution strategy of the LSA algorithm, it is evident that the next moment’s state \(I_{{^{i} }}^{{n{ + 1}}} = (x_{i}^{{n{ + 1}}} ,best^{*} )\) is also the optimal state. This can be concluded based on formulas (16)-(22).
In other words, \(\forall I_{{^{i} }}^{n} \in M,I_{j}^{n + 1} \notin M\), \(p(I_{{^{i} }}^{n} \to I_{{^{j} }}^{n + 1} ) = {0}\). Therefore, the set \(M\) of optimal states for the individual learner is a closed set.
Theorem 7: In the LSA algorithm, the set of optimal states for the learning population,\(G\), is a closed set.
Proof:
\(\forall s_{i} \in G,\forall s_{j} \notin G,s_{j} \in S\), for any step size \(l,l \ge 1\), according to the Chapman-Kolmogorov equation, we can obtain:
where,\(s_{ru - 1} \in G,s_{ru} \notin G,1 \le u \le l\), it can be inferred from Definition 4:
Due to \(\exists I_{k}^{ru - 1} \in M,I_{k}^{ru} \notin M\), then \(f(I_{k}^{ru} ) > f(I_{k}^{ru - 1} ) = f(I^{*} )\). According to Eq. (17), \(p_{*} (best_{k}^{ru - 1} \to best_{k}^{ru} ) = 0\), so \(p(T_{S} (s_{ru - 1} ) = s_{ru} ){ = 0}\), which means \(p(i \notin G|j \in G){ = 0}\). Therefore, \(G\) is a closed set in the \(S\) space.
Definition 12: For any \(n \ge 1\), when \(l \ge n + 1\), if \(best^{l} { = }best^{n}\) always holds true, \(s(n) \in S\) is referred to as an absorbing state. A set \(H\) constructed solely from a single absorbing state is called a closed set.
Theorem 8: Let \({\{ \text{s(n),n}} \ge {1\}}\) be a Markov chain representing the state sequence of a learning population, and \(\Lambda { = }G \cup H\) be a closed set. When \(\sum\limits_{n = 1}^{\infty } {p_{S} {\{ \text{s(}}n{)\} <\, }\infty }\), then \(p(\mathop {\lim }\limits_{n \to \infty } {\text{s(}}n{)} \in \Lambda ){ = }1\).
Proof:
Based on the fact that all \(G,H\) are closed sets, it follows that \(\Lambda { = }G \cup H\) is also a closed set. Assuming that the learning population is in set \(\Lambda\) at time \(n\) and in state \(S(n{ + 1})\) at time \(n{ + 1}\) while being in state \(S(n)\), we can conclude \(p_{S} {\{ \text{s(n + 1)}} \notin \Lambda {\text{|s(n)}} \in \Lambda {\} \text{= 0}}\). Therefore,
If the learning population is in state \(S(n){ = (}I_{1}^{n} {,}I_{2}^{n} {,}...{,}I_{m}^{n} {)} \notin \Lambda\), then \(\forall i \in [1,m],I_{i}^{n} \notin G,and \, I_{i}^{n} \notin H\) holds.
Then
By summing up \(n\), we can obtain
Due to
So
Then
So, when \(n \to \infty\) and \(\sum\limits_{n = 1}^{\infty } {p_{S} {\{\text{ s(}}n{)\}\text{ < }}\infty }\), \(p(\mathop {\lim }\limits_{n \to \infty } {\text{s(}}n{)} \in \Lambda ) = {1 - }p(\mathop {\lim }\limits_{n \to \infty } {\text{s(}}n{)} \notin \Lambda ){ = }1\).
Theorem 9: The LSA algorithm converges to the global optimum.
Proof: According to Theorem 4, it is known that the LSA algorithm satisfies condition H1. By Theorem 8, it is known that the probability of the LSA algorithm continuously searching for the global optimum for an infinite number of times is zero, thus there exists an \(\prod\limits_{k = 0}^{\infty } {(1 - u_{k} (B))} = 0\) satisfying condition H2. According to Theorem 3, it can be concluded that the LSA algorithm is a globally convergent algorithm.
3.7 The difference between TLBO and LSA
Teaching–learning-based optimization (TLBO) and Learning Search Algorithm (LSA) share common features as population-based algorithms inspired by human learning behavior. However, they diverge significantly in several aspects. Firstly, TLBO draws inspiration from the classroom teaching model, where knowledge transfer occurs bidirectionally: students learn from teachers, and teachers impart knowledge to students through direct instruction. Conversely, LSA predominantly acquires knowledge through individual learning from historical experiences (including both past and contemporary sources) and individuals emulating role models around them, with these role models disseminating knowledge to those receptive to specific learning aspects. Hence, the learning mechanisms of the two algorithms differ. Secondly, TLBO adopts a uniform knowledge dissemination approach throughout the entire population, overlooking individual physiological traits, which can hinder knowledge acquisition. In contrast, LSA, during its developmental phase, fully integrates learners’ unique attributes into the acquisition process, leveraging their ability to absorb knowledge from role models and learn from exceptional individuals. Thirdly, TLBO lacks distinction between global exploration and local exploitation phases, with all individuals following uniform learning and teaching strategies. In contrast, LSA embodies both phases and achieves a harmonious balance between global exploration and local exploitation through adaptive adjustment of balancing factors. Lastly, owing to its diverse learning strategies, LSA surpasses TLBO in search results for optimization problems like Unimodal Functions, Multimodal Functions, Hybrid Functions, and Composition Functions. This comprehensive superiority stems from LSA’s multifaceted learning approaches.
4 Experiment and simulation
To estimate the adequacy of the proposed approach, we conducted a comparative analysis against other state-of-the-art algorithms. Our implementation of the LSA algorithm was conducted utilizing MATLAB R2016a. The experimental setup comprises a personal computer equipped with an AMD Ryzen 74700G with Radeon Graphics and 12 GB main memory. The study employed a diverse set of test problems, including 30 IEEE CEC2014 and 10 IEEE CEC2020 benchmark functions, 6 challenging real-world engineering design optimization problems, and 15 feature selection datasets from UCI. Table 2 presents a collection of 40 minimization functions called CEC2014 and CEC2020, which is a powerful set of real-parameter optimization benchmarks. These functions effectively mimic real-world optimization problems. To assess the performance of the LSA, we selected 9 prominent swarm intelligence optimization algorithms and 11 powerful recently developed algorithms as a comparison. The population size (nPop) was set at 50, and the number of evaluations (FEs) was set at 1000*nPop. The search dimension was fixed at 10, whereas the parameter values for the comparison algorithms are presented in Table 3.
In order to ensure the reliability of our results, we executed each test 20 times independently and highlighted the best-performing outcomes in the data statistics tables. Furthermore, to investigate the statistical significance of our results, we employed the Wilcoxon test at a significance level of 0.05. The symbols “/ = /-” were adopted to indicate whether the LSA algorithm is superior, equal to, or inferior to the comparison algorithms in terms of performance.
4.1 Results of IEEE CEC 2014 and CEC 2020
This section presents a comprehensive analysis of the proposed LSA algorithm as well as various state-of-the-art original and enhanced algorithms with improved search performance. The IEEE CEC 2014 and CEC 2020 benchmark functions have been chosen as the evaluation benchmarks for this study.
4.1.1 The search process experiment of LSA
In this subsection, the proposed LSA algorithm is utilized to solve a range of benchmark functions, and a detailed analysis of the optimization process is conducted.
Figure 8(a) illustrates the three-dimensional mathematical model of the benchmark function. Notably, the mathematical model of F2 exhibits relative simplicity, while the remaining four functions possess a higher level of complexity. Figure 8(b) demonstrates the search trajectory of the proposed algorithm from a top-down perspective. The larger blue dots represent the best search positions during the search process, while the other colored dots denote the positions of the search individuals throughout iterations. Additionally, Fig. 8(c) depicts the progression of the average fitness value for the entire population. It is evident from Fig. 8(b) that for both simple and complex functions, numerous historical search trajectories of individuals are concentrated in proximity to the global optimum, effectively ensuring the thoroughness of local search. Moreover, several discrete colored points are scattered in other regions, demonstrating the capability of the algorithm to perform global exploration and avoid being trapped in local optima. The convergence of the average fitness curve in all mathematical models is evident in Fig. 8(c), underscoring the robust search capability of the LSA algorithm. In Fig. 8(e), it’s evident that the LSA algorithm achieves a balanced approach between Exploration and Exploitation over time (the computational methods for Exploration and Exploitation are based on literature (Cheng et al. 2014; Hussain et al. 2019)). As iterations progress, Exploitation steadily approaches 100 while Exploration declines towards 0. Analysis of functions F2, F8, and F15 reveals a rapid decrease in population diversity, showcasing the algorithm’s robust exploitation abilities. Conversely, for hybrid and composite functions like F25 and F27, population diversity fluctuates notably (the computational methods for calculating population diversity are based on literature (Cheng et al. 2014; Hussain et al. 2019).), consistently remaining at a higher level, demonstrating the algorithm’s strong global exploration capabilities (as shown in Fig. 8(d)).

Visualization of the algorithm’s search process. a 3-dimensional mathematical models of the function. b The search trajectory during the optimization process is displayed from a top view. c Changes in the average fitness value of the population. d Population diversity. e Exploration and exploitation capabilities of the algorithm
4.1.2 Comparison with well-known original algorithms
This subsection tests the performance of the target algorithm LSA and other well-known original algorithms, including GWO (Mirjalili et al. 2014; Long et al. 2020), HHO (Chen et al. 2020b), HPO (Naruei et al. 2022), MFO (Mirjalili 2015b), SSA (Mirjalili et al. 2017; Abualigah et al. 2020), BWOA (Hayyolalam and Kazem 2020), SOA (Ramshanker and Chakraborty 2022), TLBO (Rao et al. 2011), and TSA (Kaur et al. 2020). In the CEC 2014 benchmark functions, F1-F3 are single-mode functions, and they are used to test the development ability of the algorithm; F4-F15 are multi-mode functions, and they have multiple local optimal values. If the algorithm's exploration ability is not sufficient, it will converge prematurely and quickly, or even fall into a local optimum, resulting in low convergence accuracy. F16-F21 are mixing functions, and F22-F30 are composition functions. These two types of functions are more challenging than the previous two types of functions, so they can better reflect the search performance of the algorithm. F31-F40 are the CEC 2020 benchmark functions. Table 4 presents the average and variance results of each algorithm for solving the CEC 2014 and CEC 2020 benchmark functions, and the best results are highlighted in bold. Figure 9 shows the convergence effect of the LSA and the comparison algorithms in solving 12 benchmark functions. Figure 10 illustrates the Friedman rank sum sorting results of each algorithm. Table 5 and Fig. 11 show the results of the Wilcoxon rank-sum experiment with a 5% significance.
individual's active learning mode

The convergence curves of LSA and other original algorithms on 12 benchmark functions

The results of the Friedman test for the LSA and other original algorithms

The graphical representation of the Wilcoxon signed rank test results of the LSA algorithm compared to the original algorithms
It can be seen from Table 4 that LSA ranks first on 24 functions and ranks second on six functions, with an overall rank of #1 (average rank AVG of 2.1). The results of the p values in Table 5 indicate that compared with the algorithms GWO, HHO, HPO, SSA, BWOA, MFO, SOA, TSA, and TLBO, the LSA obtained 27, 37, 35, 33, 38, 36, 36, 40, and 24 victories, showing a significant difference. Although the LSA algorithm obtained 3, 5, and 7 optimal results when solving Unimodal Functions (F1-F3), Multimodal Functions (F4-F16), and Hybrid functions (F17-F22) problems respectively, its overall optimal result rate is only (3 + 5 + 7)/22 = 68.18%. Moreover, when solving Composition Functions (F23-F30) problems, LSA only achieved 2 optimal results, whereas SOA obtained 3 optimal results. This indicates that SOA has certain advantages in solving Composition Functions problems. This also confirms the “No Free Lunch” (NFL) theorem, demonstrating that there is no one-size-fits-all solution for all optimization problems. However, compared to other algorithms, the LSA algorithm obtains the most optimal results in solving these two types of problems. The bubble chart in Fig. 11 vividly demonstrates the statistical superiority of the proposed algorithm over these well-known original algorithms in terms of search results.
According to the results of the Friedman rank sum test shown in Fig. 10, the LSA algorithm achieved the highest rank among all algorithms, with a rank mean of 2.09. Overall, these experimental results indicate that the LSA performs superiorly on the CEC 2014 and CEC 2020 functions and is stronger than other comparison algorithms.
Figure 9 illustrates the convergence curves of benchmark functions for GWO, HHO, HPO, SSA, BWOA, MFO, SOA, TSA, TLBO, and the proposed LSA algorithm. Based on the convergence curves of functions F1, F3, F7, F13, F17, F18, F20, F22, F25, F32, F35, and F37, the LSA algorithm achieves the highest fitness values and the fastest convergence speed among these unimodal functions, multimodal functions, hybrid functions, and composition functions. In contrast, other algorithms fail to obtain global solutions due to being trapped in local optima. Therefore, the experimental results demonstrate that LSA effectively utilizes its exploitation capability for unimodal functions and exploration capability for multimodal functions. The incorporation of exploration and exploitation stages ensures the global convergence of the LSA algorithm.
The stability of an algorithm is also an important indicator of whether it is good or bad. To examine the reliability, we selected F1, F3, F10, F18, F21, F26, F21, F30, and F34 as the test subjects. From the box diagram in Fig. 12, it can be seen that the box diagram of LSA algorithm is the most flat. This indicates that LSA algorithm has good stability.

The box plot of the results by well-known original algorithms
4.1.3 Comparison of LSA with recently proposed advanced improved algorithms
In this subsection, LSA is compared with 6 high-performance improved algorithms proposed in recent years, including GNHGWO (Akbari et al. 2021), GWOCS (Wang et al. 2022b), HPSOBOA (Zhang et al. 2020), NCHHO (Dehkordi et al. 2021), PSOBOA (Zhang et al. 2020), HFPSO (Aydilek 2018), FDB-AGDE (Guvenc et al. 2021), dFDB-MRFO (Kahraman et al. 2022), AFDB-SFS (Duman et al. 2023), FDB-TLABC (Duman et al. 2022), TSALSHADE (Abdesslem layeb 2023), and ISSA (Dorian Sidea 2024).
Table 6 shows the experimental results of these 12 algorithms on CEC 2020 functions. Table 7 presents the p-value results of the Wilcoxon test. It can be seen from Table 6 that the LSA obtained an AVG value of 2.8, ranking first overall. Meanwhile, the p-values in Table 7 and Fig. 16 indicate that compared to the algorithms GNHGWO, GWOCS, HPSOBOA, NCHHO, HFPSO, PSOBOA, FDB-AGDE, dFDB-MRFO, AFDB-SFS, FDB-TLABC, and TSALSHADE, the LSA obtained 7, 6, 10,10,10,7,3,6,4,6, and 6 victories, respectively, showing a significant difference. The Friedman rank sum value of the LSA in Fig. 13 is 2.8, which is the smallest among all algorithms. The sorting results indicate that the LSA ranks first among all algorithms. These experimental results show that the LSA achieves superior performance on the CEC 2020 function and is stronger than other algorithms. The excellent performance of the LSA makes it a new optimizer that can be applied to solve complex and realistic optimization problems.

Friedman test was performed to compare the results of the LSA with other enhanced algorithms
Appendix Table 25 presents the results of LSA and ISSA algorithms in solving CEC 2014 problem. From appendix Table 25, it can be observed that the LSA algorithm achieved victories in 28 test functions. Whether in single-modal, multi-modal, hybrid, or composite functions, the LSA algorithm outperformed the ISSA algorithm comprehensively.
The excellent convergence performance of the LSA algorithm is demonstrated in Fig. 14, compared with GNHGWO, GWOCS, HPSOBOA, NCHHO, HFPSO, PSOBOA, FDB-AGDE, dFDB-MRFO, AFDB-SFS, FDB-TLABC, and TSALSHADE. The main reason for this achievement is the combined effect of the LSA algorithm’s local exploitation strategies (Active learning strategy and Role models teaching strategy) and global exploration strategy.

LSA and other improved algorithms’ convergence curves on 9 CEC 2020 benchmark functions
In summary, LSA shows strong competitiveness compared with the top-performing meta-heuristic algorithms put forth in recent years. This indicates that our proposed LSA obtains good results in dealing with numerical optimization problems.
To test the stability of the LSA algorithm, we selected F31, F34, F35, F36, F37, and F38 as the test subjects. According to Fig. 15, compared with the distributions of optimal solutions, the box diagram of LSA algorithm is the most flat, indicating its good stability (Fig. 16).

The box plot of the results by recently proposed advanced improved algorithms for CEC 2020

The graphical representation of the Wilcoxon signed rank test results of the LSA algorithm compared to the other improved algorithms
4.1.4 Consumption time cost analysis
Tables 8 and 9 present the time consumption (unit: second) of each algorithm when solving the CEC2014 and CEC2020 functions. To more intuitively show the results, the proportion of time consumption is shown in Figs. 17 and 18.

The proportion of cost time for LSA compared to the original algorithms

The proportion of cost time for LSA compared to the improved algorithms
It can be seen from Table 8 that compared with the original benchmark algorithm, the average time consumption of the LSA when solving the CEC 2014 and CEC 2020 problems is 0.305 s, ranking in the middle of the nine algorithms. Figure 17 illustrates the percentage of the cost time by each algorithm in executing different test functions, providing a more intuitive reflection of the performance of the proposed algorithm in terms of execution time. Meanwhile, Table 9 and Fig. 18 demonstrate that compared with the newly proposed improved algorithm, the average time consumption of the LSA in solving the CEC 2014 and CEC 2020 problems ranks 6th. The relatively high time expense of the target algorithm is mainly due to the computation cost of determining the number of beneficiaries in the exemplar instructing process, which is calculated using Formula (11).
4.1.5 Parameter sensitivity analysis
Different parameters may have different influences on the performance of the algorithm. To explore the influence of the parameter sub (the number of subjects taught by role models) on the performance of the LSA, this paper selected different values of sub, i.e., 2, 3, 4, 5, 6, 7, and 8, to conduct experiments, and the values of other parameters remained the same. In addition, we discussed the impact of different values of parameter \(y^{0}\) and parameter \(\delta_{init} > 1\) on the algorithm. The test case was obtained from CEC 2014 and CEC 2020. Each test case was independently run 20 times, and the final results are presented in Table 10, where the optimal results are highlighted in bold.
It can be seen from Table 10 that when sub equals 3, the number of average optimal values obtained by the algorithm is the largest, indicating that the number of role models in teaching must be controlled within a certain range so that the teaching object effect can reach the best level. This is consistent with the analysis results in Sect. 3.3.3.
From the statistical results in Appendix Table 23, it can be observed that the best results were achieved when \(y^{0} = 0.75\), with a total of 21 instances. On the other hand, the least favorable results were obtained when \(y^{0} = 0.5\). Therefore, the value of \(y^{0}\) does have some impact on the target algorithm, although the fluctuation in the results of the problem-solving process is not significant.
According to the statistical results from Appendix Table 24, it can be observed that when \(\delta_{init} = 1\), the proposed algorithm achieves the best results with a count of 15, outperforming the cases where \(\delta_{init} > 1\). The analysis suggests that this improvement can be attributed to the excessive global exploration carried out by the algorithm during the iterative process when \(\delta_{init} > 1\), which consequently undermines the algorithm’s capability for local exploitation.
4.2 Results of real-world constrained optimization problems
The design of many real-world engineering structures is usually limited by various conditions. When solving such problems, engineers need to deal with additional constraints. To test the LSA algorithm in solving engineering real optimization problems, this paper selected 6 real-world engineering design problems, such as speed reducer design et al.
4.2.1 Speed Reducer Design (SRD)
The goal of SRD is to design a reducer with a minimum weight. SRD contains seven design variables and eleven inequality constraints. A detailed description of this problem can be found in the reference (Dhiman and Kumar 2017). The mathematical model of the problem is as follows:
where \(2.6 \le x_{1} \le 3.6,0.7 \le x_{2} \le 0.8,17 \le x_{3} \le 28,7.3 \le x_{4} \le 8.3,7.3 \le x_{5} \le 8.3,2.9 \le x_{6} \le 3.9,5 \le x_{7} \le 5.5\).
When testing LSA to solve this problem, this paper selected some well-known meta-heuristic algorithms proposed in recent years including STOA (Dhiman and Kaur 2019), TQA (Chen et al. 2022), HS (Dhiman and Kumar 2017), ESMA (Örnek et al. 2022), GSA (Karami et al. 2021), EJAYA (Zhang et al. 2021b), FDB-AGDE (Guvenc et al. 2021), dFDB-MRFO (Kahraman et al. 2022), AFDB-SFS (Duman et al. 2023), FDB-TLABC (Duman et al. 2022),and TSALSHADE (Abdesslem layeb 2023) as comparison algorithms. Table 11 shows the statistical results of the LSA and comparison algorithms for solving this problem. It can be seen from Table 11 that the LSA obtained the result of 2986.064(consistent with the results of FDB-AGDE, dFDB-MRFO, AFDB-SFS, and FDB-TLABC), which is the best among all compared algorithms.
4.2.2 The Tension/Compression Spring Design (TCSD)
In the design of engineering problems, in addition to considering the optimal objective function of the mathematical model of the designed product, designers also need to consider the corresponding constraints. TCSD is a classic engineering design problem, and its goal is to minimize the weight of the designed product. In this problem, there are three variables and four inequality constraints (Faramarzi et al. 2020), and the mathematical model is as follows:
where \(0.05 \le x_{1} \le 2,0.25 \le x_{2} \le 1.3,2 \le x_{3} \le 15\).
Various intelligent algorithms have been used to solve this engineering design problem, such as EO (Faramarzi et al. 2020), RL-BA (Meng et al. 2019), DDAO (Ghafil and Jármai 2020), SDO (Zhao et al. 2019), AFA (Dhrubajyoti et al. 2021), mGWO (Shubham and Kusum 2020), PFA (Yapici and Cetinkaya 2019), GCHHO (Song et al. 2021), VAGWO (Farshad et al. 2022), ExPSO (Khelil et al. 2022), TEO (Kaveh and Dadras 2017), QS (Zhang et al. 2018), FDB-AGDE (Guvenc et al. 2021), dFDB-MRFO (Kahraman et al. 2022), AFDB-SFS (Duman et al. 2023), FDB-TLABC (Duman et al. 2022),and TSALSHADE (Abdesslem layeb 2023). Table 12 presents the solution results of the LSA and the above comparison algorithms to this problem, and the best optimization results are marked in bold. It can be seen from Table 12 that in terms of Best, Mean, Worst, and Std, the LSA obtains the best solution result. Table 13 indicates that the best result of the LSA for solving this engineering problem is 0.009872, and the values of \(x_{1} ,x_{2}\) and \(x_{3}\) are 0.05, 0.374433, and 8.546567, respectively.
4.2.3 Pressure Vessel Design (PVD)
PVD is another classic constrained optimization problem with four optimization variables and four constraints. Its goal is to minimize the total cost of materials in forming and welding cylindrical vessels. The mathematical model is as follows:
where \(0 \le x_{1} ,x_{2} \le 100,10 \le x_{3} ,x_{4} \le 200\).
To explore the performance of the LSA in solving PVD, this paper selected some high-performance improved meta-heuristic algorithms recently proposed as comparison algorithms, including BIANCA (Montemurro et al. 2013), G-QPSO (Santos Coelho 2010), HAIS-GA (Coello and Cortés 2004), CB-ABC (Brajevic 2015), NHAIS-GA(Bernardino et al. 2008), DEC-PSO (Chun et al. 2013), T-Cell (Aragón et al. 2010), FDB-AGDE (Guvenc et al. 2021), dFDB-MRFO (Kahraman et al. 2022), AFDB-SFS (Duman et al. 2023), FDB-TLABC(Duman et al. 2022),and TSALSHADE (Abdesslem layeb 2023). It can be seen from Tables 14 and 15 that the LSA, FDB-AGDE, dFDB-MRFO, AFDB-SFS, and FDB- TLABC achieve the best optimization result, and the objective function value is 5885.333, which is obviously better than those of other comparative algorithms.
4.2.4 Three-bar Truss Design (TTD)
The TTD problem is another classic minimization problem in engineering design, and its structure can be found in the reference (Ghasemi et al. 2022). It has 3 variants and 4 inequality constraints, and its goal is to minimize the weight of the three trusses.
where \(0 \le x_{1} \le 1,0 \le x_{2} \le 1,\)\(l = 100cm,P = kN/cm^{2} ,\sigma = 2kN/cm^{2}\).
Table 16 shows the statistical results of each algorithm to solve the TTD problem, where the best results are highlighted in bold. According to the statistical results, LSA, FDB-AGDE, dFDB-MRFO, AFDB-SFS and FDB-TLABC obtained the best optimal value (263.8523) among all the 15 comparison algorithms.
4.2.5 Cantilever Beam Design (CBD)
The CBD is a civil engineering structural design problem consisting of 5 hollow elements, each of which has an equal thickness. Its objective function is to minimize the weight of the cantilever beam. The mathematical model of this problem is represented below:
where \(b = (b_{1} ,b_{2} ,b_{3} ,b_{4} ,b_{5} ) = (67,37,19,7,1)\)\(0.01 \le x_{i} \le 100,i = 1,...,5\).
To test the ability of the proposed LSA to solve this problem, this paper selected 5 algorithms, STOA (Dhiman and Kaur 2019), TQA (Chen et al. 2022), GCA_I (Kumar et al. 2020), GCA_II (Kumar et al. 2020), SMA (Li et al. 2020c), FDB-AGDE (Guvenc et al. 2021), dFDB-MRFO (Kahraman et al. 2022), AFDB-SFS (Duman et al. 2023), FDB-TLABC (Duman et al. 2022),and TSALSHADE (Abdesslem layeb 2023) as comparison algorithms. Table 17 presents the statistical results of each algorithm’s performance in addressing this problem, with the best results highlighted in bold. From the statistical outcomes depicted in Table 17, it is observed that LSA, FDB-AGDE, dFDB-MRFO, AFDB-SFS, and FDB-TLABC exhibit the most favorable optimization outcomes. In other words, these algorithms achieved the best optimal values among all the evaluated approaches.
4.2.6 Car Side Impact Design (CSID)
The goal of CSID is to minimize weight, which is related to 11 variables and 10 inequality constraints. Its detailed description can be found in the reference (Huang et al. 2015). Meanwhile, EJAYA (Zhang et al. 2021b), TLCS (Huang et al. 2015), AOSMA (Naik et al. 2021), WOAGWO (Mohammed and Rashid 2020), PGJAYA (Yu et al. 2019), ERao-1 (Jian and Zhu 2021), CLJAYA (Zhang and Jin 2022), FDB-AGDE (Guvenc et al. 2021), dFDB-MRFO (Kahraman et al. 2022), AFDB-SFS (Duman et al. 2023), FDB-TLABC (Duman et al. 2022),and TSALSHADE (Abdesslem layeb 2023) were selected to test their performance in solving this problem. The mathematical model of this problem is as follows.
where \(0.5 \le x_{1} ,x_{2} ,x_{3} ,x_{4} ,x_{5} ,x_{6} ,x_{7} \le 1.5\),\(0.192 \le x_{8} ,x_{9} \le 0.345\),\(- 30 \le x_{10} ,x_{10} \le 30\).
The statistical results of LSA on this problem are presented in Table 18. It can be seen from this table that the optimal solution of LSA is 22.842, which is consistent with the same results by FDB-AGDE, dFDB-MRFO, AFDB-SFS, and FDB-TLABC algorithms. The values corresponding to each variable are 0.5, 1.116, 0.5, 1.302, 0.5, 1.5, 0.5, 0.964338, 1.000, -19.577, and 3.73E-07. These results indicate that the LSA algorithm has strong competitiveness.
4.3 Application to real-world optimization of feature selection
In this subsection, the proposed LSA is applied to the feature selection problem to verify the performance of the algorithm in solving optimization problems in this domain. Feature selection refers to selecting a feature subset with good distinguishing characteristics from a feature set according to a target. Therefore, feature selection requires a specific feature evaluation function. The K-nearest neighbor (KNN) algorithm is a classification technique based on supervised machine learning. Because of its characteristics of easy implementation and fast operation, it is often selected as a wrapper-based feature selection method. The fitness function used in feature selection problems has two main goals: a small number of features and the minimum classification error. The most ideal solution to the feature selection problem is to achieve the minimum error by selecting the fewest features. In this paper, the following objective function is adopted to calculate the objective function:
where,\(acc\) represents the accuracy of KNN classification, \(N\) represents the total number of features, and \(N_{i}\) represents the number of features selected by the i-th candidate solution. \(\alpha \in [0,1]\) denotes the weight, \(\beta = 1 - \alpha\). According to the literature (Xu et al. 2023), the values of \(\alpha\) and \(\beta\) are set to 0.99 and 0.01, respectively.
In the above tests, it is shown that the LSA is suitable for solving continuous optimization problems. To this end, it is necessary to convert the value of the search individual in the algorithm into a discrete value of 0 or 1. Denoting the j-th dimension value of the ith individual is \(x_{i,j}\), the conversion is shown below:
where, \(rand \in (0,1)\) is a random number.
To verify the effect of the LSA in feature selection, this paper experimented with the LSA on 15 UCI public datasets. These 15 test cases have different sample numbers (from 72 to 846), and different feature numbers (from 8 to 30). Table 19 presents the basic information of these 15 datasets. The original dataset can be downloaded from the UCI machine learning website http://archive.ics.uci.edu/ml/index.php.
Five algorithms were selected for comparison, including BGWO (Emary et al. 2016), CCSA (Zamani et al. 2019), SCA (Mirjalili 2016), SSA (Xue and Shen 2020), and WOA (Hayyolalam and Kazem 2020). The population size was set to 30, each test case was run 20 times independently, and the average value was taken as the statistical value. All other parameters were kept the same as their corresponding references. Tables 20, 21, and 22 present the feature selection results of each algorithm on the UCI dataset.
Table 20 shows the average fitness value of each algorithm, and the optimal result is shown in bold. It can be seen from Table 20 that except for the four data sets of Breast, Fertility, WDBC, and Vehicle, LSA obtained the best average fitness value among all the other 11 feature selection algorithms. On these 4 datasets, the performance of the LSA is second only to BGWO. Although the feature selection capabilities of CCSA, SCA, SSA, and WOA are very powerful, their results are still significantly worse than those of the LSA. The rankings of these six algorithms in terms of fitness value are LSA, BGWO, WOA, SCA, CCSA, and SSA
Table 21 shows the classification error rate of the LSA and other comparison algorithms on each dataset. It can be seen from this table that the classification error rate of the LSA on Ceramic and Audit-2 is 0 datasets. In the 15 test datasets, LSA ranked first on 12 and ranked second on the other 3 datasets. This proves the absolute superiority of the LSA algorithm. The features of all algorithms on the BreastTissue and Vehicle datasets are difficult to distinguish because the error rate of all algorithms exceeds 25%.
Table 22 presents the average number of features selected by each algorithm. It was found that no algorithm obtained an absolute advantage in the number of features. The main reason is that the weight of the selected feature number in the fitness function is relatively small. As a result, although some algorithms select a few features, their classification accuracy is low. The above analysis indicates that the LSA has strong competitiveness in feature selection.
Figure 19 shows the convergence curves of each algorithm when solving the feature selection problem. It can be seen from Fig. 19 that the LSA has high convergence accuracy and speed when solving such problems.

The convergence curves of all algorithms for the feature section on 9 UCI datasets
5 Conclusion
This paper introduces a novel learning search algorithm (LSA) designed to efficiently and accurately address optimization problems. In the global expansion stage, the algorithm leverages historical knowledge and up-to-date community information to guide the search direction, thereby enhancing its global search capability. In the local development phase, the algorithm employs the teaching behavior and direction of the role model within the population to enhance the learning capability of the entire population. By dynamically adapting the control factor, the algorithm strikes a balance between exploration and exploitation, thereby avoiding local optima and improving convergence speed. Experimental results vividly demonstrate the LSA’s search process for the optimal solution. Initially, 40 CEC 2014 and CEC 2020 benchmark functions are subjected to comparative testing using well-known original algorithms and recently proposed high-performing improved algorithms. Statistical analysis and the Wilcoxon signed rank test substantiate the LSA’s commendable performance and robust competitiveness vis-à-vis other meta-heuristic algorithms. Furthermore, six subsequent engineering design experiments underscore the LSA’s efficacy in solving real-world engineering applications with constraints. Finally, the LSA is used to solve the feature selection problem, and the experimental results on 15 UCI datasets further verify that the proposed algorithm performs significantly better than other methods in terms of classification accuracy and fitness value.
In this study, despite utilizing the LSA algorithm for solving continuous single-objective optimization problems, real-world constrained optimization problems, and real-world optimization of feature selection, limited research has been conducted on solving multi-objective problems. Many practical decision-making problems involve multiple criteria. For example, resource scheduling problems in cloud computing encompass objectives such as minimizing completion time and cost, and maximizing profit. Therefore, in the near future, we intend to further develop and enhance the LSA algorithm to tackle multi-objective optimization problems. Additionally, we aim to incorporate discretization methods into the LSA algorithm to enable it to handle discrete optimization problems, such as resource scheduling problems.
In our future work, we can employ adaptive mechanisms to adjust the parameters and operations of algorithms, enabling them to automatically adapt and improve their performance to different problems. Additionally, we can combine or cooperate metaheuristic algorithms with other optimization algorithms, machine learning methods, etc., to enhance the performance and adaptability of the algorithms. Moreover, LSA can be expanded to solve different optimization problems in various domains, such as neural networks, gene feature selection, shop floor scheduling, big data applications, and more.
Data availability
Data is provided within the manuscript.
References
Abd Elaziz M, Dahou A, Abualigah L, Yu L, Alshinwan M, Khasawneh AM, Lu S (2021) Advanced metaheuristic optimization techniques in applications of deep neural networks: a review. Neural Comput Appl 33(21):14079–14099
Abdel-Basset M, El-Shahat D, Jameel M et al (2023) Exponential distribution optimizer (EDO): a novel math-inspired algorithm for global optimization and engineering problems. Artif Intell Rev:1–72
Abdesslem layeb (2023) TSALSHADE: improved LSHADE algorithm with tangent search. MATLAB central file exchange. https://www.mathworks.com/maTLABCentral/fileexchange/123400-tsalshade-improved-lshade-algorithm-with-tangent-search
Abdolrasol MGM, Hussain SMS, Ustun TS, Sarker MR, Hannan MA, Mohamed R, Ali JA, Mekhilef S, Milad A (2021) Artificial Neural networks based optimization techniques: a review. Electronics 10(21):2689
Abed-Alguni BH, Alawad NA, Barhoush M et al (2021) Exploratory cuckoo search for solving single-objective optimization problems[J]. Soft Comput 25(15):10167–10180
Abualigah L, Shehab M, Alshinwan M et al (2020) Salp swarm algorithm: a comprehensive survey. Neural Comput Appl 32(15):11195–11215
Abualigah L, Diabat A, Mirjalili S et al (2021) The arithmetic optimization algorithm. Comput Methods Appl Mech Eng 376:113609
Agushaka JO, Ezugwu AE, Abualigah L (2022) Dwarf mongoose optimization algorithm. Comput Methods Appl Mech Eng 391:114570
Ahmadianfar I, Heidari AA, Noshadian S et al (2022) INFO: an efficient optimization algorithm based on weighted mean of vectors. Expert Syst Appl 195:116516
Ahmia I, Aider M (2019) A novel metaheuristic optimization algorithm: the monarchy metaheuristic. Turk J Electr Eng Comput Sci 27(1):362–376
Akbari E, Rahimnejad A, Gadsden SA (2021) A greedy non-hierarchical grey wolf optimizer for real-world optimization. Electron Lett 57(13):499–501
Ali MH, El-Rifaie AM, Youssef AAF et al (2023) Techno-economic strategy for the load dispatch and power flow in power grids using peafowl optimization algorithm. Energies 16(2):846
Alsattar HA, Zaidan AA, Zaidan BB (2020) Novel meta-heuristic bald eagle search optimisation algorithm. Artif Intell Rev 53(3):2237–2264
Aragón VS, Esquivel SC, Coello CAC (2010) A modified version of a T-cell algorithm for constrained optimization problems. Internat J Numer Methods Engrg 84(3):351–378
Arora S, Singh S (2019) Butterfly optimization algorithm: a novel approach for global optimization. Soft Comput 23:715–734
Askari Q, Saeed M, Younas I (2020) Heap-based optimizer inspired by corporate rank hierarchy for global optimization. Expert Syst Appl 161:113702
Askarzadeh A (2016) A novel metaheuristic method for solving constrained engineering optimization problems: crow search algorithm. Comput Struct 169:1–12
Aydilek IB (2018) A hybrid firefly and particle swarm optimization algorithm for computationally expensive numerical problems. Appl Soft Comput 66:232–249
Ayyarao TSLV, Ramakrishna NSS, Elavarasan RM et al (2022) War strategy optimization algorithm: a new effective metaheuristic algorithm for global optimization. IEEE Access 10:25073–25105
Bennett S (2011) Learning behaviors and learning spaces. portal: libraries and the academy. 11(3):765–789
Bernardino HS, Barbosa HJC, Lemonge ACC, Fonseca LG (2008) A new hybrid AIS-GA for constrained optimization problems in mechanical engineering. In: 2008 IEEE Congress on Evolutionary Computation (IEEE World Congress on Computational Intelligence). pp 1455–1462
Bertsimas D, Tsitsiklis J (1993) Simulated annealing. Stat Sci 8(1):10–15
Braik MS (2021) Chameleon swarm algorithm: a bio-inspired optimizer for solving engineering design problems. Expert Syst Appl 174:114685
Braik M, Sheta A, Al-Hiary H (2021) A novel meta-heuristic search algorithm for solving optimization problems: capuchin search algorithm. Neural Comput Appl 33(7):2515–2547
Brajevic I (2015) Crossover-based artificial bee colony algorithm for constrained optimization problems. Neural Comput Appl 26(7):1587–1601
Brammya G, Praveena S, Ninu Preetha NS et al (2019) Deer hunting optimization algorithm: a new nature-inspired meta-heuristic paradigm. Comput J 2019:bxy133
Bruner JS (1971) “The process of education” revisited. Phi Delta Kappan 53(1):18–21
Bruner JS (2009) The process of education. Harvard University Press
Carreon-Ortiz H, Valdez F (2022) A new mycorrhized tree optimization nature-inspired algorithm. Soft Comput 26:4797–4817
Chander A, Chatterjee A, Siarry P (2011) A new social and momentum component adaptive PSO algorithm for image segmentation. Expert Syst Appl 38(5):4998–5004
Chen J, Xu H, Wu J et al (2019) Deer crossing road detection with roadside LiDAR sensor. IEEE Access 7:65944–65954
Chen H, Heidari AA, Zhao X et al (2020a) Advanced orthogonal learning-driven multi-swarm sine cosine optimization: framework and case studies. Expert Syst Appl 144:113113
Chen H, Jiao S, Wang M, Heidari AA, Zhao X (2020b) Parameters identification of photovoltaic cells and modules using diversification-enriched Harris hawks optimization with chaotic drifts. J Clean Prod 244:118778
Chen P, Zhou S, Zhang Q et al (2022) A meta-inspired termite queen algorithm for global optimization and engineering design problems. Eng Appl Artif Intell 111:104805
Cheng S, Shi Y, Qin Q et al (2014) Population diversity maintenance in brain storm optimization algorithm[J]. J Artif Intell Soft Comput Res 4(2):83–97
Chickermane H, Gea HC (1996) Structural optimization using a new local approximation method. Internat J Numer Methods Engrg 39(5):829–846
Chopra N, Ansari MM (2022) Golden jackal optimization: a novel nature-inspired optimizer for engineering applications. Expert Syst Appl 198:116924
Chun S, Kim YT, Kim TH (2013) A diversity-enhanced constrained particle swarm optimizer for mixed integer-discrete-continuous engineering design problems. Adv Mech Eng 5:130750
Coello CAC, Cortés NC (2004) Hybridizing a genetic algorithm with an artificial immune system for global optimization. Eng Optim 36(5):607–634
Das S, Suganthan PN (2010) Differential evolution: a survey of the state-of-the-art. IEEE Trans Evol Comput 15(1):4–31
Dehghani M, Trojovský P (2023) Osprey optimization algorithm: a new bio-inspired metaheuristic algorithm for solving engineering optimization problems. Front Mech Eng 8:1126450
Dehghani M, Hubálovský Š, Trojovský P (2021) Northern goshawk optimization: a new swarm-based algorithm for solving optimization problems. Ieee Access 9:162059–162080
Dehghani M, Hubálovský Š, Trojovský P (2022a) Tasmanian devil optimization: a new bio-inspired optimization algorithm for solving optimization algorithm. IEEE Access 10:19599–19620
Dehghani M, Montazeri Z, Trojovská E et al (2023) Coati optimization algorithm: a new bio-inspired metaheuristic algorithm for solving optimization problems. Knowl-Based Syst 259:110011
Dehghani M, Trojovská E, Trojovský P (2022b) Driving training-based optimization: a new human-based metaheuristic algorithm for solving optimization problems. 4. https://doi.org/10.21203/rs.3.rs-1506972/v1
Dehkordi A, Sadiq A, Mirjalili S et al (2021) Nonlinear-based chaotic harris hawks optimizer: algorithm and internet of vehicles application. Appl Soft Comput 109:107574
Dhanya D, Arivudainambi D (2019) Dolphin partner optimization based secure and qualified virtual machine for resource allocation with streamline security analysis. Peer- Peer Netw Appl 12(5):1194–1213
Dhiman G, Kaur A (2019) STOA: a bio-inspired based optimization algorithm for industrial engineering problems. Eng Appl Artif Intell 82:148–174
Dhiman G, Kumar V (2017) Spotted hyena optimizer: a novel bio-inspired based metaheuristic technique for engineering applications. Adv Eng Softw 114:48–70
Dhiman G, Kumar V (2019) Seagull optimization algorithm: theory and its applications for large-scale industrial engineering problems. Knowl-Based Syst 165:169–196
Dhrubajyoti G, Ananda Ra DR, Shibendu Shekhar R (2021) A partition cumunification based genetic-firefly algorithm for single objective optimization. Sādhanā 46(3):1–31
Dorian Sidea (2024) Improved salp swarm algorithm. MATLAB Central File Exchange. https://www.mathworks.com/matlabcentral/fileexchange/155984-improved-salp-swarm-algorithm
Dos Santos Coelho L (2010) Gaussian quantum-behaved particle swarm optimization approaches for constrained engineering design problems. Expert Syst Appl 37(2):1676–1683
Duman S, Kahraman HT, Sonmez Y, Guvenc U, Kati M, Aras S (2022) A powerful meta-heuristic search algorithm for solving global optimization and real-world solar photovoltaic parameter estimation problems. Eng Appl Artif Intell 111:104763
Duman S, Kahraman HT, Kati M (2023) Economical operation of modern power grids incorporating uncertainties of renewable energy sources and load demand using the adaptive fitness-distance balance-based stochastic fractal search algorithm. Eng Appl Artif Intell 117:105501
Emami H (2022) Stock exchange trading optimization algorithm: a human-inspired method for global optimization. J Supercomput 78(2):2125–2174
Emary E, Zawbaa HM, Hassanien AE (2016) Binary grey wolf optimization approaches for feature selection. Neurocomputing 172:371–381
Ewees AA, Al-qaness MAA, Abualigah L (2022) HBO-LSTM: optimized long short term memory with heap-based optimizer for wind power forecasting. Energy Convers Manage 268:116022
Ezugwu AE (2022) Advanced discrete firefly algorithm with adaptive mutation-based neighborhood search for scheduling unrelated parallel machines with sequence-dependent setup times. Int J Intell Syst 37(8):4612–4653
Faramarzi A, Heidarinejad M, Stephens B, Mirjalili S (2020) Equilibrium optimizer: a novel optimization algorithm. Knowl-Based Syst 191:105190
Farshad R, Hamid RS, Mohamed AE, Shaker H, Ali E, Mohammed A, Tamer A (2022) An enhanced grey wolf optimizer with a velocity-aided global search mechanism. Mathematics 10(3):351
Feng Z, Niu W, Liu S (2021) Cooperation search algorithm: a novel metaheuristic evolutionary intelligence algorithm for numerical optimization and engineering optimization problems. Appl Soft Comput 98:106734
Forrest S (1993) Genetic algorithms: principles of natural selection applied to computation. Science 261(5123):872–878
Gandomi AH, Yang XS, Alavi AH (2013) Cuckoo search algorithm: a metaheuristic approach to solve structural optimization problems. Eng Comput 29(1):17–35
Ghafil HN, Jármai K (2020) Dynamic differential annealed optimization: new metaheuristic optimization algorithm for engineering applications. Appl Soft Comput 93:106392
Ghasemi M, Kadkhoda Mohammadi S, Zare M et al (2022) A new firefly algorithm with improved global exploration and convergence with application to engineering optimization. Decis Anal J 5:100125
Gurrola-Ramos J, Hernàndez-Aguirre A, Dalmau-Cedeño O (2020) COLSHADE for real-world single-objective constrained optimization problems. 2020 IEEE Congress on Evolutionary Computation (CEC) 2020, 1–8
Guvenc U, Duman S, Kahraman HT, Aras S, Katı M (2021) Fitness-distance balance based adaptive guided differential evolution algorithm for security-constrained optimal power flow problem incorporating renewable energy sources. Appl Soft Comput 108:107421
Hashim FA, Hussien AG (2022) Snake optimizer: a novel meta-heuristic optimization algorithm. Knowl-Based Syst 242:108320
Hashim FA, Houssein EH, Mabrouk MS, Al-Atabany W, Mirjalili S (2019) Henry gas solubility optimization: a novel physics-based algorithm. Futur Gener Comput Syst 101:646–667
Hayyolalam V, Kazem AAP (2020) Black widow optimization algorithm: a novel meta-heuristic approach for solving engineering optimization problems. Eng Appl Artif Intell 87:103249
Hellwig M, Beyer H (2018) A matrix adaptation evolution strategy for constrained real-parameter optimization. In: 2018 IEEE Congress on Evolutionary Computation (CEC), 2018: 1–8
Holland JH (1992) Adaptation in natural and artificial systems: an introductory analysis with applications to biology, control, and artificial intelligence. MIT Press, pp 211
Huang J, Gao L, Li X (2015) An effective teaching-learning-based cuckoo search algorithm for parameter optimization problems in structure designing and machining processes. Appl Soft Comput 36:349–356
Hussain K, Salleh M, Cheng S et al (2019) On the exploration and exploitation in popular swarm-based metaheuristic algorithms. Neural Comput Appl 31:7665–7683
Ibrahim I, Hossain M, Duck B, Nadarajah M (2020) An improved wind driven optimization algorithm for parameters identification of a triple-diode photovoltaic cell model. Energy Convers Manag 213:112872
Jain M, Singh V, Rani A (2019) A novel nature-inspired algorithm for optimization: squirrel search algorithm. Swarm Evol Comput 44:148–175
James JQ, Li VOK (2015) A social spider algorithm for global optimization. Appl Soft Comput 30:614–627
Jian X, Zhu Y (2021) Parameters identification of photovoltaic models using modified Rao-1 optimization algorithm. Optik 231:166439
Kahraman H, Bakir H, Duman S, Katı M, Aras S, Guvenc U (2022) Dynamic FDB selection method and its application: modeling and optimizing of directional overcurrent relays coordination. Appl Intell 52:4873–4908
Kahraman HT, Katı M, Aras S, Taşci D (2023) Development of the Natural Survivor Method (NSM) for designing an updating mechanism in metaheuristic search algorithms. Eng Appl Artif Intell 122:106121
Kaidi W, Khishe M, Mohammadi M (2022) Dynamic levy flight chimp optimization. Knowl-Based Syst 235:107625
Kallioras NA, Lagaros ND, Avtzis DN (2018) Pity beetle algorithm – a new metaheuristic inspired by the behavior of bark beetles. Adv Eng Softw 121:147–166
Karami H, Anaraki MV, Farzin S, Mirjalili S (2021) Flow direction algorithm (fda): a novel optimization approach for solving optimization problems. Comput Ind Eng 156:107224
Kaur S, Awasthi LK, Sangal AL et al (2020) Tunicate Swarm Algorithm: a new bio-inspired based metaheuristic paradigm for global optimization. Eng Appl Artif Intell 90:103541
Kaveh A, Bakhshpoori T (2016) Water evaporation optimization: a novel physically inspired optimization algorithm. Comput Struct 167:69–85
Kaveh A, Dadras A (2017) A novel meta-heuristic optimization algorithm: thermal exchange optimization. Adv Eng Softw 110:69–84
Kaveh A, Talatahari S (2010) A novel heuristic optimization method: charged system search. Acta Mech 213(3):267–289
Kaveh A, Seddighian MR, Ghanadpour E (2020a) Black hole mechanics optimization: a novel meta-heuristic algorithm. Asian Journal of Civil Engineering 21(7):1129–1149
Kaveh A, Akbari H, Hosseini SM (2020b) Plasma generation optimization: a new physically-based metaheuristic algorithm for solving constrained optimization problems. Eng Comput 38(4):1554–1606
Khalilpourazari S, Doulabi HH, Çiftçioğlu AÖ et al (2021) Gradient-based grey wolf optimizer with Gaussian walk: application in modelling and prediction of the COVID-19 pandemic. Expert Syst Appl 177:114920
Khelil K, Nicolas Z, Naoufel C, Samir BB (2022) Exponential particle swarm optimization for global optimization. IEEE Access 10:78320–78344
Kılkış Ş, Kılkış B (2019) An urbanization algorithm for districts with minimized emissions based on urban planning and embodied energy towards net-zero exergy targets. Energy 179:392–406
Kumar DS, Zelinka I (2020) A self-adaptive spherical search algorithm for real-world constrained optimization problems. Proceedings of the 2020 Genetic and Evolutionary Computation Conference Companion, 2020:13–14
Kumar A, Das S, Zelinka I (2020) A modified covariance matrix adaptation evolution strategy for real-world constrained optimization problems. Proceedings of the 2020 Genetic and Evolutionary Computation Conference Companion, 2020:11–12
Kundu T, Garg H (2022) A hybrid TLNNABC algorithm for reliability optimization and engineering design problems. Eng Comp 38(6):5251–5295
Li C, Yang S, Nguyen TT (2011) A self-learning particle swarm optimizer for global optimization problems. IEEE Trans Syst Man Cybernetics B Cybern 42(3):627–646
Li L, Chang YB, Tseng ML et al (2020a) Wind power prediction using a novel model on wavelet decomposition-support vector machines-improved atomic search algorithm. J Clean Prod 270:121817
Li S, Chen H, Wang M et al (2020c) Slime mould algorithm: a new method for stochastic optimization. Futur Gener Comput Syst 111:300–323
Li Z, Liang Y, Liao Q, Zhang H (2021) A review of multiproduct pipeline scheduling: from bibliometric analysis to research framework and future research directions. J Pipeline Sci Eng 1(4):395–406
Li Z, Tam V, Yeung LK (2020b) A study on parameter sensitivity analysis of the virus spread optimization. 2020 IEEE Symposium Series on Computational Intelligence (SSCI). IEEE, 1535–1542
Liang J, Qiao K, Yu K, Ge S, Qu B, Xu R, Li K (2020) Parameters estimation of solar photovoltaic models via a self-adaptive ensemble-based differential evolution. Sol Energy 207:336–346
Lin X, Yu X, Li W (2022) A heuristic whale optimization algorithm with niching strategy for global multi-dimensional engineering optimization. Comput Ind Eng 171:108361
Liu H, Gu F, Zhang Q (2013) Decomposition of a multiobjective optimization problem into a number of simple multiobjective subproblems. IEEE Trans Evol Comput 18(3):450–455
Long W, Wu T, Tang M, Xu M, Cai S (2020) Grey wolf optimizer algorithm based on lens imaging learning strategy. Acta Automat Sin 46(10):2148–2164
Mandal M, Mukhopadhyay A (2015) A novel PSO-based graph-theoretic approach for identifying most relevant and non-redundant gene markers from gene expression data. Int J Parallel Emergent Distrib Syst 30(3):175–192
Martello S, Pulleyblank WR, Toth, de Werra D (1984) Balanced optimization problems. Oper Res Lett 3(5):275–278
Masadeh R, Mahafzah BA, Sharieh A (2019) Sea lion optimization algorithm. Int J Adv Comput Sci Appl 10(5):388–395
McFarland D, Bösser T, Bosser T (1993) Intelligent behavior in animals and robots. Mit Press
Meng XB, Li HX, Gao XZ (2019) An adaptive reinforcement learning-based bat algorithm for structural design problems. Int J Bio-Inspired Comput 14(2):114–124
Meng OK, Pauline O, Kiong SC (2021) A carnivorous plant algorithm for solving global optimization problems. Appl Soft Comput J 98:106833
Mirjalili S (2015a) The ant lion optimizer. Adv Eng Softw 83:80–98
Mirjalili S (2015b) Moth-flame optimization algorithm: a novel nature-inspired heuristic paradigm. Knowl-Based Syst 89:228–249
Mirjalili S (2016) SCA: a sine cosine algorithm for solving optimization problems. Knowl-Based Syst 96:120–133
Mirjalili S, Mirjalili SM, Lewis A (2014) Grey wolf optimizer. Adv Eng Softw 69:46–61
Mirjalili S, Gandomi AH, Mirjalili SZ, Shahrzad S, Hossam F, Seyed M (2017) Salp swarm algorithm: a bio-inspired optimizer for engineering design problems. Adv Eng Softw 114:163–191
Mirjalili S (2019) Genetic algorithm. Evolutionary algorithms and neural networks. Springer, Cham, pp 43–55
Moghaddam FF, Moghaddam RF (2012) Cheriet M. Curved space optimization: a random search based on general relativity theory. arXiv preprint arXiv:1208.2214
Mohammadi-Balani A, Nayeri MD, Azar A, Taghizadeh-Yazdi M (2021) Golden eagle optimizer: a nature-inspired metaheuristic algorithm. Comput Ind Eng 152:107050
Mohammed H, Rashid T (2020) A novel hybrid GWO with WOA for global numerical optimization and solving pressure vessel design. Neural Comput Appl 32:14701–14718
Montemurro M, Vincenti A, Vannucci P (2013) The automatic dynamic penalization method (ADP) for handling constraints with genetic algorithms. Comput Methods Appl Mech Engrg 256:70–87
Moscato P, Cotta C, Mendes A (2004) Memetic algorithms. New optimization techniques in engineering. Springer, Berlin, Heidelberg, pp 53–85
Naik MK, Panda R, Abraham A (2021) Adaptive opposition slime mould algorithm. Soft Comput 25:14297–14313
Naruei I, Keynia F (2022) Wild horse optimizer: a new meta-heuristic algorithm for solving engineering optimization problems. Eng with Comput 38(4):3025–3056
Naruei I, Keynia F, Sabbagh Molahosseini A (2022) Hunter–prey optimization: algorithm and applications. Soft Comput 26(3):1279–1314
Nematollahi AF, Rahiminejad A, Vahidi B (2017) A novel physical based meta-heuristic optimization method known as lightning attachment procedure optimization. Appl Soft Comput 59:596–621
Nematollahi AF, Rahiminejad A, Vahidi B (2020) A novel meta-heuristic optimization method based on golden ratio in nature. Soft Comput 24(2):1117–1151
Onay FK, Aydemı̇r SB (2022) Chaotic hunger games search optimization algorithm for global optimization and engineering problems. Math Comput Simul 192:514–536
Örnek BN, Aydemir SB, Düzenli T et al (2022) A novel version of slime mould algorithm for global optimization and real world engineering problems: enhanced slime mould algorithm. Math Comput Simul 198:253–288
Pan H, Wang L, Liu B (2006) Particle swarm optimization for function optimization in noisy environment. Appl Math Comput 181(2):908–919
Pan JS, Sun B, Chu SC et al (2023) A parallel compact gannet optimization algorithm for solving engineering optimization problems. Mathematics 11(2):439
Parsopoulos E, Vrahatis MN (2002) Recent approaches to global optimization problems through particle swarm optimization. Nat Comput 1(2):235–306
Peraza-Vázquez H, Peña-Delgado AF, Echavarría-Castillo G et al (2021) A bio-inspired method for engineering design optimization inspired by dingoes hunting strategies. Math Probl Eng 2021:9107547
Pham TX, Siarry P, Oulhadj H (2018) Integrating fuzzy entropy clustering with an improved PSO for MRI brain image segmentation. Appl Soft Comput 65:230–242
Połap D, Woźniak M (2021) Red fox optimization algorithm. Expert Syst Appl 166:114107
Poli R, Kennedy J, Blackwell T (2007) Particle swarm optimization. Swarm Intell 1(1):33–57
Qiao W, Lu H, Zhou G et al (2020) A hybrid algorithm for carbon dioxide emissions forecasting based on improved lion swarm optimizer. J Clean Prod 244:118612
Rachdi E, El Merabet Y, Akhtar Z et al (2020) Directional neighborhood topologies based multi-scale quinary pattern for texture classification. IEEE Access 8:212233–212246
Ramshanker A, Chakraborty S (2022) Maiden application of skill optimization algorithm on cascaded multi-level neuro-fuzzy based power system stabilizers for damping oscillations. Int J Renew Energy Res (IJRER) 12(4):2152–2167
Rao R, Savsani V, Vakharia D (2011) Teaching–learning-based optimization: a novel method for constrained mechanical design optimization problems. Comput Aided Des 43(3):303–315
Rao RV, Savsani VJ, Balic J (2012) Teaching-learning-based optimization algorithm for unconstrained and constrained real-parameter optimization problems. Eng Optim 44(12):1447–1462
Rejowski J, Pinto JM (2003) Scheduling of a multiproduct pipeline system. Comput Chem Eng 27(8):1229–1246
Ruan Y, Li KY, Zheng R et al (2022) Cholinergic neurons in the pedunculopontine nucleus guide reversal learning by signaling the changing reward contingency. Cell Rep 38(9):110437
Salimi H (2015) Stochastic fractal search. a powerful metaheuristic algorithm. Knowl-Based Syst 75:1–18
Saremi S, Mirjalili S, Lewis A (2017) Grasshopper optimisation algorithm: theory and application. Adv Eng Softw 105:30–47
Schoenewolf G (1990) Emotional contagion: behavioral induction in individuals and groups. Mod Psychoanal 15(1):49–61
Schwefel HP, Rudolph G (1995) Contemporary evolution strategies. European conference on artificial life. Springer, Berlin, Heidelberg, pp 891–907
Seo JH, Im CH, Heo CG (2006) Multimodal function optimization based on particle swarm optimization. IEEE Trans Magn 42(4):1095–1098
Sette S, Boullart L (2001) Genetic programming: principles and applications. Eng Appl Artif Intell 14(6):727–736
Seyyedabbasi A, Kiani F (2023) Sand Cat swarm optimization: a nature-inspired algorithm to solve global optimization problems. Eng Comput 39(4):2627–2651
Sharma A, Shoval S, Sharma A, Jitendra KP (2022) Path planning for multiple targets interception by the swarm of UAVs based on swarm intelligence algorithms: a review. IETE Tech Rev 39(3):675–697
Shi XH, Liang YC, Lee HP et al (2005) An improved GA and a novel PSO-GA-based hybrid algorithm. Inf Process Lett 93(5):255–261
Shitu S, Jagdish CB (2022) Mutation-driven grey wolf optimizer with modified search mechanism. Expert Syst Appl 194:116450
Shubham G, Kusum D (2020) A memory-based grey wolf optimizer for global optimization tasks. Appl Soft Comput 93:106367
Solis F, Wets J (1981) Minimization by random search techniques. Math Oper Res 6(1):19–30
Song S, Wang P, Heidari AA, Wang M, Zhao X, Chen H, He W, Xu S (2021) Dimension decided Harris Hawks optimization with Gaussian mutation: balance analysis and diversity patterns. Knowl-Based Syst 215:106425
Sun X, Croke B, Roberts S et al (2021) Comparing methods of randomizing Sobol′ sequences for improving uncertainty of metrics in variance-based global sensitivity estimation. Reliab Eng Syst Saf 210:107499
Tian G, Fathollahi-Fard AM, Ren Y, Li Z, Jiang X (2022) Multi-objective scheduling of priority-based rescue vehicles to extinguish forest fires using a multi-objective discrete gravitational search algorithm. Inf Sci 608:578–596
Trivedi A, Srinivasan D, Biswas N (2018) An improved unified differential evolution algorithm for constrained optimization problems. 2018 IEEE Congress on Evolutionary Computation (CEC), 2018:1–10
Trojovská E, Dehghani M (2022) A new human-based metahurestic optimization method based on mimicking cooking training. Sci Rep 12(1):14861
Trojovská E, Dehghani M, Trojovský P (2022) Zebra optimization algorithm: a new bio-inspired optimization algorithm for solving optimization algorithm. IEEE Access 10:49445–49473
Trojovský P, Dehghani M (2022) Pelican optimization algorithm: a novel nature-inspired algorithm for engineering applications. Sensors 22(3):855
Trojovský P, Dehghani M (2023) Subtraction-average-based optimizer: a new swarm-inspired metaheuristic algorithm for solving optimization problems. Biomimetics 8(2):149
Tutueva AV, Nepomuceno EG, Karimov AI et al (2020) Adaptive chaotic maps and their application to pseudo-random numbers generation. Chaos Solitons Fractals 133:109615
Wang GG, Deb S, Cui Z (2019) Monarch butterfly optimization. Neural Comput Appl 31:1995–2014
Wang L, Cao Q, Zhang Z et al (2022a) Artificial rabbits optimization: a new bio-inspired meta-heuristic algorithm for solving engineering optimization problems. Eng Appl Artif Intell 114:105082
Wang Z, Pan J, Huang K et al (2022b) Hybrid gray wolf optimization and cuckoo search algorithm based on the taguchi theory. Advances in intelligent information hiding and multimedia signal processing. Springer, Singapore, pp 219–228
Wilson AJ, Pallavi DR, Ramachandran M (2022) A review on memetic algorithms and its developments. Electrical Automation Eng 1(1):7–12
Xu Z, Heidari AA, Kuang F et al (2023) Enhanced Gaussian bare-bones grasshopper optimization: mitigating the performance concerns for feature selection. Expert Syst Appl 212:118642
Xue J, Shen B (2020) A novel swarm intelligence optimization approach: sparrow search algorithm. Syst Sci Control Eng 8(1):22–34
Xue J, Shen B (2023) Dung beetle optimizer: a new meta-heuristic algorithm for global optimization. J Supercomput 79(7):7305–7336
Yaghini M, Khoshraftar MM, Fallahi M (2013) A hybrid algorithm for artificial neural network training. Eng Appl Artif Intell 26(1):293–301
Yang XS, Deb S (2014) Cuckoo search: recent advances and applications. Neural Comput Appl 24(1):169–174
Yapici H, Cetinkaya N (2019) A new meta-heuristic optimizer: pathfinder algorithm. Appl Soft Comput 78:545–568
Yazdani M, Jolai F (2016) Lion Optimization Algorithm (LOA): a nature-inspired metaheuristic algorithm. J Comput Des Eng 3(1):24–36
Yu K, Qu B, Yue C, Ge S, Chen X, Liang J (2019) A performance-guided JAYA algorithm for parameters identification of photovoltaic cell and module. Apply Energy 237:241–257
Yu H, Gao Y, Wang L et al (2020) A hybrid particle swarm optimization algorithm enhanced with nonlinear inertial weight and Gaussian mutation for job shop scheduling problems. Mathematics 8(8):1355
Zamani H, Nadimi-Shahraki MH, Gandomi AH (2019) CCSA: conscious neighborhood-based crow search algorithm for solving global optimization problems. Appl Soft Comput 85:105583
Zervoudakis K, Tsafarakis S (2020) A mayfly optimization algorithm. Comput Ind Eng 145:106559
Zhang Y, Jin Z (2022) Comprehensive learning Jaya algorithm for engineering design optimization problems. J Intell Manuf 33(5):1229–1253
Zhang J, Xiao M, Gao L, Pan Q (2018) Queuing search algorithm: a novel metaheuristic algorithm for solving engineering optimization problems. Appl Math Model 63:464–490
Zhang M, Long D, Qin T et al (2020) A chaotic hybrid butterfly optimization algorithm with particle swarm optimization for high-dimensional optimization problems. Symmetry 12(11):1800
Zhang Q, Li H, Liu Y et al (2021a) A new quantum particle swarm optimization algorithm for controller placement problem in software-defined networking. Comput Electr Eng 95:107456
Zhang Y, Chi A, Mirjalili S (2021b) Enhanced Jaya algorithm: a simple but efficient optimization method for constrained engineering design problems. Knowl-Based Syst 233:107555
Zhang H, Liu T, Ye X, Heidari AA, Liang G, Chen H, Pan Z (2022) Differential evolution-assisted salp swarm algorithm with chaotic structure for real-world problems. Eng Comput:1–35
Zhao W, Wang L, Zhang Z (2019) Supply-demand-based optimization: a novel economics-inspired algorithm for global optimization. IEEE Access 7:73182–73206
Zhong C, Li G, Meng Z (2022) Beluga whale optimization: a novel nature-inspired metaheuristic algorithm. Knowl-Based Syst 251:109215
Zitouni F, Harous S, Maamri R (2020) The solar system algorithm: a novel metaheuristic method for global optimization. IEEE Access 9:4542–4565
Zitouni F, Harous S, Belkeram A, Hammou LEB (2021) The Archerfish hunting optimizer: a novel metaheuristic algorithm for global optimization. Arab J Sci Eng. https://doi.org/10.1007/s13369-021-06208-z
Acknowledgements
This study was jointly supported by the National Natural Science Foundation of China (Grant Number 62341210), Science and Technology Development Plan for Baise City (Grant Number 20233654).
Author information
Authors and Affiliations
Contributions
Chiwen Qu: Writing - original draft, Visualization, Formal analysis, Validation. Xiaoning Peng: Supervision, Project administration. Qilan Zeng: Project Administration, Writing - Review & Editing, Supervision.
Corresponding author
Ethics declarations
Competing interests
The authors declare no competing interests.
Additional information
Publisher's Note
Springer Nature remains neutral with regard to jurisdictional claims in published maps and institutional affiliations.
Appendix
Appendix
See Tables 23, 24, 25, 26, 27, 28, 29, and 30
Rights and permissions
Open Access This article is licensed under a Creative Commons Attribution 4.0 International License, which permits use, sharing, adaptation, distribution and reproduction in any medium or format, as long as you give appropriate credit to the original author(s) and the source, provide a link to the Creative Commons licence, and indicate if changes were made. The images or other third party material in this article are included in the article's Creative Commons licence, unless indicated otherwise in a credit line to the material. If material is not included in the article's Creative Commons licence and your intended use is not permitted by statutory regulation or exceeds the permitted use, you will need to obtain permission directly from the copyright holder. To view a copy of this licence, visit http://creativecommons.org/licenses/by/4.0/.
About this article

Cite this article
Qu, C., Peng, X. & Zeng, Q. Learning search algorithm: framework and comprehensive performance for solving optimization problems. Artif Intell Rev 57, 139 (2024). https://doi.org/10.1007/s10462-024-10767-6
Accepted:
Published:
DOI: https://doi.org/10.1007/s10462-024-10767-6